


 Arguments


Is the CO2 effect saturated?
What the science says...
| Select a level... |
 Basic
Basic
|
 Intermediate
|
 Advanced
| ||||
|
The notion that the CO2 effect is 'saturated' is based on a misunderstanding of how the greenhouse effect works. |
|||||||
Climate Myth...
CO2 effect is saturated
"Each unit of CO2 you put into the atmosphere has less and less of a warming impact. Once the atmosphere reaches a saturation point, additional input of CO2 will not really have any major impact. It's like putting insulation in your attic. They give a recommended amount and after that you can stack the insulation up to the roof and it's going to have no impact." (Marc Morano, as quoted by Steve Eliot)
At-a-Glance
This myth relies on the use (or in fact misuse) of a particular word – 'saturated'. When someone comes in from a prolonged downpour, they may well exclaim that they are saturated. They cannot imagine being any wetter. That's casual usage, though.
In science, 'saturated' is a strictly-defined term. For example, in a saturated salt solution, no more salt will dissolve, period. But what's that got to do with heat transfer in Earth's atmosphere? Let's take a look.
Heat-trapping by CO2 in the atmosphere happens because it has the ability to absorb and pass on infra-red radiation – it is a 'greenhouse gas'. Infra-red is just one part of the electromagnetic spectrum, divided by physicists into a series of bands. From the low-frequency end of the spectrum upwards, the bands are as follows: radio waves, microwaves, infrared, visible light, ultraviolet, X-rays, and gamma rays. Gamma rays thus have a very high-frequency. They are the highest-energy form of radiation.
As our understanding of the electromagnetic spectrum developed, it was realised that the radiation consists of particles called 'photons', travelling in waves. The term was coined in 1926 by the celebrated physicist Gilbert Lewis (1875-1946). A photon's energy is related to its wavelength. The shorter the wavelength, the higher the energy, so that the very high-energy gamma-rays have the shortest wavelength of the lot.
Sunshine consists mostly of ultraviolet, visible light and infra-red photons. Objects warmed by the sun then re-emit energy photons at infra-red wavelengths. Like other greenhouse gases, CO2 has the ability to absorb infra-red photons. But CO2 is unlike a mop, which has to be wrung out regularly in order for it to continue working. CO2 molecules do not get filled up with infra-red photons. Not only do they emit their own infra-red photons, but also they are constantly colliding with neighbouring molecules in the air. The constant collisions are important. Every time they happen, energy is shared out between the colliding molecules.
Through those emissions and collisions, CO2 molecules constantly warm their surroundings. This goes on all the time and at all levels in the atmosphere. You cannot say, “CO2 is saturated because the surface-emitted IR is rapidly absorbed”, because you need to take into account the whole atmosphere and its constant, ongoing energy-exchange processes. That means taking into account all absorption, all re-emission, all collisions, all heating and cooling and all eventual loss to space, at all levels.
If the amount of radiation lost to space is equal to the amount coming in from the Sun, Earth is said to be in energy balance. But if the strength of the greenhouse effect is increased, the amount of energy escaping falls behind the amount that is incoming. Earth is then said to be in an energy imbalance and the climate heats up. Double the CO2 concentration and you get a few degrees of warming: double it again and you get a few more and on and on it goes. There is no room for complacency here. By the time just one doubling has occurred, the planet would already be unrecognisable. The insulation analogy in the myth is misleading because it over-simplifies what happens in the atmosphere.
Please use this form to provide feedback about this new "At a glance" section. Read a more technical version below or dig deeper via the tabs above!
Further details
This myth relies on the use of a word – saturated. When we think of saturated in everyday use, the term 'soggy' comes to mind. This is a good example of a word that has one meaning in common parlance but another very specific one when thinking about atmospheric physics. Other such words come to mind too. Absorb and emit are two good examples relevant to this topic and we’ll discuss how they relate to atmospheric processes below.
First things first. The effect of CO2 in the atmosphere is due to its influence on the transport of 'electromagnetic radiation' (EMR). EMR is energy that is moving as x-rays, ultraviolet (UV) light, visible light, infrared (IR) radiation and so on (fig. 1). Radiation is unusual in the sense that it contains energy but it is also always moving, at the speed of light, so it is also a form of transport. Radiation is also unusual in that it has properties of particles but also travels with the properties of waves, so we talk about its wavelength.
The particles making up radiation are known as photons. Each photon contains a specific amount of energy, and that is related to its wavelength. High energy photons have short wavelengths, and low energy photons have longer wavelengths. In climate, we are interested in two main radiation categories - firstly the visible light plus UV and minor IR that together make up sunshine, and secondly the IR from the earth-atmosphere system.
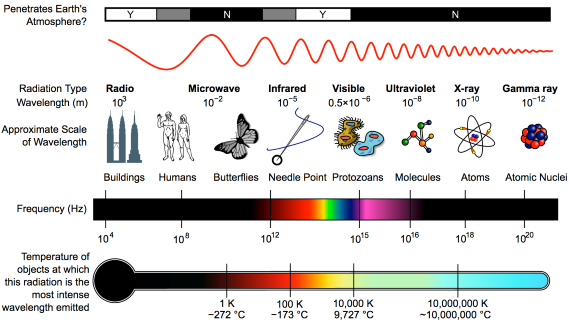
Fig. 1: diagram showing the full electromagnetic spectrum and its properties of the different bands. Image: CC BY-SA 3.0 from Wikimedia.
CO2 has the ability to absorb IR photons – it is a 'greenhouse gas'.So what does “absorb” mean, when talking about radiation? We are all familiar with using a sponge to mop up a water spill. The sponge will only absorb so much and will not absorb any more unless it's wrung out. In everyday language it may be described, without measurements, as 'saturated'. In this household example, 'absorb' basically means 'soak up' and 'saturated' simply means 'full to capacity'. Scientific terms are, in contrast, strictly defined.
Now let's look at the atmosphere. The greenhouse effect works like this: energy arrives from the sun in the form of visible light and ultraviolet radiation. A proportion reaches and warms Earth's surface. Earth then emits the energy in the form of photons of IR radiation.
Greenhouse gases in the atmosphere, such as CO2 molecules, absorb some of this IR radiation, then re-emit it in all directions - including back to Earth's surface. The CO2 molecule does not fill up with IR photons, running out of space for any more. Instead, the CO2 molecule absorbs the energy from the IR photon and the photon ceases to be. The CO2 molecule now contains more energy, but that is transient since the molecule emits its own IR photons. Not only that: it's constantly colliding with other molecules such as N2 and O2 in the surrounding air. In those collisions, that excess energy is shared with them. This energy-sharing causes the nearby air to heat up (fig. 2).
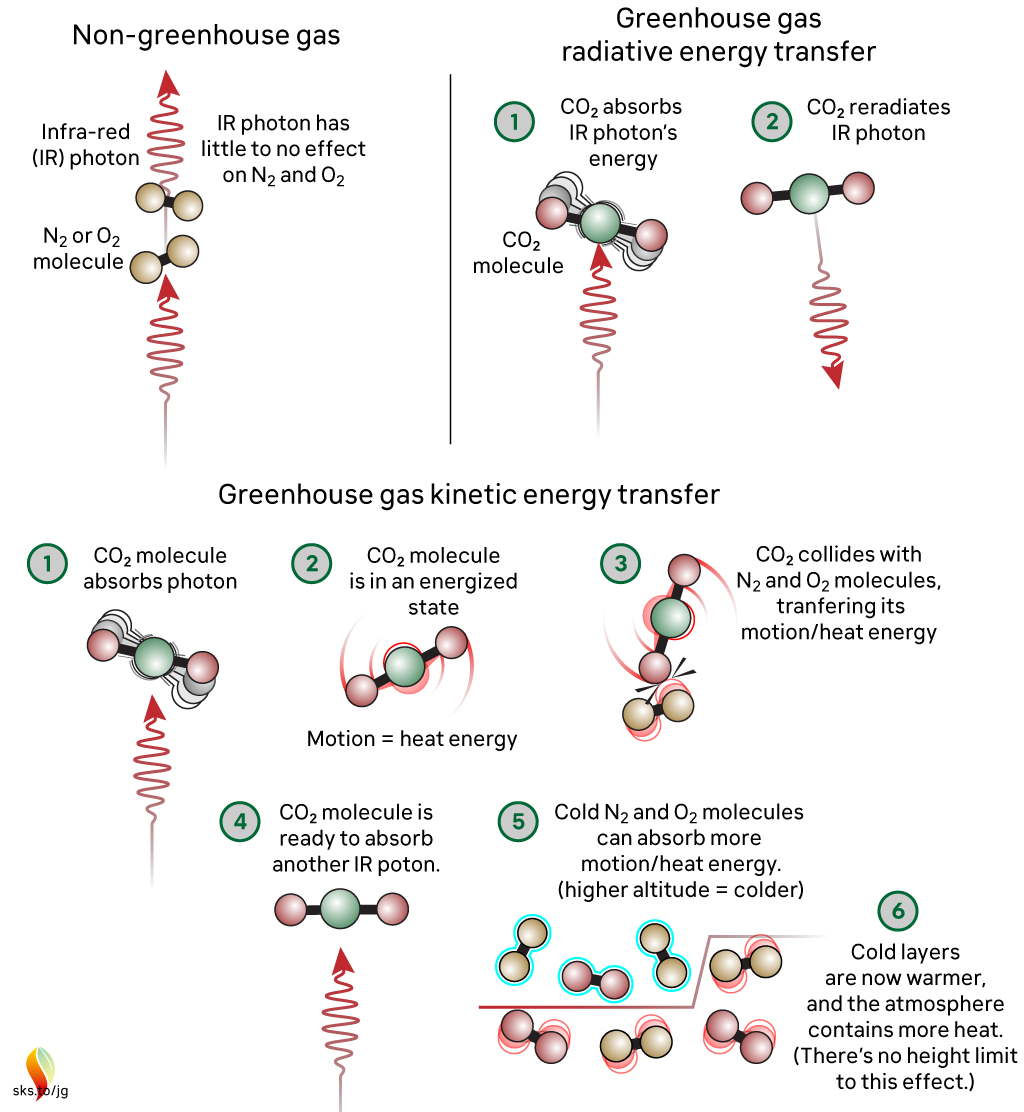
Fig. 2: The greenhouse effect in action, showing the interactions between molecules. The interactions happen at all levels of the atmosphere and are constantly ongoing. Graphic: jg.
The capacity for CO2 to absorb photons is almost limitless. The CO2 molecule can also receive energy from collisions with other molecules, and it can lose energy by emitting IR radiation. When a photon is emitted, we’re not bringing a photon out of storage - we are bringing energy out of storage and turning it into a photon, travelling away at the speed of light. So CO2 is constantly absorbing IR radiation, constantly emitting IR radiation and constantly sharing energy with the surrounding air molecules. To understand the role of CO2, we need to consider all these forms of energy storage and transport.
So, where does 'saturation' get used in climate change contrarianism? The most common way they try to frame things is to claim that IR emitted from the surface, in the wavelengths where CO2 absorbs, is all absorbed fairly close to the surface. Therefore, the story continues, adding more CO2 can’t make any more difference. This is inaccurate through omission, because either innocently or deliberately, it ignores the rest of the picture, where energy is constantly being exchanged with other molecules by collisions and CO2 is constantly emitting IR radiation. This means that there is always IR radiation being emitted upwards by CO2 at all levels in the atmosphere. It might not have originated from the surface, but IR radiation is still present in the wavelengths that CO2 absorbs and emits. When emitted in the upper atmosphere, it can and will be lost to space.
When you include all the energy transfers related to the CO2 absorption of IR radiation – the transfer to other molecules, the emission, and both the upward and downward energy fluxes at all altitudes - then we find that adding CO2 to our current atmosphere acts to inhibit the transfer of radiative energy throughout that atmosphere and, ultimately, into space. This will lead to additional warming until the amount of energy being lost to space matches what is being received. This is precisely what is happening.
The myth reproduced at the top – incorrectly stating an analogy with roof insulation in that each unit has less of an effect - is misleading. Doubling CO2 from 280 ppm to 560 ppm will cause a few degrees of warming. Doubling again (560 to 1130 ppm) will cause a similar amount of additional warming, and so on. Many doublings later there may be a point where adding more CO2 has little effect, but recent work has cast serious doubt on that (He et al. 2023). But we are a long, long way from reaching that point and in any case we do not want to go anywhere near it! One doubling will be serious enough.
Finally, directly observing the specific, global radiative forcing caused by well-mixed greenhouse gases has - to date - proven elusive. This is because of irregular, uncalibrated or limited areal measurements. But very recently, results have been published regarding the deep reinterrogation of years of data (2003-2021) from the Atmospheric Infrared Sounder (AIRS) instrument on NASA's Aqua Satellite (Raghuraman et al. 2023). The work may well have finally cracked the long-standing issue of how to make finely detailed, consistent wavelength-specific measurements of outgoing long-wave radiation from Earth into space. As such, it has opened the way to direct monitoring of the radiative impact (i.e. forcing + feedback) of greenhouse gas concentration changes, thereby complimenting the Keeling Curve - the longstanding dataset of measured CO2 concentrations, down at the planet's surface.
Note: Several people in addition to John Mason were involved with updating this basic level rebuttal, namely Bob Loblaw, Ken Rice and John Garrett (jg).
Last updated on 31 December 2023 by John Mason. View Archives


Oh, my, Ingrahammark7. You certainly are persistent in your misunderstandings.
You said in #599: "This does not take any math, or diagrams, if insulation worked in a linear way then it would lead to absurd outcomes and everyone would already be dead."
Well, your diagram linked to in #596 must have taken some math, so let's see if we can reproduce it. (And remember that "linear" statement - we'll test it later on.) First, I wll establish some assumptions:
What amount of heating is required to maintain that temperature difference for different wall thickness?
The equation we want is
At 1m thickness, we need 1000W (or 1 W/m2 of wall area).
We can graph the heat required as a function of wall width and get this:
So, here we can see the "diminishing returns" that Ingrahammark7 thinks proves the CO2 effect is saturated.
Let's look at our wall thickness calculations slightly differently. As MA Rodger points out in #598, buildings have thermostats. In a building,we want to know how much heat it takes to maintain a certain temperature or amount of warming, as in the above diagram (and the one that Ingrahammark7 chose to display).
...but that is not what is happening in the earth-atmopshere system. We have a slightly different set of conditions:
How does our building behave in similar conditions? We will work with a matching set of assumptions:
Now, our temperature difference needs to be calculated. We rearrange the above questions, and get:
What does our graph look like when we plot temperature difference against wall thickness?
...and Ingrahammark7's "diminishing returns" go *poof*. The temperature difference is a linear function of wall thickness for constant heat input. It turns out that unless you turn the heat down, adding too many blankets will kill you. (And the linearity is obvious from the equation.)
So, Ingrahammark7's "obvious" argument is obviously wrong.
In #600, Ingrahammark7 says "The temperature gradient in the atmosphere is determined by pressure."
Oh, my, you're in that group of alternate physics. I suspect there is no hope for you.
You may wish to continue alternative explanations of the atmospheric temperature gradient on this thread. Please actually read the post before you start commenting, though. I doubt you have any new arguments to make.
https://skepticalscience.com/postma-disproved-the-greenhouse-effect.htm
Oops. I dropped a factor of 1000 when I first made the image in comment #601. I have corrected the image.
Bob Loblaw @602,
I think the comment from Ingragammark7 @600 that "The temperature gradient in the atmosphere is determined by pressure." is not actually away with the faries as I see it as a less-than-precise description of the Lapse Rate being close to adiabatic, thus atmospheric pressure & temperature are strongly linked. It is the statement following that quote from #600 "The greenhouse effect would break this relationship and raise temperatures at lower altitudes where diminishing returns is less." that makes no sense to me.
As DB said years ago, this is not quite like reinventing the wheel but rather reinventing the flat tire..
MAR:
Possibly, but Ingrahammark7's statement also resembles the kind of thing you'd hear from the group that think there is absolutely no greenhouse effect, no backradiation, violates the 2nd, law, etc., and pressure is the only factor.
Ingrahammark7's understanding of basic physics hasn't been very good so far.
My question for Ingrahammark7 is, given that what is being explained here is science that's been well accepted for over a century, what makes you think that somehow the world's leading scientists don't understand something that, as you put it, would be obvious to a small child?
I find that to be a rather ridiculous position to put forth.
Ingrahammark7's: "Chart the incremental temperature insulation from different thicknesses of co2" is a little cryptic a question but it seems that the Iacono & Clough 95 paper would answer that, to an extent, I think (hard to tell, the language is a little puzzling). The Iacono & Clough graph is featured in post #381 of this thread by Tom Curtis.
This following statement, to me, is not making enough sense to try to answer: "You chart should be utterly absurd because you have to explain why the first few co2 cause the entire effect and once you get to hundreds or thousands of feet which exist a doubling does nothing."
Philippe Chantreau @608,
I'm not too sure that fig 5 from Clough & Iacono (1995) is particularly useful at "Chart(ing) the incremental temperature insulation from different thicknesses of co2." as Ingrahammark7 @599 requests.
Looking back @381, I note within-thread much use of output from Chicago Uni's MODTRAN. Running that model for the planet with only CO2 as a GHG for different ppm yields the following reductions in OLR for (as Ingrahammark7 puts it) "different thicknesses of co2" with no sign that "a doubling does nothing."
0ppm(v) ... ... ... ... 0 Wm^-2
0.375ppm(v)... ... 3.45 Wm^-2
0.75ppm(v) ... ... 5.02 Wm^-2
1.5ppm(v) . ... ... 7.22 Wm^-2
3ppm(v) .. ... ... 10.05 Wm^-2
6ppm(v) .. ... ... 13.19 Wm^-2
12ppm(v) . ... ... 16.64 Wm^-2
25ppm(v) . ... ... 20.41 Wm^-2
50ppm(v) . ... ... 24.18 Wm^-2
100ppm(v)... ... 27.63 Wm^-2
150ppm(v)... ... 29.83 Wm^-2
200ppm(v)... ... 31.40 Wm^-2
250ppm(v)... ... 32.34 Wm^-2
300ppm(v)... ... 33.28 Wm^-2
350ppm(v)... ... 34.23 Wm^-2
400ppm(v)... ... 34.85 Wm^-2
450ppm(v)... ... 35.48 Wm^-2
500ppm(v)... ... 36.11 Wm^-2
550ppm(v)... ... 36.74 Wm^-2
Yet another aspect of Ingrahammark7's failure is to only think in terms of the radiation that starts its upward travel at the surface and ends its travel at the top of the atmosphere, in one single passage.
In reality, IR radiation emitted at the surface will undergo several absorption/re-emission cycles, and increasing CO2 will shorten the distance for each cycle - which means more cycles. Each re-emission also sends some energy back down (well, half), which further reduces the efficiency. Even if one sees very little difference at the end (direct IR transmission to space, after surface emission), there is a lot fo difference in the middle. And given that the entire atmospheric profile plays a role, along with other energy transfers such as convection, what happens in the middle is important.
As Phillippe points out, Ingrahammark7's comments are yet another case of reinventing the flat tire. I pointed out the problems of this particular flat tire in comment #529. In that comment, I provided the followiing diagram showing the intermediate effects on IR transmission of decreased atmospheric transparency.
Even though both transmission coefficients result it essentially nothing making it through 200 layers, the differences in the first 100 are obvious.
There's that "obvious" word, yet again...
The explanatory quote in the fallacy statement is itself fallacious: "It's like putting insulation in your attic. They give a recommended amount and after that you can stack the insulation up to the roof and it's going to have no impact." False. The recommended amount of roof insulation is a minimum or supposedly economically optimal amount, not a maximum. The more insulation you add, the less heat can flow through it: infinitely thick insulation transmits infinitesimal heat. To be sure, adding thicker insulation becomes less effective because there's less heat already stopped by prior insulation and therefore unavailable to escape. Thus if the first 10 cm of insulation (for illustration) halves your heat loss, then adding a second 10 cm of identical insulation will save half of the remaining half, raising your total saving to three-fourths, and so on. But the belief that the second 10 cm has no effect is pure physics illiteracy, casting further doubt on the [fallacious] CO2 saturation claim.
Interestingly, there's a second layer of fallacy here, which every standard engineering textbook I've seen commits. Even if attic-insulation standards were economically optimal when conventionally calculated—comparing their cost with the present value of the heating energy saved over the years—that calculation is actually misframed if your aim is to optimize the house as a system rather than the insulation as a component. My house, at 2200m elevation near Aspen CO where it used to dip as low as –44˚C, used roughly triple the normally "optimal" amount of insulation (plus airtightness, ventilation heat recovery, and "superwindows" insulating like 16–22 sheets of glass and facing mostly south)...in all, enough to eliminate the heating system. This cut construction cost more than enough to pay for the efficiency gains that eliminated the heating system, so our construction cost went down while we saved ~99% of space-heating energy. That's the start of a long and interesting story about integrative design, introduced in a half-hour talk at https://energy.stanford.edu/events/special-energy-seminar-amory-lovins-holmes-hummel or a foundational peer-reviewed paper at https://doi.org/10.1088/1748-9326/aad965. Integrative design can make the energy efficiency resource severalfold bigger, yet cheaper—an important climate solution. More in "Recalibrating Climate Prospects" at https://doi.org/10.1088/1748-9326/ab55ab.
Amory @611 : Yes, fair enough for conventional house insulation.
But Marc Morano [a paid propagandist] is giving a completely misleading analogy regarding the so-called GreenHouse Effect. The stacking of housing insulation sheets is vastly different from the GreenHouse Effect mechanism of gasses & lapse rate in the atmosphere. The fault lies in Marc Morano . . . and his "analogy" is not really worth pursuing.
Eclectic @612,
The analogy addressed by the OP is faulty but the criticism of it @611 is also faulty.
If you add insulation to your roof, the diagram below shows it will not alter 74% of the heat loss, so doubling roof insulation thickness would reduce total heat loss by about an eighth. The doubling of CO2 'thickness' would add about +3ºC to a +33ºC GH-effect, so reducing total heat loss by roughly an eleventh, a not-disimilar proportion.
Having significantly decreased my home heating costs by adding insulation to basement walls, I can attest to the verity of MA Rodger's diagram in comment #613. Yes, the roof area is usually the first place to add insulation in a poorly-insulated house, but walls are also important.
My house was constructed in 2004, when local building codes only required R-12 for the top four feet of basement walls. And that top four feet was usually only covered by crappy "insulation in a bag" with no other wall treatement. Pathetic insulation performace.
Current building codes have improved so that new construction requires R-20 for the entire basement wall. My renovations met the R-20 requirement and virtually eliminated air leakage. Our fuel costs dropped by about 15%. (Main and second-floor walls were already R-20.)
Oh, and note my comment #601, where I point out the error in comparing adding insualtion to a house (kept at constant temperature, reduces required heat input) with the earth-atmosphere system (constant heat input, adding insualtion raises temperature).
The devil is in the details.
As a theoretical physicist I have learnt to be very carefull with my words and to closely exam the available data. Using the link I found here
(http://climatemodels.uchicago.edu/modtran/) I understand that:
Is the CO2 saturated? No it is not.
Is it in a condition similar to saturation? Yes it is. The reason is that with 1ppm of CO2 there is an upward IR flux of 325.304 W/m^2.
With 280ppm of CO2 there is an upward IR flux of 300.215 W/m^2 (lost 25 W/m^2)
With 2*280 =560 ppm of CO2 there is an upward IR flux of 296.918 W/m^2 (lost 3.7 W/m^2)
With 4*280 =1120 ppm of CO2 there is an upward IR flux of 293.559 W/m^2 (lost 3.36 W/m^2)
With 8*280 =2240 ppm of CO2 there is an upward IR flux of 290.042 W/m^2 (lost 3.5 W/m^2).
In order to have an upward IR flux of 275 W/m^2, i.e. to have a decrease similar to the one from 1ppm-280 ppm (we should reach a concentration of 25000 ppm). This means that we are near the plateau of the curve which means we are in a condition similar to saturation (because I am not convinced that a real saturation exists).
Hari-Seldon:
Welcome to Skeptical Science. I suggest that it is better to try to phrase your comments as questions when you are asserting something that is different from accepted science.
At the surface of the Earth the greenhouse effect is in what you would describe as near saturation. That doesn't matter. The key point is that at the average escape altitude for IR radiatiom, at approximately 10,000 meters, the concentration of CO2 is about 1/3 the concentration at sea level due to lower atmospheric pressure. In addition, since it is so cold at the escape altitude, there is little water vapor present so CO2 is the ultimate control of most of the radiation escaping. I think your calculations are in error because you used the incorrect concentration of CO2.
Increasing the concentration of CO2 increases the escape altitude. The lapse rate of the troposphere is about 6K/km. If the escape altitude increases 100 meters than the temperature at the surface increases 0.6K. Positive feedbacks cause the amount of heating from CO2 to approximately triple.
Keep in mind that the greenhouse effect increases the temperature of the Earth's surface about 33K. Adding 10% to the existing greenhouse effect would increase temperature over 3K, a disastrous amount. Try calculating how much of an increase in CO2 would result in a 100 meter increase in the escape altitude for a more accurate estimate of the change required.
You are trying to do a difficult calculation without understanding the basics of the atmosphere. I recommend reading a lot more background information before you assert you are correct. It is generally accepted that doubling CO2 concentration results in approximately a 3K increase in surface temperature. About 1K is from the CO2 increase. The response to increased concentration is logarithmic.
Hari-Seldon @616,
(I assume you have adopted the name of the character Hari Sheldon from Asimov's Foundation trilogy but claim nothing of his prescience.)
Picking up on michael sweet @617 description of the mechanism of CO2 forcing and its logarithmic nature....
Chicago University's MODTRAN which you employ is a very useful on-line resource. But I don't think it is correct to suggest that CO2 levels are "in a condition similar to saturation" because the forcing is logarithmic.
You show the climate forcing incrementing due to 2x/4x/8x the pre-industrial CO2 280ppm level as being (& I correct your arithmetic) +3.30, +3.36 & +3.52Wm^-2. A further increase to 16x to 4,480ppm again yields an additional +3.74Wm^-2 with 32x incrementing +4.11Wm^-2 & 64X incrementing +4.68Wm^-2.
And a halving of the pre-industrial level to 140ppm from 280ppm yields -3.36Wm^-2. And this 'halving' sequence can be contimued down to roughly that 1ppm you mention, halvings running down from 140ppm -3.42, -3.52, -3.48, -3.45, -3.14, -2.51, -1.88Wm^-2. And these halvings from 280ppm down to 1.094ppm total to -24.8Wm^-2.
While I am not sure how well MODTRAN works at CO2 levels well beyond today's atmospheric levels (I assume the well-established 3.7Wm^-2 value does not appear in the doubling 280ppm-560ppm as the model is set for the clear-sky tropics), it is plain that CO2 creates a reasonably constant climate forcing for each doubling from roughly 20ppm up to 2000ppm. This logarithmic relationship is well-known. Al levels of CO2 above 800ppm, Zhong & Haig (2013) found the forcing from these higher CO2 levels begin to exceed the logarithmic relationship due to significant additional radiative effects appearing at 10μm which provide extra forcing as the 15μm effects diminish.
So the relationship is stronger than logarithmic and thus describing such a relationship as "in a condition similar to saturation" is neither applicable nor (given the dismissive connotations of calling it 'saturated') helpful.
Ma Rodger.
I read Asimovs story in 1977 , when I was 13 years old. It is my favorite, so yes the name comes fron Trantor.
We have to be self-consistent with what we claim. In this article the authors support the idea that the CO2 effect in atmospheric radiance comes form the increasing of the width of the spectral lines. This program shows that effect, and that effect shows a logarithmic behaviour which is leading to a decrease of the slope of the increase anount of the energy confined in the atmosphere.
If someone uses another argument then we will discuss the effect of that argument, but when we speak of the width of the lines this is the result. And if we have to convince someone we have to be selg-consistent and not to change our story.
Michael Sweet You are wrong. I do not support something that is different from accepted science. On the contrary I am speaking of the accepted science. Earth is warming because it radiates less energy than it receives. Simple fact. So looking at tha spectrum (black-body or bettter gray-body) of the outward radiation will gives as the amount of energy earth radiates. I am not interested on the mechanisms that energy uses to reach the upper atmosphere. I know that almost vacuum surrounds earth so I know that the only energy leaving earth is EM radiation (and gravitational radiation but this is negligible). Thus there is one argument concerning the increase of the widths of the absorption lines more that the Doppler and Heisenbergs uncertainty effects. This program shows exactly how this effect (increase of the width) works. Simpe as that.
And some simple facts from elementary quantum mechanics.
Fact No 1. In the graphs that MODTRAN (http://climatemodels.uchicago.edu/modtran/) presents the area under the intensity curve with the horizontal axis is the trasmitted power per m^2.
Fact No 2. This area is FINITE (for a CO2 concentraion of 280 ppm is around 300 W/m^2)
Fact No 3. The valley we see near 15 μm is due to the CO2. The area of this valley is the power/m^2 that CO2 absorbs. For a concentration of 280 ppm is around 30 W/m^2.
Fact No 4. Increasing the CO2 concentration the area of the valley increases due to the increase of the width of the spectral line.
Fact No 5. Due to the fact that the total area is finite the area of the valley can not increase linearly with the CO2 concentration. If a linear behaviour existed a concentration of 2800 ppm should absorb all the existing energy. Thus there should be a "saturation" mechanism. This is the logarithmic relation that this results show.
Fact No 6. Even at very large concentrations of CO2 such as that in Venusian atmosphere the area of the valley is less than one third of the total.
Fact No 7. If there is a regime where the area of the valley increases linearly with CO2 concentration, this regime would be very limited. After that a stronger "saturation" mechanism should appear.
Thus the program of MODTRAN has the essential physics correct. Maybe it is not accurate enouth and there is some error in some concentrations. But overall the behaviour that this program present is correct. And its results are solid (maybe not for all concentrations but for most and maybe with an error of 10-15%).
I think MARodger answers your misunderstandings better than I do so I will leave it to his comments. It seems to me that his post at 618 answers your question and shows that CO2 is not saturated. It appears that you do not have a calculation error, it is an error of interpretation of the resulting data.
Speaking of saturation and "error of interpretation of the resulting data" :-
Coolmaster, you may be the very person I could ask for an interpretation of the recent paper by Wijngaarden & Happer (2020).
I confess to being very nearly a physics naif (and a naif who habitually thinks in terms of two-and-a-half significant figures as afforded by my trusty slide-rule). So, in reading the WH2020 paper, I skipped through the numerous formulae, and sought the Take Home message. ~Which, verbiage aside, seemed to be minimally different from the mainstream climate science on GHG "saturation".
Yes, assorted "AGW-deniers" immediately seized upon the WH2020 paper as a conclusive debunking of a half-century of climate physics & observations. But there are always fringe-dwellers who seize upon anything within a million miles of the idea that no AGW is occurring (or alternatively ~ that the AGW will doom the world irreversibly by the year 2030).
Coolmaster, I will be grateful for your opinion, if you have time to look at the WH2020 paper. ( I do realize that both van Wijngaarden and Happer are afflicted by severe emotional/political bias producing major motivated reasoning problems in their climate assessments ~ but all that aside, is there something of useful scientific value in their paper? )
Hari-Seldon, I would very much like you to give your opinion on the WH2020 paper, as well. Likewise I appeal to all others expert enough in these matters.
Michael sweet. Quantum statistical physics apologizes to you for their misunderstadings. On the other hand I think that this whole page is not worth of my time. The reason is that there is a post titled: "How could global warming accelerate if CO2 is logarithmic."(https://skepticalscience.com/why-global-warming-can-accelerate.html)
Thus in one post my reasoning is valid in another is misunderstandings ... This is crap.
Eclectic: This paper calculates the forcing due to the different green-house gases. The authors find a "logarithmic forcing" for CO2 concentration. Their value for the forcing is only 3.0 W/m^2 (where MODTRAN finds 3.7). Their words are "Note from Table 2 that doubling or halving the column density of CO2 changes the
forcing F by almost the same amount, either at the tropopause or at the mesopause. " (page 18 at https://arxiv.org/pdf/2006.03098.pdf). They also say that "In addition to line intensities, three of the calculations used a
continuum CO2 opacity, and all five used a continuum H2O opacity. The physical origin
of these continua is unclear. They are added to make the calculations agree better with
observations [10, 13]. " This means that they do not understand why they have to use that model. However they also say "The mesopause spectral intensities,
calculated with only HITRAN lines and with no continuum contributions, are in excellent
agreement with satellite measurements over the Sahara Desert, the Mediterranean Sea and
Antarctica, as discussed in Section 8". This means that they are confident for their mesopause calculations. In the conclusions they say that "Fig. 9 as well as Tables 2 and 4 show that at current concentrations, the forcings from all
greenhouse gases are saturated. The saturations of the abundant greenhouse gases H2O and
CO2 are so extreme that the per-molecule forcing is attenuated by four orders of magnitude
with respect to the optically thin values. " When the authors say that the concentrations are in the saturation regime it means that they have passed the area of a large slope and they are in an area with small slope (no constant forcing). An important result is that: "The calculated flux increment
from simultaneously doubling CO2, N2O and CH4 is the slightly smaller value, ∆F = 4.7 W/m^2". This is important because we have to examine closely how an increased CO2 concentration affects the concentrations of the other gases.
I am not confident enough about the earth temperature part because there are too many parameters and I am not an expert on that.
Hari-Seldon @624 : Thank you for that. Me and my slide-rule were vaguely following the Wijngaarden & Happer (2020) paper, but, allowing for possible bias on my own part, it seemed I might well be missing some vital point.
The paper was discussed rather briefly on this thread, about a year ago. I gather the paper had been rejected by several journals initially. Yet, despite the bizarre political statements that continually come from both W. and H., their scientific contributions should be worthy of respectful attention, at the outset anyway.
The (non-expert) impression I felt while reading this paper, was that W. and H. were trying to carefully examine one tree ~ while studiously ignoring the forest. The clear-sky & constant humidity focus, the downplaying of Top-Of-Atmosphere aspects . . . and the later verbal diminution of the ECS figure (by van Wijngaarden) ~ were all part of an overall impression that W. and H. were in the business of obfuscating their own findings (in their own minds as well as in the minds of their acolytes).
Disappointing, in two scientists with good track records in non-climate areas. But our subconscious minds have the power to make fools of us all, when we permit such.