


 Arguments


Is the CO2 effect saturated?
What the science says...
| Select a level... |
 Basic
Basic
|
 Intermediate
|
 Advanced
| ||||
|
The notion that the CO2 effect is 'saturated' is based on a misunderstanding of how the greenhouse effect works. |
|||||||
Climate Myth...
CO2 effect is saturated
"Each unit of CO2 you put into the atmosphere has less and less of a warming impact. Once the atmosphere reaches a saturation point, additional input of CO2 will not really have any major impact. It's like putting insulation in your attic. They give a recommended amount and after that you can stack the insulation up to the roof and it's going to have no impact." (Marc Morano, as quoted by Steve Eliot)
At-a-Glance
This myth relies on the use (or in fact misuse) of a particular word – 'saturated'. When someone comes in from a prolonged downpour, they may well exclaim that they are saturated. They cannot imagine being any wetter. That's casual usage, though.
In science, 'saturated' is a strictly-defined term. For example, in a saturated salt solution, no more salt will dissolve, period. But what's that got to do with heat transfer in Earth's atmosphere? Let's take a look.
Heat-trapping by CO2 in the atmosphere happens because it has the ability to absorb and pass on infra-red radiation – it is a 'greenhouse gas'. Infra-red is just one part of the electromagnetic spectrum, divided by physicists into a series of bands. From the low-frequency end of the spectrum upwards, the bands are as follows: radio waves, microwaves, infrared, visible light, ultraviolet, X-rays, and gamma rays. Gamma rays thus have a very high-frequency. They are the highest-energy form of radiation.
As our understanding of the electromagnetic spectrum developed, it was realised that the radiation consists of particles called 'photons', travelling in waves. The term was coined in 1926 by the celebrated physicist Gilbert Lewis (1875-1946). A photon's energy is related to its wavelength. The shorter the wavelength, the higher the energy, so that the very high-energy gamma-rays have the shortest wavelength of the lot.
Sunshine consists mostly of ultraviolet, visible light and infra-red photons. Objects warmed by the sun then re-emit energy photons at infra-red wavelengths. Like other greenhouse gases, CO2 has the ability to absorb infra-red photons. But CO2 is unlike a mop, which has to be wrung out regularly in order for it to continue working. CO2 molecules do not get filled up with infra-red photons. Not only do they emit their own infra-red photons, but also they are constantly colliding with neighbouring molecules in the air. The constant collisions are important. Every time they happen, energy is shared out between the colliding molecules.
Through those emissions and collisions, CO2 molecules constantly warm their surroundings. This goes on all the time and at all levels in the atmosphere. You cannot say, “CO2 is saturated because the surface-emitted IR is rapidly absorbed”, because you need to take into account the whole atmosphere and its constant, ongoing energy-exchange processes. That means taking into account all absorption, all re-emission, all collisions, all heating and cooling and all eventual loss to space, at all levels.
If the amount of radiation lost to space is equal to the amount coming in from the Sun, Earth is said to be in energy balance. But if the strength of the greenhouse effect is increased, the amount of energy escaping falls behind the amount that is incoming. Earth is then said to be in an energy imbalance and the climate heats up. Double the CO2 concentration and you get a few degrees of warming: double it again and you get a few more and on and on it goes. There is no room for complacency here. By the time just one doubling has occurred, the planet would already be unrecognisable. The insulation analogy in the myth is misleading because it over-simplifies what happens in the atmosphere.
Please use this form to provide feedback about this new "At a glance" section. Read a more technical version below or dig deeper via the tabs above!
Further details
This myth relies on the use of a word – saturated. When we think of saturated in everyday use, the term 'soggy' comes to mind. This is a good example of a word that has one meaning in common parlance but another very specific one when thinking about atmospheric physics. Other such words come to mind too. Absorb and emit are two good examples relevant to this topic and we’ll discuss how they relate to atmospheric processes below.
First things first. The effect of CO2 in the atmosphere is due to its influence on the transport of 'electromagnetic radiation' (EMR). EMR is energy that is moving as x-rays, ultraviolet (UV) light, visible light, infrared (IR) radiation and so on (fig. 1). Radiation is unusual in the sense that it contains energy but it is also always moving, at the speed of light, so it is also a form of transport. Radiation is also unusual in that it has properties of particles but also travels with the properties of waves, so we talk about its wavelength.
The particles making up radiation are known as photons. Each photon contains a specific amount of energy, and that is related to its wavelength. High energy photons have short wavelengths, and low energy photons have longer wavelengths. In climate, we are interested in two main radiation categories - firstly the visible light plus UV and minor IR that together make up sunshine, and secondly the IR from the earth-atmosphere system.
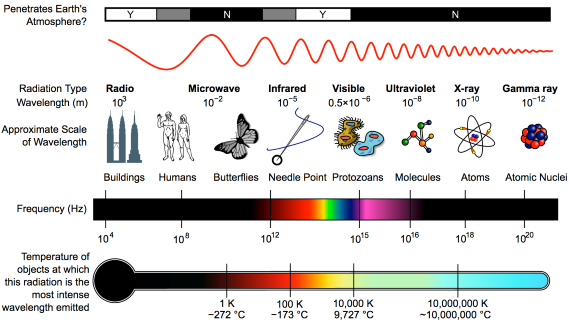
Fig. 1: diagram showing the full electromagnetic spectrum and its properties of the different bands. Image: CC BY-SA 3.0 from Wikimedia.
CO2 has the ability to absorb IR photons – it is a 'greenhouse gas'.So what does “absorb” mean, when talking about radiation? We are all familiar with using a sponge to mop up a water spill. The sponge will only absorb so much and will not absorb any more unless it's wrung out. In everyday language it may be described, without measurements, as 'saturated'. In this household example, 'absorb' basically means 'soak up' and 'saturated' simply means 'full to capacity'. Scientific terms are, in contrast, strictly defined.
Now let's look at the atmosphere. The greenhouse effect works like this: energy arrives from the sun in the form of visible light and ultraviolet radiation. A proportion reaches and warms Earth's surface. Earth then emits the energy in the form of photons of IR radiation.
Greenhouse gases in the atmosphere, such as CO2 molecules, absorb some of this IR radiation, then re-emit it in all directions - including back to Earth's surface. The CO2 molecule does not fill up with IR photons, running out of space for any more. Instead, the CO2 molecule absorbs the energy from the IR photon and the photon ceases to be. The CO2 molecule now contains more energy, but that is transient since the molecule emits its own IR photons. Not only that: it's constantly colliding with other molecules such as N2 and O2 in the surrounding air. In those collisions, that excess energy is shared with them. This energy-sharing causes the nearby air to heat up (fig. 2).
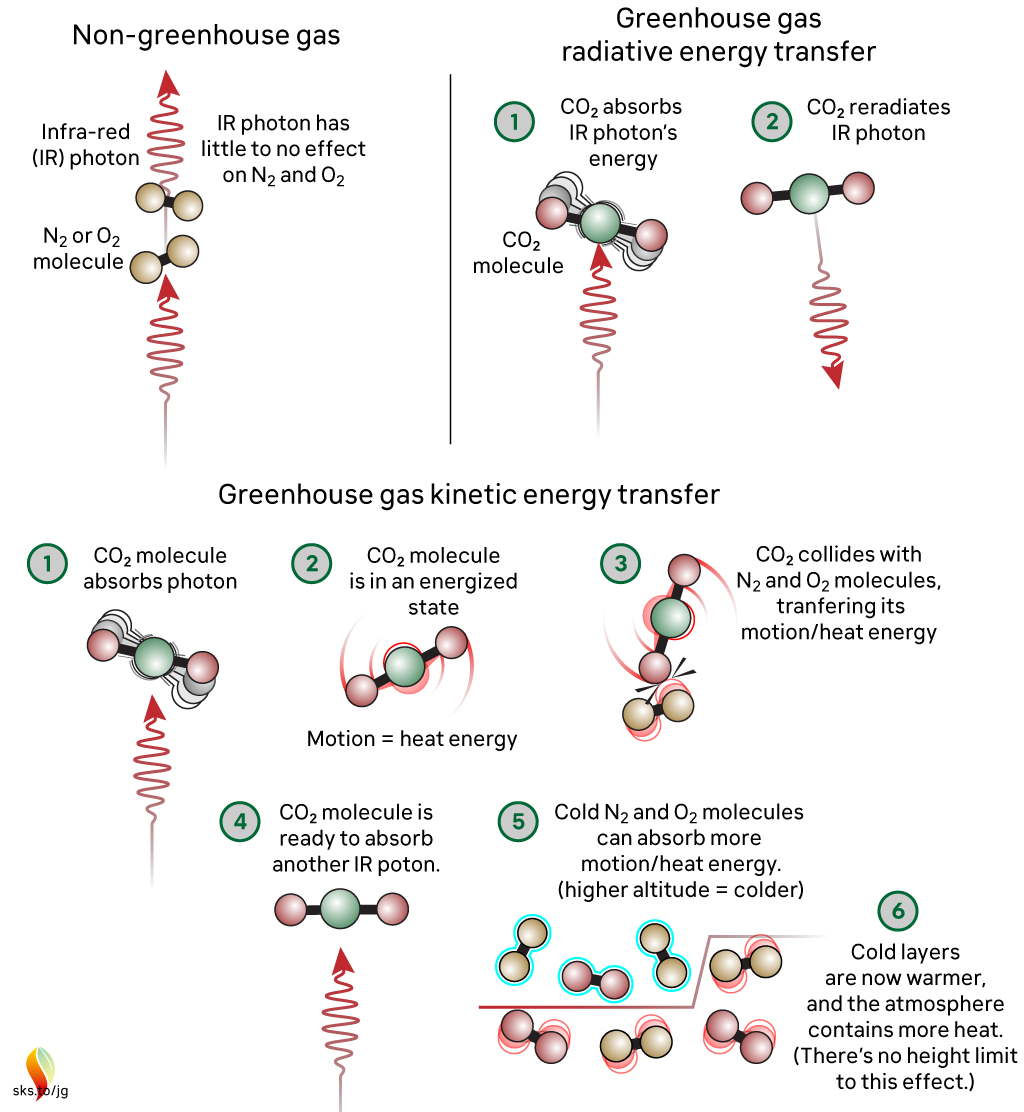
Fig. 2: The greenhouse effect in action, showing the interactions between molecules. The interactions happen at all levels of the atmosphere and are constantly ongoing. Graphic: jg.
The capacity for CO2 to absorb photons is almost limitless. The CO2 molecule can also receive energy from collisions with other molecules, and it can lose energy by emitting IR radiation. When a photon is emitted, we’re not bringing a photon out of storage - we are bringing energy out of storage and turning it into a photon, travelling away at the speed of light. So CO2 is constantly absorbing IR radiation, constantly emitting IR radiation and constantly sharing energy with the surrounding air molecules. To understand the role of CO2, we need to consider all these forms of energy storage and transport.
So, where does 'saturation' get used in climate change contrarianism? The most common way they try to frame things is to claim that IR emitted from the surface, in the wavelengths where CO2 absorbs, is all absorbed fairly close to the surface. Therefore, the story continues, adding more CO2 can’t make any more difference. This is inaccurate through omission, because either innocently or deliberately, it ignores the rest of the picture, where energy is constantly being exchanged with other molecules by collisions and CO2 is constantly emitting IR radiation. This means that there is always IR radiation being emitted upwards by CO2 at all levels in the atmosphere. It might not have originated from the surface, but IR radiation is still present in the wavelengths that CO2 absorbs and emits. When emitted in the upper atmosphere, it can and will be lost to space.
When you include all the energy transfers related to the CO2 absorption of IR radiation – the transfer to other molecules, the emission, and both the upward and downward energy fluxes at all altitudes - then we find that adding CO2 to our current atmosphere acts to inhibit the transfer of radiative energy throughout that atmosphere and, ultimately, into space. This will lead to additional warming until the amount of energy being lost to space matches what is being received. This is precisely what is happening.
The myth reproduced at the top – incorrectly stating an analogy with roof insulation in that each unit has less of an effect - is misleading. Doubling CO2 from 280 ppm to 560 ppm will cause a few degrees of warming. Doubling again (560 to 1130 ppm) will cause a similar amount of additional warming, and so on. Many doublings later there may be a point where adding more CO2 has little effect, but recent work has cast serious doubt on that (He et al. 2023). But we are a long, long way from reaching that point and in any case we do not want to go anywhere near it! One doubling will be serious enough.
Finally, directly observing the specific, global radiative forcing caused by well-mixed greenhouse gases has - to date - proven elusive. This is because of irregular, uncalibrated or limited areal measurements. But very recently, results have been published regarding the deep reinterrogation of years of data (2003-2021) from the Atmospheric Infrared Sounder (AIRS) instrument on NASA's Aqua Satellite (Raghuraman et al. 2023). The work may well have finally cracked the long-standing issue of how to make finely detailed, consistent wavelength-specific measurements of outgoing long-wave radiation from Earth into space. As such, it has opened the way to direct monitoring of the radiative impact (i.e. forcing + feedback) of greenhouse gas concentration changes, thereby complimenting the Keeling Curve - the longstanding dataset of measured CO2 concentrations, down at the planet's surface.
Note: Several people in addition to John Mason were involved with updating this basic level rebuttal, namely Bob Loblaw, Ken Rice and John Garrett (jg).
Last updated on 31 December 2023 by John Mason. View Archives


GwsB "the wings have little effect"
That is false.
The links at the bottom of this page to RC's saturated gassy arguments threads explains it, as well as other sources.
GwsB @525,
You ask if that Wiki graph you show @525 is misleading. It certainly is!!
That Wiki graph simply shows the chance of a photon travelling vertically through today's atmosphere without a particular species of GHG absorbing it en route. It shows nothing of how many such photons would be travelling at each wavelength or even in what direction. The CO2 absorption band at 2.7μm is stopping solar radiation coming in from the sun not IR going out. The CO2 absorption band at 4.3μm sits in the gap between incoming solar radiation and outgoing IR - there are effectively no photons to be absorbed so it has no relevance to climate. And the inability of a photon to travel un-absorbed by GHGs out through the atmosphere does not prevent the mechanisms of the greenhouse effect from gaining strength through additonal levels of GHG. And I should add that the Wiki page you took the graph from provides a woeful attempt to describe the mechanisms of the GH effect.
You say "The basic physics is simple: A photon of light at a wavelength of 14 μm [15μm] is passed from one CO2 molecule to the next performing a kind of random walk until it exits the atmosphere. There are two exits, outer space and the earth. Saturation means that a photon starting from the earth has very little chance of exiting to outer space." The effect of this 'saturation' is solely that there will be a random walk as all photons will be absopbed. This does not of itself make the chances of IR resulting from that absorption exiting into space small.
Interestingly, you cite Zhong & Haig (2013) 'The greenhouse effect and carbon dioxide' yet you fail to acknowledge the finding of that paper which is "We conclude that as the concentration of CO2 in the Earth’s atmosphere continues to rise there will be no saturation in its absorption of radiation and thus there can be no complacency with regards to its potential to further warm the climate."
Instead you set out contradictory conclusions of your own - "The total negative impact is almost cancelled by the positive impact around 15 μm."
The GH-effect works because the emission & re-emission of IR from the atmosphere containing GHGs will only occur at those same wavebands which subject to are absorption. But the rate of re-emission is set by air temperature. As the temperature drops through the troposphere, the point where emissions will get out into space through the thinner upper atmosphere; that point in the troposphere will be colder. Thus the GHG at that higher altitude will re-emit less IR because it is colder. The more the GHG in the atmosphere, the higher the altitude and the bit of troposphere which emits into space and thus the less IR is emited.
Of course, as the graphics in Zhong & Haig show, that mechanism will go into reverse as the altitude becomes high enough to reach the stratosphere. In the stratosphere, temperature rises with altitude and so the more GHG the greater the IR emissions into space. This is the mechanism which you mention being apparent in their Fig5b which you say results in the increasing GH-effect being "almost cancelled." However, the extra GHG effect of CO2, although reduced with increasing CO2 concentrations in the well-konwn logathithmic relationship, does not peak even if the 15μm band is taken in isolation. It keeps on increasing. And at CO2 levels above 2500ppm(v), the 15μm band is boosted by a compound absorption band at 10μm.
The climate forcing of CO2 does not hit an upper limit. In the words of Zong & Haig (2013), "as the concentration of CO2 in the Earth’s atmosphere continues to rise, there will be no saturation in its absorption of radiation."
GwsB @525 ,
you have completely failed to understand the CO2 (and H2O) mechanism of "greenhouse".
Before you embarrass yourself by making further comments about CO2 saturation, please read & think about Dana's OP, and check out RealClimate & other information above.
[PS] Please watch tone.
GwsB:
You have received a rather negative reaction, because you have made some pretty strong claims based on some faulty reasoning. Regulars here can be pretty impatient with such proclamations from newcomers.
Let me try to explain where your error lies. To begin, thanks for making it clear just what you think "CO2 effect is saturated" means - often people that make that argument are less than clear. You have based your argument on the (correct) observation that very little IR radiation can travel directly from the surface to space.
The part where your argument breaks down is actually hinted at in your post. You state that IR radiation absorbed in the atmosphere can be re-radiated - sometimes up, sometimes down. Eventually, that energy will be emitted to space, but it is delayed. Let us look at the implications of that.
Radiation absorption is a logarithmic function, expressed by Beer's Law. If a certain thickness of the atmosphere can absorb 10% of the IR radiation,and transmit 90%, then the amount passing directly through is 0.9 of the original value. The next layer (same properties) then transmits 90% of 90%, or 09.*0.9=0.81. The third layer will allow 0.93 = 0.729, and so on.
The figure below shows that decline. It also shows the same result for a case where each layer transmits 95%, instead of 90%. The layer-by-layer sequence for 0.95 is 0.95, 0.952, 0.953 etc. Note the following:
The "saturation" argument fails to include that intermediate difference, and that is where it goes very, very wrong. This difference in how much IR radiation is transmitted how far is essential to understanding the greenhouse effect. Adding CO2 has a neglible effect on how much IR radiation can pass directly from the surface to space in a single step, Adding CO2 does affect how far IR radiation gets in a single step, and this affects how many steps it will take before it can finally reach high enough in the atmosphere to escape to space.
You can see this in the figure I provide, if you read it from right to left - i.e., think of the right as the surface, and the left as space. IR radiation emitted upward (to the left) at layer 10 has a 39% chance of escaping to space for a coefficient of 0.9, but a 63% chance for a coefficient of 0.95.
(Note: the values and layers in the diagram are purely illustrative. Radiation transfer in the atmosphere needs to be calculated at many different wavelengths, not a single number as shown above. The general principle is correct, though.)
As CO2 or other greenhouse gases increase, the IR lost to space originates at a higher altitude, where the atmosphere is colder. This means less IR lost to space, until the atmosphere can warm to compensate.
An analogy for your "saturation" argument would be a foggy night, where you can't see the building two blocks away, but you can see a building one block away. From the perspective of the distant building, visibility is "saturated" - no light from the distant building is reaching your eye. Does this mean that adding more fog has no effect? No, because additional fog will eventually make it impossible to see the building that is only one block away.
Proper examiniation of the effects of adding CO2 to the atmosphere requires that the effects throughout the atmosphere be included, not just the direct transmission from the surface to space in a single step. And the calculation that include all those effects show clearly that adding CO2 leads to surface and tropospheric warming.
I am sorry for perhaps making a basic question (my first post). But in that last submitted graph the first layer is numbered to the left where most of the effect is happening. So shouldnt that left side be seen as the surface of the earth? And the right side be seen as space?
OK, i see what you mean after i reread your post. But the graph description also says Beers Law decay. Is that curve really applicable for energy transmitted into space for each layers?
If yes, what coeffecient is 400 ppm corresponding to, compared to 800ppm?
PringlesX:
Let me try to explain from a slightly different approach. First, keep track of the point that a coefficient of 0.95 means IR radiation is more easily transmitted through a single layer that when the coefficient is 0.9. So the 0.9 curve is the one with higher absorbing gases.
In the graph I posted in comment 529, moving from left to right tells you the probability of a photon being transmitted through to layer #x. After 20 layers:
Another way of thinking about it is the absorption. By layer 20:
Now, iet's think about what happens to a photon that is emitted upwards from high in the atmosphere, 20 layers from space. What are its chances of either being absorbed in those 20 layers, versus its chances of being transmitted to space in one step? We can get that from the graph, too, because the graph gives us both the probability of absorption and the probability of transmission:
Getting back the the "saturation" argument, we can see that decreasing the transmission coefficient from 0.95 to 0.9 (increasing absorption, due to increasing greenhouse gas concentrations) reduces the chance that IR radiation from a height 20 layers from space will be lost directly to space. So, the IR radiation that does reach space is more likely to be emitted at a higher altitude (close to space).
The "fact" that the whole atmosphere (200 layers) is "saturated" (no direct transmission) misses this important feature.
Does that help?
Thanks for your answer.
As i see it, this graph depicts how diffused this transmission border is. And its already thin and very high up in the athmosphere compared to the number of layers the photons have to process.
Isnt safe to say that the areas ABOVE the lines, are the real difference between the CO2 levels from a photon perspective? If that is so, then it can be argued that the scenario is more or less saturated?
PringlesX:
Please note that the graph I have provided is not an accurate cacluation of IR transmisison in the atmosphere - it is a very crude example of how IR radiation would be transfered in an idealized "200 layer" situation. For real atmospheric transmission, the same Beer's Law applies, but you need to also consider:
So the figure above is a very simplistic version of total IR radiation transfer.
Climatologists have "done the math" on this. (Well, a lot of the radiation theory was extensively developed by the military in the 1960s so their heat-seeking missles could use IR radiation to detect hot items they wanted to blow up.) The math says that adding CO2 will have a significant effect on radiation transfer in the atmosphere.
The math says "the atmosphere is not saturated for IR radiation transfer, for any useful or accurate concept of "saturation". The only "saturation" that occurs is for useless and innacurate descriptions of the process.
The area under or over the curves in my graph simply demonstrates that for two reasonable absorption coefficients, where the start and end points are the same (1 @ layer 0, and 0 @ layer 200, so "saturated" by one definition), you get very different results in the middle. When you see someone arguing that "the CO2 effect is saturated", there are two possibilities:
My guess is that most people fall under category 1. If they are relying on a source for their information (rather than calculating it themselves), then most of the time they are relying on a source that can probably be connected eventually to someone that falls in category 2.
Yes, it has an effect on how broad/diffuse the radiation border is. But still, sorry, i cant see the big difference in insulation effect with the information you are providing.
Also on top of that, CO2 frequency bands not covered by Water vapour is only responsible for about 7% of the energy (?). Decreasing that already very thin transmission border even thinner doesnt seem to be able to do any catastrophic changes in insulation effect by itself.
Unless we could find better curves or explanation. Do you have some good sources that made you convinced about the large effect?
PringlesX , it might be worthwhile taking a step back, to look at the bigger context.
The planetary energy balance is determined by fluxes at the Top Of Atmosphere. But the TOA is a band of altitudes, depending on different radiatively-active molecules. The H2O effect is large — but occurs at lower altitude, because cold-temperature precipitation means that H2O molecules are scanty at the high altitudes (where CO2 is still "going strong").
So despite the IR radiation overlap between CO2 and H2O, the end result is that the CO2's greenhouse effect is disproportionately large for its small presence.
( I'm quite uncertain about the correctness of the 7% figure you mentioned ~ but there are knowledgeable posters here who might be prepared to discuss that particular point. But whether 7% or 17% etcetera, it is the end result of energy balance which matters.)
The other point is that you must consider the lapse rate , in looking at the mechanism of "greenhouse". Very important.
Might also be worth pointing out that Bob's diagrams are worth studying for understanding what is going on, but for real applications (whether GPS, heat-seeking missiles or climate models), you need to do full integration of the radiative transfer equations which funnily enough back the consensus science. Observations of change in radiation as CO2 increases from both earth looking up and satellite looking down match the solutions from the RTE integration with very high precision. See the examples here. My favourite paper working through it all is Ramanathan and Coakley 1978.
I am curious as to where the "7%" came from. This paper which I believe to be the consensus position makes it more like 20%.
Thank you both.
I believe The 7% figure is the Co2-band area minus the H2O overlap.
But yes, regarding the total effect causing increase in temperature there are different complicated models taking feedback effects into account
that talks about much higher percentage effect.
"The planetary energy balance is determined by fluxes at the Top Of Atmosphere. "
Yes, that seems to be the case.
(The last clips in this series (about 40-61) are explaining how the frequency overtones developes with altitude which could be interesting for those readers not familiar with it.)
https://youtu.be/XIBsjBvRTew
The straight radiative balance (ie doubling CO2 gives you an extra 4w/m2 of surface irradation) would only raise temperatures 1.1C. It is the feedbacks that lift this to around 3C, in part from increased water vapour as well as albedo and clouds.
PringlesX:
You ask, "Do you have some good sources that made you convinced about the large effect?"
I am reminded of a time, many years ago when we had some construction workers at a research site I worked at, who were quite intrigued by all the instrumentation and such. One asked "what did you do to get a job like this?" I answered, "I have a PhD in Physical Geography". I think that was more preparation and work than he had hoped for.
[My speciality was Climatology.]
There is no one source that "convinced" me. There is a huge body of science behind our understanding of climate, dating back to the 1800s. If you are curous about the history, I suggest reading "The Discovery of Global Warming".
I first started learning about climate as an undergrad in the 1970s, mostly via textbooks. In the 1980s, as a grad student, I was introduced to much of the primary literature (as it was at the time). As such, much of my understanding comes from the primary literature, not web pages or books. Here at SkS, I have on several occasions referenced the following paper:
The link to the journal is here, and a free copy is also available here. The paper describes a one-dimensional climate model that includes exactly the kind of calculations I have been discussing with you. The fact that this is from 1967 should tell you that people have been working on this for a long time.
Of course, our understanding has improved since then. People often refer to the IPCC reports, which attempt to give a summary of current understanding. For a simpler version, I think the very first report in 1990 is easier to read than the later ones, because it covers the basics to a greater extent.
If you want to focus on IR radiation transfer only, then you can play with a model on-line at this web site. Note that radiation transfer is dependent on things like cloud, temperature, other gases, location, etc., so that web page gives you a lot of options to choose some typical defaults. You can choose an altitude, and direction (up or down). At the very least, playing with that model might help you realize that there is no one single source of information that will convince you (or anyone).
As the discussion continues, be careful with statements like "But still, sorry, i cant see the big difference in insulation effect with the information you are providing." That starts to look like an argument from increduility, which is a pretty weak position.
Scaddenp has already referred to CO2 doubling causing a reduction of 4W/m2 in outgoing IR radiation at the top of the atmosphere. Before you say "gee, that seems small", the climatological question is "what changes have to happen to bring the system back into equilibrium?"That answer was already provided by scaddenp, too: 1.1C temperature rise (global average) without feedbacks, or more like 3C with known feedbacks. You can see some of this in the Manabe and Wetherald paper I reference above. To put it simply, adding 4W/m2 to every part of the surface, for the length of time it takes to readjust, adds up to a lot of energy.
PringlesX @538,
You link to a particular YouTube lecture which is No 19 of a series of 61. We can see a 7% figure for the CO2-contribution to the total GH-effect as being part of the conclusions reached in Lecture 52. It would be incorrect to suggest this 7% figure is the actual value. It is not. In the absence of other GHGs, CO2 would provide 25% of today's GH-effect. With other GHGs, the actual figure is dependent on the proportion of cloud/clear-sky so cannot be precisely calculated but is not far short of 20%.
There are many video lectures in the lecture series you cite, so which rabbit-holes it dives down to reach its eventual conclusions in Video 61 would take a lot of viewing. Suffice to say, I have seen no indication that the lecturer with all his mathmatical confidence properly understands the effect of CO2 on our climate and his insistence that H2O is the stronger GHG is presented without mention of the H2O only being in that atmosphere in significant levels because of the presence of CO2.
I'm not sure of the source of this graphic below (it features deep in a Clive Best comment-thread) but it is quite instructive, as is this video which uses the same W Pacific IR data, The areas where the IR into space is dropped below the surface temerature S-B line show the size of the GH-effect and the contribitions from different gases.
The 61 iLectureOnline lectures yo cite @538 makes much of how much IR makes it unabsorbed from the surface into space. The GH-effect does not work like that, It relies on the temperature of the atmosphere at the altitude from which IR can make it unabsorbed into space.
Add H2O and this will not effect the 15 micron band. The level of CO2 means the altitude with a clear run at space is far above any significant H2O effect. So that important altitude remains defined by CO2.
Add more CO2 and the important altitude rises and, excepting the small central part that is already up in the stratosphere, such a rise in altitude means a lower temperature at the altitude emitting into space. The lower the temperature, to less the emitted radiation (as per the S-B curves) and the resulting need for the planet to warm until inward/outward radiation are again in balance.
Bob Loblaw's curves in 529 exhibit exponential decrease. The decrease actually is a power law, more precisely the fraction exiting at the top is inversely proportional to the length of the column (or the density). If photons only travel upwards there would be exponential decrease. However photons are emitted by the CO2 molecules in all directions.
Here is the argument for (the discrete version of) 20 layers, which I number by 0 ... 19 from bottom to top. Bottom is the surface of the earth, top is outer space. Each layer contains the same amount of CO2. The argument is schematic. At the end of the post I come back to the topic of saturation.
Assume at level k there are 20-k photons for k=0, ..., 19. Half the photons jump downwards (to k-1) half upwards (to k+1). So level k loses all 20-k photons, but receives (21-k)/2 photons from its neighbour below and (19-k)/2 from its neighbour above. Thus it ends up with 20-k photons. This is the steady state. The bottom level, k=0, and the top level, k=19, need special consideration. These two levels form the boundary of the system.
1) At level k=0 half the photons go down into the earth and leave the atmosphere, and half go up to level 1. On the other hand level 0 receives 19/2 photons from level 1. In order to have a steady state we must assume an influx of 21/2 photons from the earth (due to heat radiation of the earth).
2) At level 19 there is one photon. Half this photon goes up into outer space, half down to level 18. Level 19 receives 2/2 photons from level 18 and none from outer space. So it ends up with one photon. Steady state.
The full picture is: At each step there is an influx of 21/2 photons from earth (due to the heat of the earth) to level zero and an outflow of 10=20/2 photons from level zero to the earth and an outflow of 1/2 photon from level 19 to outer space. That results in a steady state.
This description agrees with observations. Doubling the length of the cylinder (or the density of CO2) will reduce the amount of radiation into outer space by 50%.
The actual situation is more complicated. At each level there are millions of photons. Each photon flips a coin to decide whether it takes a step upwards (if the coin shows heads) or a step downwards (if the coin shows tails).
The actual situation is more complicated. The photon will travel a random distance in a random direction (uniformly distributed over the unit sphere) before being absorbed. The distance is in the order of ten meters, the time between being absorbed and re-emitted is of the order of 100 femtoseconds. Since the photon moves at the speed of light the whole random walk from leaving the heat bath of the surface of the earth until returning to the earth or flying off into outer space occurs in a twinkle of the eye. On my imac I can simulate a hundred thousand such random walks in a matter of minutes using a program of twenty lines of code in R.
Actually it might be better to speak of reflection. CO2 reflects some of the photons back to earth and others manage to pass to outer space. We speak of saturation if 99% or more of the photons are reflected back to earth, equivalently if 1% or less of the photons manage to escape to outer space.
The figure below gives a good picture of the effect of an increase of the amount of CO2 for different wave numbers. The proportion which manages to escape depends on the density of CO2 and on the wavelength of the photon. At wavelength 15 μm (650-680 cm-1) there is saturation. In the shoulders we are close to saturation. Doubling the density of CO2 will halve the number of photons which manage to escape. In the far wings the majority of the photons manage to escape and only a small proportion is reflected back to earth. Doubling the intensity will double the number of photons reflected back to earth. This also holds for the 10 μm wavelength (the red curve for wave number 850-1100).
If one makes plots for these different wavelengths with the amount of CO2 on the horizontal axis and the number of photons reflected back to earth on the vertical axis, and if one uses a logarithmic scale on the horizontal axis and a linear scale on the vertical axis, one obtains the plot below:
The curves are exponential curves because of the logarithmic scale on the horizontal axis. The black, sky blue and green curves have the form y=a-exp(-c(x-b)) where $x$ varies from 1 to 6. The constant a, b and c depends on the colour: a=0 (black), a=8.5 (sky blue) and a=9 (green). The red blue and pink curve have the form y=a+exp(c(x-b)). In the plot below the coefficients a, b and c have been chosen so as to get a reasonable fit.
The plot at the top is Figure 6(c) in Zhong & Haigh (2013) "The greenhouse effect and carbon dioxide". The plot at the bottom is a free hand fit by exponential curves. At present the contribution for the six wave number intervals is approximately the same. Saturation holds at the central interval, but not yet at the shoulders. The contribution of the wings will become predominant if the amount of CO2 passes the level 40 000 ppmv, when CO2 makes up more than 4% of the atmosphere. At that moment saturation holds at the shoulders. The instantaneous radiative forcing is approximately 9 for all five curves which adds up to 45 (see Figure 5(b) in Zhong & Haigh) which corresponds to an increase in temperature of 11K. That increase is without feed back effects.
The two figures in post 542 were not copied. They seem to be in the wrong format. I refer the reader to Figure 6(c) in Zhong & Haigh (2013) "The greenhouse effect and carbon dioxide" for the first figure, see https://rmets.onlinelibrary.wiley.com/doi/10.1002/wea.2072
The second figure is less important. It shows an approximation to the first figure in terms of exponential curves. The reader can make these approximations himself if she is interested. I am unfortunately not able to insert the pdf file into this window.
GwsB @543,
Figure 6 from Zhong & Haig (2013) is below with caption added beneath.
Caption (a) Instantaneous Radiative Forcing of CO2 (relative to the present‐day concentration) as a function of volume mixing ratio. The red curve is for the whole infrared region, 0–3000cm−1. The blue curve covers only the spectral region 550–800cm−1 (i.e. the 15μm band). (b) As (a) but extending to higher CO2 mixing ratios and presented against the logarithm of volume mixing ratio. (c) Radiative Forcing against CO2 mixing ratio for the six spectral intervals.
I'm not sure if fig6c is as easy to understand as Fig 5 of that same paper which I paste below, again with caption. (Plus it does provide both wavelength and wavenumber which is helpful, and being less wide, it can be displayed a bit biggerer than Fig6.)
Caption (a) The top of atmosphere infrared spectrum calculated with CO2 mixing ratio (ppmv) of 0 (light blue curve), 1.5ppmv (green), 389ppmv (black), 2 × 389ppmv (purple) and 32 × 389ppmv (red). The vertical dashed lines mark the sub‐intervals discussed in the text: the CO2 15μm band core (650–680cm−1), the band central regions (590–650cm−1 and 680–750cm−1), the band wings (450–590cm−1and 750–850cm−1), and the CO2 10μm bands (850–1100cm−1) which overlap the O3 9.6μm band. (b) The differences between each CO2 spectrum in Figure 5(a) from that with the current CO2 concentration (389ppmv).
GwsB,
In post 542 you describe 20 atmospheric layers. If the atmosphere had 20 layers with the same amount of CO2, they would not all be the same thickness. The top layer would be many times thicker because the atmosphere is thinner higher up. Molarity is much lower higher up. There is much less water because it is very cold. The CO2 path length is many times longer due to the lower CO2 concentration (400 ppm means lower Molarity at lower pressure. You appear to think the same Molarity of water and CO2 exist throughout the atmosphere. Ppm is not concentration, it is a fraction of concentration)
It appears to me that you have not considered the concentration differences at altitude so your model is incorrect. In general it is a waste of time to compare your own model to peer reviewed data.
The key to saturation is the lower CO2 and water concentration at height. Essentially no water exists at the escape altitude. Your model ignores these facts. At the escape altitude there is no saturation and adding more CO2 increases the absorption. That increases the escape altitude and causes surface warming.
GwsB,
It may be the problem with your model is that the number of photons emitted from one layer is not related to the number of photons it receives from other layers. The number of photons emitted is determined solely by the temperature of the layer.
Esentially all of the photonic energy received is immediately turned into heat. Then photons are emitted according to the Boseman relationship (t to the fourth power). Higher layers emit less photons per m2 than lower layers because they are colder. Your model ignores the temperature differences. A single photon does not random walk to outer space. A modeled walk at light speed does not account for the time spent as heat.
When higher layers absorb more photons coming up (because the CO2 concentration is higher due to man made CO2) the escape altitude increases. The temperature is lower at the new escape altitude because the atmosphere cools as you go higher (at the lapse rate). This causes an energy imbalance because less energy is emitted at the cooler altitude according to the Bozeman relationship. The new altitude has to warm to return to energy balance. This warming is transmitted down according to the lapse rate and results in surface heating.
At the escape altitude the CO2 absorbtion bands are not saturated so increasing CO2 increases absorbtion. Water is essentially not present so overlap of bands with water does not count either. The escape altitude increasing is the key to understanding the greenhouse effect. The lapse rate is 6C per kilometer. The escape altitude is about 10,000 meters. If the escape altitude increases 100 meters the surface temperature increases 0.6C.
Thank you MA Rodger for posting the figures in Zhong and Haigh (2013). Would it be possible to print 6(c) separately in a post so one can read the explanation inside the figure.
The black line in Fig 6(c) which is horizontal to the right of 10**2 shows the instantaneous relative forcing due to the central interval of the CO2 absorption 650-680/cm, which is 15 μm plusminus 2%. At the present level of 400 ppmv there is saturation. Fig 2 in Zhong and Haigh (2013) shows that 650-680 is the peak of the absorption coefficient for CO2 between 500 and 1500/cm. The absorption coefficient in the central interval lies between 100 and 1000. In the shoulders the absorption coefficient lies between 1 and 100 and in the wings it is less than one. This is a rough impression. Figure 2 is not very detailed. The statement: "At wavelength 15 mm there is saturation" is true. The statement: "The contribution of the shoulders compared to the central region around 15 μm is negligible" is also true if one looks carefully at Figure 2. It is only by looking better at Figure 6(c) that one sees that the shoulders 590-650/cm and 680-750/cm do make a significant contribution and that saturation at these wavelengths is still far off (it will occur at 40 000 ppmv).
Zhong and Haigh (2013) have used the latest version HITRAN2008 for the analysis which underlies their paper. It is possible that older versions give different results for which the absorption of the shoulders is weaker. The notion of saturation is based on the iconic figure in Wikipedia https://en.wikipedia.org/wiki/Greenhouse_effect which was removed from my post 525 since it was too large. Saturation is a serious objection and it takes a lot of work (see Zhong and Haigh (2013)) to counter it.
The post 542 tries to get at the basics of "absorption" or "reflection" for long wave radiation at around 15 mm. The model I describe is a basic description in terms of photons. Since I am a mathematician specialized in probability theory it seems quite natural to me to use a random walk. I was surprised to see how well it fits with Figure 6(c) in Haigh and Zhong (2013) where one looks at narrow bands of wavelengths. The logarithmic increase shown in Figure 6(b) between 50 and 5000 is a fluke. It is meaningless. It is the result of adding a constant function, two concave functions and three convex functions in Figure 6(c).
The basic description in terms of reflection in post 542 does not take secondary effects like temperature differences in the troposphere into account. It is based on the idea that photons don't just disappear. They may be absorbed, but are emitted again within a fraction of a second. So I have problems with the first paragraph of post 546 by Michael Sweet which seem to suggest that there is no conservation of photons.
My understanding is that the amount of heat (energy) due to the vibration caused by the absorption of photons at around 15 mm is negligible, and that it is the long wave radiation reflected back to earth as described in the random walk model which is the "greenhouse effect".
Many of those spectrum in previous comments, is not showing the whole infrared transmission spectrum below 400 1/cm. Why? It seems be manipulative if there isnt good reason for it.
Anyway, I found a interesting site from chicago university that simulates the band saturation.

http://climatemodels.uchicago.edu/modtran/
(The site used in the following video:)
https://www.youtube.com/watch?v=ZMgNYDtueKQ
[DB] Please limit image widths to 450. Subsequent violations will be removed.
Inflammatory snipped.
We seem to agree on that the effect lays in the TOA and the transmission curve at high altitudes.
So, just for fun, is it possible to explain the argumented athmospheric big effect with some analogy? :-)
If i am outside in antartica in 100 layers of sleeping bags. But the most outer sleeping bag is only a cotton layer so it radiates a lot from this layer at all its internal altitudes with the wind blowing though it etc.
Double the amount of CO2 to 800ppm corresponds to exchanging that 100th cotton layer into a regular sleeping bag. So now the transmission curve has changed drastically of the top layer.
But i was already in 99 nice sleeping bags. Could you alter the effect in this scenario that corresponds to what you believe is actually happening?
PringlesX ,
sorry, but your "sleeping bag" analogy simply doesn't fit the situation.
And there seems to be no connection between Greenhouse and the "hockey stick".
Since the Hockey Stick has been well validated by a number of subsequent scientific studies (even without tree-ring data) . . . then it sounds like "Manhattancontrarian" is probably just one of those many clickbait blogsites. You know ~ one of those clickbait sites with stuff like "Scientists prove Earth is flat" . . . "Infrared photos show English Queen is a Lizardperson" . . . "Russian lasers show Moon is green cheese" . . . and so on.
Really, PringlesX, if Mr Manhattancontrarian has some astounding new earth-shattering information on The Hockey Stick (info is which strangely unreported by the world's media) ~ then please, please give us readers a succinct summary of it. On the appropriate SkS thread, of course. Let's not go down the brainless clickbait path !
[PS] Please refraim from discussing "hockey stick" on this topic. Discussions of that belong here.