


 Arguments


CO2 lags temperature - what does it mean?
What the science says...
| Select a level... |
 Basic
Basic
|
 Intermediate
|
 Advanced
| ||||
|
CO2 didn't initiate warming from past ice ages but it did amplify the warming. In fact, about 90% of the global warming followed the CO2 increase. |
|||||||
Climate Myth...
CO2 lags temperature
"An article in Science magazine illustrated that a rise in carbon dioxide did not precede a rise in temperatures, but actually lagged behind temperature rises by 200 to 1000 years. A rise in carbon dioxide levels could not have caused a rise in temperature if it followed the temperature." (Joe Barton, US House of Representatives (Texas) 1985-2019) - Full Statement
At a glance
Antarctic ice-core data today provide a continuous record on temperature and atmospheric composition that goes back for some 800,000 years. The data track the last few glacial periods and their abrupt endings, with rapid transitions into mild interglacials. But in some of the ice-cores, temperature rises first and is followed, a few hundred years later, by rising carbon dioxide (CO2) levels.
Certain purveyors of climate-myths seized on this observation, claiming it to be “proof” that carbon dioxide doesn't cause climate change. Wrong, wrong, wrong. But how? The answer lies in a beer-can.
In fact, you can do this one yourself. You need two cans of any fizzy beer. On a nice summer's day, take one out of the fridge and place it outside in direct sunshine for a few hours. Leave the other where it is. Then open the two at the same time. The warm one will froth like mad, half-emptying the can and making a mess. What is left in the can will be horrible and flat. Conversely, the one straight from the fridge will just give a “pfft” noise and will be pleasant to drink, being cool and fizzy.
What's that got to do with this myth? Well, you have just demonstrated an important point about the solubility of CO2 in water. CO2 gives fizzy drinks their fizz and it is far more soluble in colder water. As the water warms, it cannot hold onto as much CO2 and it starts to degas. Hence that flat lager.
Exactly the same principle applies to the oceans. When global warming is initiated, both land and the oceans start to warm up. On land, permafrost starts to thaw out, over vast areas. Carbon dioxide (and methane) are released, having been trapped in that permafrost deep-freeze for thousands of years. At sea, that “warm beer effect” kicks in. Thanks to both processes, atmospheric CO2 levels rise in earnest, amplifying and maintaining the warmth. That rise in CO2 thereby caused more of the gas to be released, warming things up yet more in a vicious cycle, known as a positive feedback. Other feedbacks kick in too: for example as the ice-sheets shrink, their ability to reflect Solar energy back out to space likewise decreases, so that heat is instead absorbed by Earth’s surface.
The trigger for the initial warming at the end of an ice-age is a favourable combination of cyclic patterns in Earth's orbit around the Sun, leading to a significant increase in the solar energy received by Earth's Northern Hemisphere. That's no secret. Glacial-interglacial transitions are caused by several factors working in combination – triggers and feedbacks. We've understood that for a long time.
And when you think about it, saying CO2 lagged temperature during glacial-interglacial transitions so cannot possibly be causing modern warming is a bit like saying, “chickens do not lay eggs, because they have been observed to hatch from them".
Please use this form to provide feedback about this new "At a glance" section. Read a more technical version below or dig deeper via the tabs above!
Further details
That CO2 can lag behind but amplify temperature during a glacial-interglacial transition was in fact predicted as long ago as 1990. In the paper The Ice-Core Record: Climate Sensitivity and Future Greenhouse Warming by Claude Lorius and colleagues published in the journal Nature in 1990, a key passage reads:
"The discovery of significant changes in climate forcing linked with the composition of the atmosphere has led to the idea that changes in the CO2 and CH4 content have played a significant part in the glacial-interglacial climate changes by amplifying, together with the growth and decay of the Northern Hemisphere ice sheets, the relatively weak orbital forcing and by constituting a link between the Northern and Southern Hemisphere climates."
This was published over a decade before ice core records were accurate enough to confirm a CO2 lag. We now know that CO2 did not initiate the warming from past ice ages but it did amplify the warming. In fact, about 90% of the global warming followed the CO2 increase.
Antarctic ice cores reveal an interesting story, now going back for around 800,000 years. During this period, changes in CO2 levels tend to follow changes in temperatures by about 600 to 1000 years, as illustrated in Figure 1 below. This has led some to disingenuously claim that CO2 simply cannot be responsible for the current global warming. Unsurprisingly, such a claim does not tell the whole story.
Figure 1: Vostok ice core records for carbon dioxide concentration and temperature change.
The initial change in temperature as an ice-age comes to an end is triggered by cyclic changes in Earth’s orbit around the sun, affecting the amount of seasonal sunlight reaching Earth’s surface in the Northern Hemisphere. The cycles are lengthy: all of them take tens of thousands of years to complete.As both land and oceans start to warm up, they both release large amounts of CO2 into the atmosphere, from melting permafrost and from warming ocean water, since CO2 solubility in water is greater in cold conditions. That release enhances the greenhouse effect, amplifying the warming trend and leading to yet more CO2 being degassed. In other words, increasing CO2 levels become both the cause and effect of further warming. Once started, it’s a vicious, self-reinforcing cycle - an excellent example of what science refers to as a positive climate feedback.
Indeed, such positive feedbacks are necessary to complete the shifts from glacial to interglacial conditions, since the effect of orbital changes alone are too weak to fully drive such variations. Additional positive feedbacks which play an important role in this process include other greenhouse gases like methane - you may have seen videos of that gas bubbling up through icy lakes in permafrost country and being ignited. Changes in ice sheet cover and vegetation patterns determine the amount of Solar energy getting absorbed by Earth’s surface or being reflected back out to space: decrease an ice-sheet’s area and warming will thereby increase.
The detailed mechanisms for the above general pattern have of course been investigated. In a 2012 study, published in the journal Nature (Shakun et al. 2012), Jeremy Shakun and colleagues looked at global temperature changes at the commencement of the last glacial-interglacial transition. This work added a lot of vital detail to our understanding of the CO2-temperature change relationship. They found that:
1) The Earth's orbital cycles triggered warming in the Arctic approximately 19,000 years ago, causing large amounts of ice to melt, flooding the oceans with fresh water.
2) This influx of fresh water then disrupted ocean current circulation, in turn causing a seesawing of heat between the hemispheres.
3) The Southern Hemisphere and its oceans warmed first, starting about 18,000 years ago. As the Southern Ocean warms, the solubility of CO2 in water falls. This causes the oceans to give up more CO2, releasing it into the atmosphere.
4) Finally, CO2 levels may lag temperature in some ice-core records from Antarctica, but in some other parts of the world the reverse was the case: temperature and CO2 either rose in pace or temperature lagged CO2. Figure 2 demonstrates this graphically and shows how things are never as simplistic as purveyors of misinformation would wish.
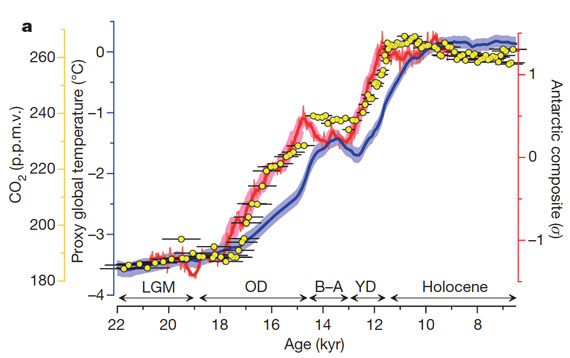
Figure 2: Average global temperature (blue), Antarctic temperature (red), and atmospheric CO2 concentration (yellow dots). Source.
Last updated on 14 February 2023 by John Mason. View Archives


>>Rodger
>>I am assuming that you have not yourself "counted
>>the years." For my own part, I have in the past been
>>content to take the word of others for the recent ice
>>age cycles being 100,000 years long, this being a
>>well-known and unchallenged finding.
If you look at post 479, you will see that the gap between recent interglacials is 109 k years, not 100 k years. And this is supported by this alternate graphic of the Vostok data. And here you will see two 109 k year cycles,* preceded by two 88 k year cycles:**
https://i1.wp.com/www.brighton73.freeserve.co.uk/gw/paleo/400000yearslarge.gif
Quite clearly, the Interglacials are following the Milankovitch warming in the NH, with intervals of 4 cycles and 5 cycles (for the last two cycles).
* A 113 k cycle, and a 109 k cycle.
** The difference from my previous post is caused by some confusion over the length of the precessional cycle. It is given as 25,800 years in many texts, but if you look at these graphs they clearly show a 22,000 year cycle. I am not sure why the difference. I simply counted the precessional cycles, rather than counting the years. But if the precessional cycle really is 22,000 years, which is not how I understood it, then the Ice Age cycle lengths are shorter, but still not equal. But there are still two different cycle lengths to Ice ages, and averaging them is not a valid methodology.
>>I am at a loss with what you mean by the
>>phrases "key factor" and "key feeback"
The primary feedback. It is highly unlikely that all feedbacks are equal in effect. My point was the albedo feedbacks are probably more important than CO2 feedbacks, because Interglacials react to high latitude NH forcing. That strongly suggests that forcing and feedbacks are a result of changes in albedo, rather than a function of CO2.
>>The full mix of forcings that result in ice age cycles is not
>>yet fully determined which makes any informed response
>>to you a tad harder still.
I thought the 'science was settled'?
[DB] Inflammatory tone snipped.
That's a lot of different cycles mentioned here. What are the statistical criteria to establish the existence of a cycle? What method did you use to identify the cycles? Does this fine cycle discrimination have any reference in the scientific litterature?
tatelyle @500.
Concerning your little cycling excursion, it is foolish to ignore apsidal precession which is the "difference" you say you are still "not sure about" and whose inclusion yields the net 21.6ky cycle in precession. I can't say I've ever seen a figure for the size of variation in this cycle length. (I imagine it to be small. Axial precession is 25.7+/0.4ky.) This regional/seasonal cycle is of course modulated by eccentricity that leads rise to talk of the 19ky & 23ky signals which when combined achieve the modulated ampitudes. That said, the graphic you reference @500 allows measurement of the length of the three last ice ages yielding (backward from the present) lengths of 119ky, 107ky & 88ky. I'm not sure how this squares with your measurements or with your attempts to fit climate data with the lengths of multiples of precession cycles. Your efforts in this specific matter appear to be mainly driven by what is a well-known incongruity. That is that the high levels of variation in NH insolation due to orbital precession have small climatic reactions while the low levels of variation due to global orbital eccentricity have very large climatic reactions. This finding is decades old so try not to get too bogged down in it - it is well trampled ground.
Concerning your resurrection of the incoherence you presented @498, the sentence at which I gave up all hope of identifying your meaning was "The exclusivity of NH insolation triggers strongly suggests that albedo is the key factor and the key feedback regulating Interglacials." I'm afraid that substituting the word "primary" for the word "key" doesn't make your meaning any clearer.
PhillipeChantreau @502, using the following image I calculated by pixel count that Antarctic temperature rose to 0 C, at succussive intervals of, 86 thousand, 91 thousand, 112 thousand and 120 thousand years ago (most ancient to most recent).
That takes us back to 400 Kya. Prior to that, interglacials are cooler, and more frequent. Using the initial -4 C line to characterize the frequency, we have intervals of 48, 24, 85, 45, 25, 34, 23, 73, 90, 92, 29, 85, 120 thousand years respectively (counting from 800 Kya). The underlined pair pair obviously show as a single cycle if we use 0 C to characterize successive cycles.
This simple count between years of particular phases is a crude method to characterize cycles as you know. If that was what we had to relly on, we would not be able to characterize the frequency of glaciations in any meaningful way. More advanced techniques show a clear dominance of the 41 Ky obliquity cycle over the last two million years (panels D and F), with the 100 Ky cycle becoming significantly more important in recent times:
Over the last 400 Ky, the 100 Ky cycle has become dominant, with the 41 Ky obliquity cycle still having a greater influence than precession cycles:
Thank you Tom, that is much more informative than Tatelyle assertions. The B,D and F graphs in the second figure of yout post are representations of what would be considered reliable ways to determine the presence of a cycle. I had no doubt that this work had been done and that a wide litterature existed on the subject. I am still wondering what is Tatelyle's basis to claim against that existing litterature, perhaps he will tell us more.
It has now been four days since my challenge to tatelylle @496 that he either justify his apparently absurd claim that ice melt is not a feedback on changes in Global Mean Surface Temperature (GMST), or confirm that his argumentation has been based on equivocating between the cause of changes in GMST (in his earliest post, and by context of the main article) and the cause of initial melt of NH ice sheets. tatelyle has done neither. Apparently he can neither provide evidence for his claim, nor honestly admit to the equivocation that lies at the heart of his rhetoric. He has therefore demonstrated that he is either not interested in, or as MA Rodger suggests @499, not capable of coherent and honest discussion of the issues involved. Consequently I have no further interest in discussing the matter with him.
For readers following the discussion, however, I need to clarrify some issues. Specifically, tatelyle continues to make grossly inflated estimates of the Milankovitch forcing involved both changes in GMST and in the initiation of NH ice sheet melt.
For GMST, global temperatures fluctuate approximately linearly with net global Top Of Atmosphere (TOA) energy flux, subject to a lag based on thermal inertia which is large relative to a single year. It follows the relevant variation in TOA insolation is the globally, and annually averaged value. As a less accurate proxy of GMST, we could estimate regionally averaged temperatures as a function of regionally averaged net TOA flux; and from that estimate a global average temperature. This is less accurate because it ignores the large lateral heat transfers at the Earth's surface due to winds and ocean currents. However, even doing this we must again take a global, annual average. That is, if we assume NH summer temperatures vary with TOA solar flux, then the impact of that variation of GMST must still be averaged over the global surface area to reflect the impact on GMST. Ergo, tatelyle's core argument for higher relevant fluxes is based on the assumption that we are not discussing the effect of Milankovich cycles on GMST (contrary to the clear context in the main post and his initial statement of the issue).
Turning to the relevant forcing for the initiation of glacial melt, tatelyle is quite correct that it should not be globally, or hemispherically averaged. Rather, the value should be considered only over the area of ice melt. Never-the-less, tatelyle's back of the envelope calculations of the value are grossly exagerated. Specifically:
tatelyle uses as the baseline of his estimates a 90 W/m^2 change in mean daily insolation in July at 65o North. He draws that figure from the graph below, but only one of the upswings in summer insolation shown in that graph equals or excedes 90 W/m^2 (and that one did not result in a deglaciation). The mean increase in insolation on that chart, averaged across all upswings, is 60 W/m^2 (or 61 W/m^2 if only the two upswings leading to glaciations are counted). The median is 58 W/m^2 and the 5th percentile is 20 W/m^2. Clearly based on these figures, tatelyle's figure is at least a 50% and potentially a 350% exageration of the July 60o N insolation necessary for a deglaciation. As the largest insolation upswing did not result in a full deglaciation, it is clear that no value shown on the chart is sufficient for a deglaciation by itself, but that other factors must also be involved.
For what follows, rather than trying to estimate the exact insolation change needed, I have used the deglaciation with the smallest change in insolation, ie, the Holocene deglaciation, as a benchmark. I have calculated the values for the difference in insolation between the inosolation minimum (20 Kya) and respectively, the present, the peak Holocene insolation (9 Kya) and the onset of rapid deglaciation (15 Kya). For insolation figures I have used the data from Berger (1978) as it is considered most accurate for the present (1950) and equivalent to the more recent 1991 calculations out to 800 Kybp. As the data comes by 10 degree latitude band, I have calculated the 65o N values by taking an area weighted average of the 70o (75-65o) and the 60o (65-55o) bands. This may result in a small error as an estimate of insolation at 60o N precisely, but a better estimate of the mean insolation over the band of most significant ice sheet melt. The calculated insolation difference for July at 65oN from the insolation minimum are for 0 Kybp, 9 Kybp and 15 Kybp are respectively, 7.4 W/m^2, 51.5 W/m^2 and 29.2 W/m^2.
As noted, tatelyle's estimate of a 90 W/m2 insolation increase was based on July at 65o N. The insolation increase in June and August, let alone April and October, is less. As a result the mean daily summer insolation change for 65o N for LGM to Holocene maximum (20-9 Kybp) is 44.1 W/m^2, 10% less than the July value.
Of course, tatelyle challenges the use of only summer insolation. He considers it obvious that the melt season lasts 40% of the year. That is far from obvious to me. I suspect the melt season depends on latitude, altitude and local conditions. That quibble aside, in Greenland melt occurs between April and October, with the vast majority of the melt occuring in the summer months of June-August. To estimate a melt season, I note that Peter Huybers (2006) notes prior reports that melt is ice ablation correlates with positive degree days, ie, days when the 2 M air temperature rises above 0 degrees. He shows that positive degree days are highly correlated with days when TOA insolation exceeds 275 W/m^2. Using that relationship, I use a melt season consisting of any month in which mean daily insolation averages 275 W/m^2 or more - which turns out to be April-August. So defined, the TOA insolation difference averaged over the melt season at 65o N turns out to be 2.4 W/m^2 between LGM and present (20-0 Kybp), 32.4 W/m^2 for LGM to Holocene peak (20-9 Kybp), and 25.7 W/m^2 for LGM to onset of rapid deglaciation (20-15 Kybp).
Being as fair as possible to tatelyle, the 32.4 W/m^2 difference between insolation minimum and maximum is the value he wanted to compute, and is just over his revised estimate of 32 W/m^2. It might appear that his inaccurate calculation has cancelled out the effect of his theoretical errors. This would be the case were it not for his most fundamental error - ignoring albedo.
Solar forcing equals TOA insolation - reflected shortwave radiation at TOA. Therefore, to calculate the equivalent of the CO2 forcing, tatelyle needs to adjust the TOA insolation for albedo. Because in this instance we are examining only the impact over the ice sheets durring the glaciation, and as we are examining the no feedback case (both from tatelyle's hypothesis and because we are examining the regional forcing), the appropriate albedo is ice sheet albedo at the start of the melt season. For Greenland that is 0.835. Adjusting for Albedo then gives us a melt season 65o N mean daily insolation of 0.4 W/m^2 for the LGM to present (20-0 Kybp), 5.3 W/m^2 for LGM to peak insolation (20-9 Kybp), and 4.2 W/m^2 for LGM to onset of rapid deglaciation (20-15 Kybp). These are overestimates of the relevant values because the calculation does not include the impact of cloud cover, which further reduces the effective mean daily insolation at the top of the ice sheet.
These values (although upper limits) are the best comparitors to tatelyles calculated value of 32 W/m^2. In particular, the difference between the LGM and the onset of rapid deglaciation probably represents the best estimate of the upper limit on the necessary regional insolation forcing change to initiate deglaciation. Based on that, tatelyle overestimates it by 660%.
Note, this is for the change in regional forcing directly impacting on the icesheet. For TOA insolation, his estimate is reasonable, and for global forcing (ie, the most relevant value), the true figure is approximately 1.3 W/m^2 over the melt season and 0.5 W/m^2 averaged over the full years forcing.
I've been reading the above article and subsequent posts (only a fraction of them I confess, I don't have that much free time). One question that I am struggling to find an answer to is why does global warming naturally stop? The mechanisms for the causes of it are covered ad nauseam, but I have yet to find a discussion on why it isn't a run away process resulting in a Venus like Earth, which it clearly hasn't. The forcing by oceanic CO2 release would sugest to me that it should be. So what stops the process?
Twobad @507, this question is discussed in detail here (remember to read the intermediate and advanced versions of the article as well).
Toobad,
The biggest negative feedback is that the amount of radiation emitted from the atmosphere goes up as the atmosphere warms. This increase is to the fourth power of the temperature. Eventually this increase in emitted energy overcomes any positive feedbacks because the increase in emitted energy is so great.
Everything considered is much more complicated, but the increase in emitted energy wins out in the end.
If we have verified that CO2 follows the increase of the global temperature in the ice cores with a determined time delay, it is evident that it is not the CO2 that causes the temperature increase, but the opposite. It is a proof that the temperature causes the increase of CO2. So far we are all agreed. But how do you know that CO2 is responsible for current climate changes? Because it is a greenhouse gas? Of course, all greenhouse gases produce a warming (if the theory of greenhouse effect is true) in the global temperature. But, how do you know that the current increase in temperature (+ -0.5 ° C since the end of the Little Ice Age) is due to the action of the tiny fraction of the atmosphere composed of greenhouse gases and among them the tiny part composed of CO2 and within the CO2 of the tiny percentage produced by human industrial societies and not due to the action of other more widespread greenhouse gases or to the huge natural emissions of CO2 or the undisputed influence of the sun on global temperature wich in turn raises the atmospheric CO2 level?
And yet the BEST team found that, WRT 'Is CO2 leading or lagging temperature rise':
And
Off-topic, but I'll answer anyway and risk the ire of the moderators.
Scientists have a pretty good understanding of what the Earth's climate has been throughout it's history, why it has changed over time and what the specific factors are that have made the climate change.
And the only factor that fully explains all the changes we can see and measure in temperatures, ocean salinity, atmospheric composition, loss of Arctic sea ice volume, changing species habitats & ranges is due to the warming from human-derived fossil-fuel CO2 we have put back into the carbon cycle.
We have accurate, reliable data for the growth of atmospheric CO2 and for anthropogenic emissions (for details, see Cawley, 2011). The fact that the net natural flux is negative clearly shows that natural uptake has exceeded natural emissions every year for the last fifty years at least, and hence has been opposing, rather than causing the observed rise in atmospheric CO2.
It is true that the fluxes between the oceans and atmosphere depend on temperature, so all things being equal, one would expect atmospheric CO2 to rise in a warming world.
However, the thing the fake-skeptics and compulsive liars normally ignore is that CO2 solubility increases with increasing difference in the partial pressures of CO2 between atmosphere and surface waters.
In the real world, all things are not equal, our emissions have caused a difference in partial pressures, which is increasing the oceanic uptake, which more than compensates for the temperature driven change in fluxes.
The human-caused origin (anthropogenic) of the measured increase in atmospheric concentrations of CO2 is a cornerstone of predictions of future temperature rises.
As such, it has come under frequent attack by people who challenge the science of global warming. One thing noteworthy about those attacks is that the full range of evidence supporting the anthropogenic nature of the CO2 increase seems to slip from sight. So what is the full range of supporting evidence?
There are ten main lines of evidence to be considered:
1. The start of the growth in CO2 concentration coincides with the start of the industrial revolution, hence anthropogenic;
2. Increase in CO2 concentration over the long term almost exactly correlates with cumulative anthropogenic emissions, hence anthropogenic;
3. Annual CO2 concentration growth is less than Annual CO2 emissions, hence anthropogenic; (Link, Link)
4. Declining C14 ratio indicates the source is very old, hence fossil fuel or volcanic (ie, not oceanic outgassing or a recent biological source);
5. Declining C13 ratio indicates a biological source, hence not volcanic;
6. Declining O2 concentration indicate combustion, hence not volcanic;
7. Partial pressure of CO2 in the ocean is increasing, hence not oceanic outgassing;
8. Measured CO2 emissions from all (surface and beneath the sea) volcanoes are one-hundredth of anthropogenic CO2 emissions; hence not volcanic;
9. Known changes in biomass too small by a factor of 10, hence not deforestation; (Link, Link)
10. Known changes of CO2 concentration with temperature are too small by a factor of 10, hence not ocean outgassing.
The current, and ongoing, increase in atmospheric carbon dioxide concentration is due to human industrial activities. In scientific circles this is the climatological equivalent of the Earth being round - a fact so plainly obvious and supported by such a vast body of scientific evidence that to question its reality is absurd.
It quickly becomes clear that it is the humans who have caused the rise in CO2 levels, by burning fossil fuels in the twentieth century. Every other hypothesis makes a host of predictions that do not pass the test of the evidence.
H/T to Tom Curtis, from which much of the above is sourced.
Please stay on-topic from now on. Thousands of threads exist here on virtually every topic related to climate change imaginable. Use the Search function to find the most appropriate thread and place your questions there.
Adri Norse Fire @510:
1)
As it happens, however, what has been determined over the most recent deglaciation is that 90% of the temperature increase lags the CO2 increase (see final figure in OP, and Shakun et al (2012)). That is entirely consistent with the standard theory which is that while the deglaciation was triggered by changes in NH insolation due to the Milankovitch cycles, it was then driven by a feedback cycle of greenhouse gases (CO2 and methane) and albedo changes.
I would be a bizarre form of science that threw out a theory because the data conformed with the expectations from the theory.
2)
A regression of Global Mean Surface Temperature (GMST) against CO2 forcing shows a correlation of 0.9, an R^2 of 0.811, and a temperature change of 0.58 C/(W/m^2), ie, a Transient Climate Responsce (TCR) of 2.14 C per doubling of CO2. In contrast a similar regression of GMST against Total Solar Irradiance (TSI) shows a correlation of 0.416, an R^2 of 0.173, and a temperature change of 1.77 C/(W/m^2). Adjusting to the solar forcing, that represents a temperature response of 10.1 C/(W/m^2), or a TCR or 37.3 C per doubling of CO2.
The high correlation between CO2 forcing and temperature is not due to the CO2 increase being a consequence of temperature increase, both because multiple lines of evidence show the CO2 increase to be due to anthropogenic emissions (as per Daniel Bailey's post @512) and because the correlation between GMST and CO2 forcing (0.9) is higher than the 0.679 correlation between GMST and CO2 concentration. To reject the dominant role of CO2 forcing in the increase in GMST in this circumstance is to reject that which has strong supporting evidence (CO2 forcing as the cause) in favour of that with only very weak evidence (TSI forcing as the cause); but also to indulge in magical thinking that supposes that like effects (ie, similar values in forcing) are up to 17 times stronger when the cause is solar forcing than when it is CO2 forcing.
There is much more evidence of the dominant role of CO2 forcing in recent temperature increases than this, and stronger individual items of evidence - but this evidence is very straight forward and easy to understand. In the end you either accept evidence or you do not. If you do, you do not have any serious doubt as to the role of the anthropogenic increase in greenhouse gases in the current rapid increase in GMST.
Adri Norse Fire @510:
Here's another science-based response to the issue you have raised:
Source: Climate Change: Picturing the Science, Gavin Schmidt and Joshua Wolfe, W.W. Norton Company Ltd, 2009
Based off the carbon dioxide v temp change over 400,000 years graph, it shows for a 80ppm rise in carbon dioxide that the temp increase is 6 degrees C. If you then take Tom Curtis's graph showing todays carbon dioxide level spike which is an increase of 125ppm you can roughly interpolate a future temp rise of around 9 degrees C assuming its linear. This is without even starting to reduce overall global emsiions. This is all assuming co2 causes temp increases(and if it does, humanity has already gone past the point of no return and all this arguing is a waste of time). But it doesnt and I can prove why. If you look at the backsides of the spikes of co2 v temp, you will notice as the suns effect reduces and temp falls, co2 still stays high. If co2 was the driving factor, temp wouldnt suddenly decline, it would plateau(as its a greenhouse remember) and both co2 and temp would come to an equalibrium and fall together. This is not showen to be true based off the historical data.
poncholarpez @515:
1) Greenhouse gases account for 46%, and CO2 changes for around 30%, of the temperature change between glacial and interglacial, as shown in the following graph:
Based on that, the presumption would be that a 125 ppmv increase in CO2 would drive not a 9 C increase, but a 3 C increase, assuming linearity. Of course, there is not point in assuming linearity because it is known that temperature responds to the log of CO2 concentration, not linearly. Factoring that in, the expected equilibrium response (ECS) of the current increase over the preindustrial is about 1.5 C. To reach the equilibrium response, however, takes decades. The expected current response is better mapped by the Transient Climate Response (TCR) of about two thirds of the ECS, or about 1 C for the current CO2 concentration. Of course, the temperature response over the glacial cycle has time for a full equilibrium response rather than just the transient response.
The upshot is that your entire premise is wrong.
2) Moving on from that, because the CO2 response represents only about a third of the total response, it is quite possible that a decline in one of the other factors could lead to a gradual decline in temperature, which leads to a decline in CO2 concentration. In particular, albedo is likely to increase gradually as NH summer insolation declines as a result of Milankovitch cycles.
The upshot is that you have simply demonstrated once again that, as is so often the case, arguments premised on scientists being too stupid to see the obvious merely show the person making the argument to be too ill informed to see what is obvious to those scientists all along.
Eclectic asks elsewhere, with regard to the relative attribution to albedo and ghg contributions to the glacial to interglacial cooling as shown in Hansen and Sato:
The graph I showed represents the change in radiative forcing and temperatures between the Last Glacial Maximum and the Holocene, ie, over a warming phase. However, it takes the difference in the values between the two times, and the relative contribution may (indeed, probably) differs at different stages in the process, or by small amounts for different glacial to interglacial (warming) or interglacial to glacial (cooling) transitions.
Based on Shakun et al (2012), durring the earliest phase of the most recent glacial to interglacial transition, albedo effects were probably more important than GHG effects, but that means at some stage the GHG effects would have been more important than the albedo effects than is shown in the Hansen and Sato graph. Otherwise the cumulative effect would not be that shown in their graph.
Likewise, from the long lag in the previous glacial to interglacial shown in the first graph in the OP, albedo effects were probably more important in the early stages of that transition, with GHG effects becoming more important later on with cumulative contribution from Eemian to LGM likely to approximate to those shown in Hansen and Sato. That said, lags vary substantially between different transitions, and sometimes though not often CO2 changes precede temperature responses (eg, 325000 years ago in the Vostock graph) - so the exact relative contribution and timing of the contribution must also vary. In general, however:
1) Milankovitch effects trigger the temperature response;
2) Albedo effects seem to follow closely on the Milankovitch effects; and
3) GHG effects seem to lag on both, and to lag more in cooling transistions than in warming transitions.
As to GHG being unimportant, consider this smoothed version of the Vostock graph:
The smoothing makes clear that the current interglacial is unusual in to respects. First, in prior interglacials temperatues have declined quite rapidly after the maximum has reached (in geological terms), before dropping through the floor once some threshold is reached. In contrast, in the Holocene, they have remained near constant. Second, in prior interglacials, have also declined (though not as rapidly as temperature initially in the Eemian at least). In contrast, in the Holocene the CO2 concentrations started to decline, and then rose by about 20 ppmv, against the temperature trend. There is substantial reason to believe that the CO2 increase was due to agricultural practises of preindustrial humans; and that the flat temperatures of the Holocene are due to the temperature increase from the rising CO2 countering the temperature decrease from the known increase in albedo over the same period (due to Milankovitch factors). (Known increase in albedo because the Arctic was ice free 8000 years ago, and reached a Holocene maximum in sea ice extent in the 19th century.) The Holocene climate and CO2 record would not have been possible if CO2 had no effect. Of course, there is far better evidence of the effect of CO2 than this, and I do not expect anybody unwilling to be convinced by that other evidence to be convinced by this. But it does illustrate that their go to evidence also refutes their case.
Tom Curtis @517
Thanks for your courteous and prompt reply, especially in view of your workload. I had been innocently picturing that each of the recent set of glaciations followed a very standardized path, without much variation. There was an earlier SkS article that linked to a paper showing the Milankovitch orbital fluctuations of the past half-million years, and indicating that in the coming few dozen millennia we would experience a relatively low-eccentricity of orbit, which might have a damping effect on the approach of the next glaciation. But as you say, Holocene humanity (and its increasing population) would be a more likely explanation for the Holocene's "abnormality".
Thanks once again, Tom. And if it's not being too saccharine of me, I'd like to thank you on behalf of all visitors and participants at SkS. You are a scientific powerhouse in the SkS comments columns.
Tom Curtis. The graph I was quoting in the OP isays it is a direct correlation to historical observed co2 v temp. They rise at the same rate, not at a log offset with an assumed modified result for proportion of co2 making up greenhouse gasses in the atmosphere. If you could accurately subtract other greenhouse gass portion of the temprature into that graph, then you would clearly see that warming trends have no correlation to co2. Very impessive graph though that combined with the feedback given, now further proves my point but in the upside spikes of the graph too. Thanks for that ;)
The bar graph you used implies that co2 is a warming driver under the greenhouse gasses group, when, this is what is being debated in this thtead, yet it is being taken as gospel that it is?? Furthermore, the bar graph you provided takes no account of water vapour as a greenhouse gass and takes no account of potential cloud cover conditions. Ill informed, nice try.
[JH] Please keep it civil.
poncholarp @519:
1) "The graph I was quoting .... ... not at a log offset..."
The graph plots CO2 and temperature against time. It does not plot correlation, and if you were to attempt to plot correlation, you would use a scatter plot. As it happens, the correlation between CO2 concentration and temperature is 0.888 +/- 0.037 using means of 1000 year bins of the data, with bins where one or both data sets had no representatives being excluded. (The results might differ with other means of dealing with the fact that the actual data do not have CO2 values and deuterium values on the same dates.) In contrast the correlation of CO2 forcing and temperature is 0.879 +/-0.038. Both are high, and while (as expected) the CO2 concentration has the higher correlation, both are within error of each other.
Note that we expect the correlation to be higher for concentration because temperature drives the changes in CO2 concentration, while CO2 forcing only partially drives the temperature over that period. In contrast, in the modern period, when it is known that temperature is not driving CO2 concentration, we expect CO2 forcing to correlate better with temperature than does CO2 concentration. And indeed, that is the case.
In any event the difference between CO2 concentration and CO2 forcing plotted against (in this case the Epica Dome C 800,000 year record) is scarcely noticable to the naked eye:
(Note, the data terminated 24,000 years BP for deuterium, but there was no data for CO2 in the 24,000 - 25,000 years BP bin, hence the first data point is for 25,000 years BP.)
2) "If you could accurately subtract..." What utter tripe, and you know it to be utter tripe because your conditional "If you could" shows that your conclusion that "...you would clearly see that warming trends have no correlation to co2" is simply made up. As it happens, they also have ice core records of methane and nitrous oxide, and you are simply wrong. Your made up "fact" is a fiction.
3) "Very impessive graph though that ... now further proves my point" I am very certain it does not, but cannot mount any argument because you have completely failed to provid evidence for this claim. Given that, it amounts to sloganeering.
4) "The bar graph you used implies that co2 is a warming driver... when, this is what is being debated in this thread ..."
Now, either you are attempting to criticize the standard theory of greenhouse gases and the LGM - which is that temperature responds to the log of CO2, and that CO2 was one of several relevant greenhouse gases, and that changes in albedo had slightly more effect than the combined effect of greenhouse gases. In that case I do not need to support the graph because it simply presents that theory you are trying to criticize - and shows that you have not accurately presented it.
Alternatively you are trying to refute a theory of your own concoction that no informed person believes, in which case who cares. I think, however, that you are trying to pass of the theory of your own concoction as that which climate scientists use, and pretend the refutation of your nonsense thereby refutes thousands of person/years of research.
[PS] Both of you need to keep it civil. Take a deep breath, ignore provocation and stick to discussing the science.
Your article justifying the IPCC initial panic on Ice Core data which gave rise to concern along the lines of "which came first, the chicken or the egg," or being less frivolous and keeping within the goal posts of "which came first, CO2 or Warming," is nicely handled in describing it much as the God Particle, it being all over the place at one and the same time: "In other words, increasing CO2 levels become both the cause and effect of further warming."
You then further state, "This positive feedback is necessary to trigger the shifts between glacials and interglacials as the effect of orbital changes is too weak to cause such variation." I read this as justification of CO2 being the major influencer as the cause of warming rather than not being a cause - one assumes this is what you are leading us to believe?
Please correct me and educate me where I am undoubtedly wrong but I thought the Gospel according to the IPCC was that, "In the climate system, CO2 concentration is a forcing, whereas for example, water vapour concentration is a feedback?
So what exactly is this "positive feedback" or did you mean “positive feedback forcing,” or should I just shut up and admit that I’m not a scientist?
Yours cordially,
A Bear with demonstrably little grey matter.
PWL,
The video attached to the OP directly addresses your questions. It will be the best way for you to become more scientific.
The short answer to your question is that at the end of the last Ice Age changes in the Earth's orbit started warming. the warming released CO2 into the air. That CO2 caused more warming in a feedback loop. THus CO2 was both a feedback and a cause of the warming as the ice age ended.
The situation is different today. Humans are releasing huge amounts of CO2 into the amosphere. The CO2 we are releasing is the forcing causing the temperature to rise. Humans affect the climate in other ways, for example, farming changes how much light is reflected back to space from land, but CO2 is the most important driver of climate.
At the end of the ice age CO2 was both a forcing and a feedback. Today CO2 is the primary forcing of climate change.
The more you read the more you will know. Keep asking questions about the things you do not understand.
MICHAEL SWEET,
My thanks for your rapid and courteous reply Sir.
So basically before the ice core data was interpreted by some as noting that the former IPCC solidly supported claim of "CO2 CAUSES causes global warming" was put in jeopardy, it was felt unnecessary to say "cause and effect."
And then after some bright wag noted that the ice core data suggested other than what the IPCC had claimed up to a certain date, it was felt necessary to explain it as "cause and effect." And adding into the mix that at the end of the ice age CO2 used to be a forcer and an effector but now it's semi retired back to being a forcer.
Well that seems perfectly and confusingly acceptable to me. There again when I do jigsaw puzzles I usually use a pair of scissors and a hammer too.
By the way, I thought we were still in an Ice Age - albeit an inter-glacial one?
I take it that the CO2 retires from being a feedback during an inter-glacial, shall I?
[RH] Use of all caps is not allowed on SkS (starts to read like yelling).
pwl @523, the very first IPCC report says of the relationship between CO2 and temperature changes between glacial and interglacial, "Variations in carbon dioxide and methane in Ice Age cycles are also very important factors, they served to modify and perhaps to amplify the other forcing factors." So, from the very first IPCC report, the idea that CO2 was a feedback in the glacial cycles already exists.
In fact, I can trace the idea further back than that, to at least 1980 when Saltzman and Moritz describe the action of CO2 in a climate model, saying, "Another positive feedback included is due to longwave emissivity changes associated with CO, changes that, in turn, are postulated to arise in response to the variations of mean Ocean temperature Θ."
The point is that popular presentations, particularly "skepical" presentations often exclude nuance that is found in the scientific literature and IPCC reports. This may give the appearance that the IPCC is responding to "some bright wag" when popularizers of climate science are merely drawing attention to something that has been in the IPCC account all along. What has changed is the popular presentation, and that in the face of a misunderstanding that would already have been cleared up from reading the scientific literature or IPCC. Indeed, it is not unusual to be presented with stunning "new" arguments that merely rehash in an imprecise way a part of a debate that occurred in the scientific literature decades (and in some instances over a century) ago.
Tom Curtis@524
Thank you for your reply.
Do you know, I think the best way to solve this whole pro IPCC / anti IPCC Carbon emissions debate and headache would be to just remove all the CO2 from the Earth's atmosphere.
Once we've done that, there'd be no need for anyone to get all worked up and it wouldn't do that much harm would it. Clearly CO2 is really at the root cause of this whole problem and the sooner we uproot it and get rid of it all, the better. (snip)
[RH] Before you continue to post, I would highly suggest reading the SkS commenting policies. Please keep your posts to the point and written so that they contribute to a positive, learning conversation.
Edit: Followup post deleted for moderation complaint. Also, this snipped post has a sarcastic tone not present in Chris Colose's piece. ...Please move on.