


 Arguments


CO2 lags temperature - what does it mean?
What the science says...
| Select a level... |
 Basic
Basic
|
 Intermediate
|
 Advanced
| ||||
|
CO2 didn't initiate warming from past ice ages but it did amplify the warming. In fact, about 90% of the global warming followed the CO2 increase. |
|||||||
Climate Myth...
CO2 lags temperature
"An article in Science magazine illustrated that a rise in carbon dioxide did not precede a rise in temperatures, but actually lagged behind temperature rises by 200 to 1000 years. A rise in carbon dioxide levels could not have caused a rise in temperature if it followed the temperature." (Joe Barton, US House of Representatives (Texas) 1985-2019) - Full Statement
At a glance
Antarctic ice-core data today provide a continuous record on temperature and atmospheric composition that goes back for some 800,000 years. The data track the last few glacial periods and their abrupt endings, with rapid transitions into mild interglacials. But in some of the ice-cores, temperature rises first and is followed, a few hundred years later, by rising carbon dioxide (CO2) levels.
Certain purveyors of climate-myths seized on this observation, claiming it to be “proof” that carbon dioxide doesn't cause climate change. Wrong, wrong, wrong. But how? The answer lies in a beer-can.
In fact, you can do this one yourself. You need two cans of any fizzy beer. On a nice summer's day, take one out of the fridge and place it outside in direct sunshine for a few hours. Leave the other where it is. Then open the two at the same time. The warm one will froth like mad, half-emptying the can and making a mess. What is left in the can will be horrible and flat. Conversely, the one straight from the fridge will just give a “pfft” noise and will be pleasant to drink, being cool and fizzy.
What's that got to do with this myth? Well, you have just demonstrated an important point about the solubility of CO2 in water. CO2 gives fizzy drinks their fizz and it is far more soluble in colder water. As the water warms, it cannot hold onto as much CO2 and it starts to degas. Hence that flat lager.
Exactly the same principle applies to the oceans. When global warming is initiated, both land and the oceans start to warm up. On land, permafrost starts to thaw out, over vast areas. Carbon dioxide (and methane) are released, having been trapped in that permafrost deep-freeze for thousands of years. At sea, that “warm beer effect” kicks in. Thanks to both processes, atmospheric CO2 levels rise in earnest, amplifying and maintaining the warmth. That rise in CO2 thereby caused more of the gas to be released, warming things up yet more in a vicious cycle, known as a positive feedback. Other feedbacks kick in too: for example as the ice-sheets shrink, their ability to reflect Solar energy back out to space likewise decreases, so that heat is instead absorbed by Earth’s surface.
The trigger for the initial warming at the end of an ice-age is a favourable combination of cyclic patterns in Earth's orbit around the Sun, leading to a significant increase in the solar energy received by Earth's Northern Hemisphere. That's no secret. Glacial-interglacial transitions are caused by several factors working in combination – triggers and feedbacks. We've understood that for a long time.
And when you think about it, saying CO2 lagged temperature during glacial-interglacial transitions so cannot possibly be causing modern warming is a bit like saying, “chickens do not lay eggs, because they have been observed to hatch from them".
Please use this form to provide feedback about this new "At a glance" section. Read a more technical version below or dig deeper via the tabs above!
Further details
That CO2 can lag behind but amplify temperature during a glacial-interglacial transition was in fact predicted as long ago as 1990. In the paper The Ice-Core Record: Climate Sensitivity and Future Greenhouse Warming by Claude Lorius and colleagues published in the journal Nature in 1990, a key passage reads:
"The discovery of significant changes in climate forcing linked with the composition of the atmosphere has led to the idea that changes in the CO2 and CH4 content have played a significant part in the glacial-interglacial climate changes by amplifying, together with the growth and decay of the Northern Hemisphere ice sheets, the relatively weak orbital forcing and by constituting a link between the Northern and Southern Hemisphere climates."
This was published over a decade before ice core records were accurate enough to confirm a CO2 lag. We now know that CO2 did not initiate the warming from past ice ages but it did amplify the warming. In fact, about 90% of the global warming followed the CO2 increase.
Antarctic ice cores reveal an interesting story, now going back for around 800,000 years. During this period, changes in CO2 levels tend to follow changes in temperatures by about 600 to 1000 years, as illustrated in Figure 1 below. This has led some to disingenuously claim that CO2 simply cannot be responsible for the current global warming. Unsurprisingly, such a claim does not tell the whole story.
Figure 1: Vostok ice core records for carbon dioxide concentration and temperature change.
The initial change in temperature as an ice-age comes to an end is triggered by cyclic changes in Earth’s orbit around the sun, affecting the amount of seasonal sunlight reaching Earth’s surface in the Northern Hemisphere. The cycles are lengthy: all of them take tens of thousands of years to complete.As both land and oceans start to warm up, they both release large amounts of CO2 into the atmosphere, from melting permafrost and from warming ocean water, since CO2 solubility in water is greater in cold conditions. That release enhances the greenhouse effect, amplifying the warming trend and leading to yet more CO2 being degassed. In other words, increasing CO2 levels become both the cause and effect of further warming. Once started, it’s a vicious, self-reinforcing cycle - an excellent example of what science refers to as a positive climate feedback.
Indeed, such positive feedbacks are necessary to complete the shifts from glacial to interglacial conditions, since the effect of orbital changes alone are too weak to fully drive such variations. Additional positive feedbacks which play an important role in this process include other greenhouse gases like methane - you may have seen videos of that gas bubbling up through icy lakes in permafrost country and being ignited. Changes in ice sheet cover and vegetation patterns determine the amount of Solar energy getting absorbed by Earth’s surface or being reflected back out to space: decrease an ice-sheet’s area and warming will thereby increase.
The detailed mechanisms for the above general pattern have of course been investigated. In a 2012 study, published in the journal Nature (Shakun et al. 2012), Jeremy Shakun and colleagues looked at global temperature changes at the commencement of the last glacial-interglacial transition. This work added a lot of vital detail to our understanding of the CO2-temperature change relationship. They found that:
1) The Earth's orbital cycles triggered warming in the Arctic approximately 19,000 years ago, causing large amounts of ice to melt, flooding the oceans with fresh water.
2) This influx of fresh water then disrupted ocean current circulation, in turn causing a seesawing of heat between the hemispheres.
3) The Southern Hemisphere and its oceans warmed first, starting about 18,000 years ago. As the Southern Ocean warms, the solubility of CO2 in water falls. This causes the oceans to give up more CO2, releasing it into the atmosphere.
4) Finally, CO2 levels may lag temperature in some ice-core records from Antarctica, but in some other parts of the world the reverse was the case: temperature and CO2 either rose in pace or temperature lagged CO2. Figure 2 demonstrates this graphically and shows how things are never as simplistic as purveyors of misinformation would wish.
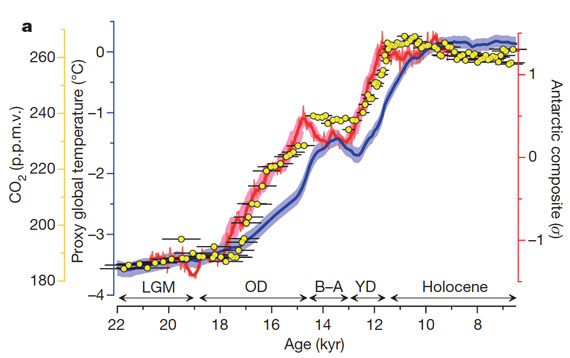
Figure 2: Average global temperature (blue), Antarctic temperature (red), and atmospheric CO2 concentration (yellow dots). Source.
Last updated on 14 February 2023 by John Mason. View Archives


Michael sweet this is why jumping multiple pages for a flowing conversation causes issues. I did respond to your graph and then in this comment section I had it pointed out when the timing for ice ages changed from 41000 years to 100000 years, which reinforces your post and made it more revalant to my discussion again but was on a different page. I do appreciate the answers you are giving me and am not trying to be rude.
Looking at your graph yet again, I also see that there does appear to be a very slight cooling trend over the last ~8000 years, and before that a fairly steady temperature rise over about a 4k year period. This is what lead me to ask why the cooling trend had occurred when that chart appears to be showing temperature rise to be expected, and why it is alarming for the temperature rise to resume when it would be expected for the trend to continue until the buildup of the next iceage ~80000 years from now?
Map,
The length of the cycle is 100,000. We reached the interglacial stage about 12,000 years ago (consider it the end of the cycle, or beginning, I'm not sure it matters), and what is known as the Holocene climatic optimum is centered around 7-8,000 years ago, depending on proxies.
https://commons.wikimedia.org/wiki/File:Holocene_Temperature_Variations.png
Plenty of references on that page for data and publications.
Philippe chantreau thank you, that link will answer many of the questions that this discussion would have led me to ask.
This has been interetsing, and explains a lot about the confusion in the general public because of prior missives that CO2-Ice core data were proof of a causive link, when it was more likely a result. NASA covers this in the section on Milankovich theory, but fail to actually split the response from CO2, which is easy to do, since the greenhouse gas response is easily modelled with the equation T=3.2563ln(C)-3.0323, where T is the Earth's average temperature in degC and C is the CO2 concentration in ppm. From the ice cores, the change from 190 to 280ppm yields a contribution of 0.95 degC, so minor compared to the overall change of 7-8 degrees.
typo corrections: Milankovitch; interesting
brneilsen @629,
I'm curious as to the origin of your 'greenhouse gas response' equation T=3.2563ln(C)-3.0323. And if there were any merit in such an equation, I'd be interested to learn how it 'yields' a "0.95 degC" boost to global ice age temperatures resulting from a 190ppm to 280ppm rise in CO2. My abacus (which I would be the first to admit is not always reliable) 'yields' +1.26ºC using this bizarre equation.
The usual calculation of CO2 forcing is ΔF = 5.35 x ln(CO2[1]/CO2[0]) which gives a forcing of +2.07Wm^-2 and a thus 'direct' impact on global temperature of+0.56ºC which would cause climate feedbacks that would perhaps triple this value to +1.7ºC.
The global average temperature rise out of an ice age is usually reckoned at +5ºC to +6ºC so this calculated CO2 forcing would perhaps be responsible for a third of this temperature rise. And this result fits with assessments which find the contributions to deglaciation warming to be roughly 50% surface albedo, 37% GHGs (of which CO2 is the major player) and 13% atmospheric albedo.
I don't have much of a problem with CO2 lagging behind temperature at the end of a glacial period. It isn't all that surprising and the explanations are convincing.
That CO2 still lags behind temperature (though apparently by only a matter of months rather than hundreds of years,"Changes in carbon dioxide content lag those in temperature by five months."[1} is more of a puzzle to me and I havn't seen an explanation for it yet.
I'm sure there is one that wont require denial of recent anthropogenic climate change, but I don't know what it is.
This enquiry arose because I'm teaching using an online resource that includes the following question for students
https://authoring.concord.org/sequences/47/activities/282/pages/1753/3a7c351a-50c0-4646-8824-e2eef8f53762
5. Using Models To Make Predictions
"Why is there a lag between changes in CO2 levels and temperature?
(Hint: Remember that there are many reservoirs for carbon dioxide. Where can carbon dioxide be stored when the temperature is low?)"
I find this question unclear (Do they mean changes in atmospheric CO2, in which case the "hint" doesn't appear to make any sense?) and it implies that CO2 leads temperature change, which wasn't the case in 1990
{1} Kuo, C., Lindberg, C. & Thomson, D. Coherence established between atmospheric carbon dioxide and global temperature. Nature 343, 709–714 (1990). https://doi.org/10.1038/343709a0
[BL] Links activated.
The web software here does not automatically create links. You can do this when posting a comment by selecting the "insert" tab, selecting the text you want to use for the link, and clicking on the icon that looks like a chain link. Add the URL in the dialog box.
Ducked:
The quote/question about time lags is actually on the page following the one you linked to in your first link (reached by clicking "next"). The two pages do not appear to have different URLs, though, so readers will have to navigate to the next page after following the initial link.
The quote about 5 months time lag (from the second link, which only gets me to the abstract) appears to come from a study that looks at the past 30 years of data. The article is paywalled (I might be able to get to it via work), but my guess is that if they are looking at only 30 years of data, then they are looking at monthly or more frequent readings.
Atmospheric CO2 measurements from locations such as Mauna Loa show strong seasonal variation. This short-term variation is driven by different fluxes and reservoirs from long-term changes. This will affect any calculations of time lag, when compared to long-term patterns on the century scale (fossil fuel combustion) or millenial and longer scales (geologic processes). Geological records of temperature and CO2 will not be capable of resolving monthly values, so a 5-month lag in seasonal patterns is not visible.
Ducked @632,
There is indeed a wobble in the MLO CO2 record that matches a preceding wobble in the global temperature record of a few months earlier, both of these wobbles matching an even earlier wobble in ENSO. The actual thing wobbling CO2 is rainfall which promotes/reduces CO2 absorption by the likes of the Amazon rain forest. (See map from this NOAA webpage below.) There is quite a literature covering this phenomenon (eg the likes of HERE or HERE) but be warned - there are a few papers by swivel-eyed denialists lurking within the proper work.
article: CO2 lags temperature - what does it mean? LINK
"This positive feedback is necessary to trigger the shifts between glacials and interglacials as the effect of orbital changes is too weak to cause such variation.
...
While the orbital cycles triggered the initial warming, overall, more than 90% of the glacial-interglacial warming occured after that atmospheric CO2 increase"
Summary:
- Orbital changes alone are too weak to cause such variation.
- 90% of the glacial-interglacial warming occured after that atmospheric CO2 increase
Question: What caused the cooling? Certainly not orbital changes, since they are too weak as pointed out above.
With CO2 causing 90% of the warming and, at the end of the warming trend the atmosphere having very elevated levels of CO2, we should have a runaway warming trend that is unstoppable, but clearly that was not the case as the next ice age approached.
There seems to be a serious logical flaw in the argumentation of that article.
[DB] Shortened and activated link.
Yoshi @635,
I fear you misinterpret the 90% figure. As described by Skakun et al (2012) (& discussed in this SkS post), the 90% is not the percentage of warming coming out of an ice age that is caused by CO2. It is the percentage when increases in CO2 occur prior to increases in global temperature.
The actual post-ice-age warming resulting from increased CO2 is a portion of the GHG warming (which also includes methane). The GHG warming is given as 37% of the total in this CarbonBrief explainer. (The remainder is given as 50% ice albedo & 13% dust & aerosols.) The actual CO2 forcing is about 2.5Wm^-2.
The cooling of the world that leads to a glacial maximum is much slower than the warming of the world that leads to an interglacial. The cooling begins with increased albedo in high northern latitudes as they lose sunlight through the orbital wobbles.
The warming is quicker because it takes less time to melt down an ice sheet than it does to build it up. As with the warming, CO2 reacts to this cooling and increases the effect.
It redirects focus over to like the greater part of the compelling anticipated from a multiplying of CO2 ought to have as of now occured except that is unrepresented. For this reason, assuming there was a space. Without it, however, input numbers or moderately.
Welcome to Skeptical Science, Fya.
It is difficult to know what you are responding to here. It helps if you refer to the comment number, or the portion of the post you are responding to.
The time lag between CO2 and temperature is due to the time offset between warming oceans and continued ocean CO2 emissions. with this cumulative effect Carbon dioxide, therefore it will becomes the main driver of temperature during glacial and interglacial warming. Shakun et al 2012 paper showed that warming was indeed triggered by the Milankovitch cycles and that a small amount of orbital cycle-caused warming eventually triggered the CO2 release, which caused most of the glacial-interglacial warming. So while CO2 did lag behind a small initial temperature change, it led and was the primary driver behind most of the glacial-interglacial warming. According to the Shakun data, approximately 7% of the overall glacial-interglacial global temperature increase occurred before the CO2 rise, whereas 93% of the global warming followed the CO2 increase.
Figure 2a in the Shakun paper seems to confirm that the very minor warming due to higher CO2 after the peak temperature is reached following deglaciation is substantially smaller than the effects of the Milankovitch cycles, which clearly dominate earth's climate. Is that not apparent from the graph?
The other thing apparent from that graph is that temperature climb rate early in the post-glacial period seriously flattens at the peak. That seems to imply a variation in sensitivity that is not mentioned in the Shakun paper. If that were not the case, the temperature would continue to climb at the faster rate.
Please note: the basic version of this rebuttal has been updated on Feb 14, 2023 and now includes an "at a glance“ section at the top. To learn more about these updates and how you can help with evaluating their effectiveness, please check out the accompanying blog post @
https://sks.to/at-a-glance
Thanks - the Skeptical Science Team.
Thank you for your excellent website and all the valuable information. I found this FAQ on CO2 lagging temperature very helpful. I found a copy of the Lorius et al. (1990) paper in Nature and it is great.
Pardon me if this has been said before in the may posts, but I could not see the direct quote that you present in the paper. The sentiments are definitley there and reflect the findings in the Lorius et al. paper, but not in those exact words. Perhaps the direct quote you have included comes from a different paper. It seems more like a commentary on the paper.
Thank you again.
Terry2 @ 64:
Are you referring to the quote directly under the "Climate Myth" label? That is not a quote from the Science article - it is a quote from U.S. Rep Joe Barton. You can find the exact quote if you follow the "Full Statement" link immediately below the quote. It's Joe's interpretation of what he read (hopefully - he might just be repeating what someone else said) in the Science paper.
Hi SS. You have a graph showing the relation between Co2 and Temperature going back 400,000 years, but I'm wondering if you can insert the one that goes back 800,000 years?
Ron @ 645:
Although the Basic tab shows a Vostok ice core that only covers 400,000 years (the limit available at that station, according to Wikipedia), the Intermediate tab of this article includes another station (Dome C) with an 800,000-year record. Is that the graph you are thinking of?
https://skepticalscience.com/co2-lags-temperature-intermediate.htm
P.S. The preferred abbreviation for Skeptical Science is SkS. Three guesses for why. (First two guesses don't count.)
Hi Bob. SkS (SkepticalScience?) ;) Yes, I guess that SS has some bad connotations to it. Sorry.
There seem to be a lot of graphs out there. Like this one one, or this one. I was thinking of something closer together like this one.
Was there a graph included with the 800,000 yr study? Just want an easy to compare and valid one that I can use.
Ron @ 648:
I am not sure exactly what you are looking for, or what you want to compare. The post here (check out all three of the basic, intermediate, and advanced tabs, plus the extra information that is posted below the comments) talks about some of the complexities of comparing ice core CO2 data to temperature. There is also a good post here at SkS about ice core data.
Ice core "temperature" is not global - it's more local or regional, as it is based on oxygen isotope ratios in the core. This is affected by the temperature at which the precipitation is formed. See this page or this page for more details. When comparing CO2 and temperature, careful consideration of the source of temperature data is needed in order to assess the meaning of the comparison. In addition, estimating age in ice cores involves complexities of glacial flow, how long it takes gas to get trapped, etc.
The figures you link to do not mention the data sources used. The OP here lists some data sources, but unfortunately it looks like some of the links are broken. A quick search finds sources for Dome C data here and here. Those pages include links to other pages, graphs, and original studies. Depending on just what sort of comparison you are trying to do (especially if it is statistical), you may be best off finding original data and making your own graph. At least then you know exactly what data you are getting.
The Intermediate tab here also has a section pointing out that later studies have revised some of the timing interpretations of the ice core data. Read down to section 4 "This myth is based on old data".
Bob Loblaw @649,
The third of the graphics linked-to by Ron @647 (below) is sourced here and does have referenced sources.