


 Arguments


What does past climate change tell us about global warming?
What the science says...
| Select a level... |
 Basic
Basic
|
 Intermediate
| |||
|
Greenhouse gasses, principally CO2, have controlled most ancient climate changes. This time around humans are the cause, mainly by our CO2 emissions. |
|||||
Climate Myth...
Climate's changed before
Climate is always changing. We have had ice ages and warmer periods when alligators were found in Spitzbergen. Ice ages have occurred in a hundred thousand year cycle for the last 700 thousand years, and there have been previous periods that appear to have been warmer than the present despite CO2 levels being lower than they are now. More recently, we have had the medieval warm period and the little ice age. (Richard Lindzen)
At a glance
Just imagine for a moment. You fancy having a picnic tomorrow, or you're a farmer needing a dry day to harvest a ripe crop. So naturally, you tune in for a weather-forecast. But what you get is:
“Here is the weather forecast. There will be weather today and tomorrow. Good morning.”
That's a fat lot of use, isn't it? The same applies to, “the climate's changed before”. It's a useless statement. Why? Because it omits details. It doesn't tell you what happened.
Climate has indeed changed in the past with various impacts depending on the speed and type of that change. Such results have included everything from slow changes to ecosystems over millions of years - through to sudden mass-extinctions. Rapid climate change, of the type we're causing through our enormous carbon dioxide emissions, falls into the very dangerous camp. That's because the faster the change, the harder it is for nature to cope. We are part of nature so if it goes down, it takes us with it.
So anyone who dismissively tells you, “the climate has always changed”, either does not know what they are talking about or they are deliberately trying to mislead you.
Please use this form to provide feedback about this new "At a glance" section. Read a more technical version below or dig deeper via the tabs above!
Further Details
Past changes in climate, for which hard evidence is preserved throughout the geological record, have had a number of drivers usually acting in combination. Plate tectonics and volcanism, perturbations in Earth's slow carbon cycle and cyclic changes in Earth's orbit have all played their part. The orbital changes, described by the Milankovitch Cycles, are sufficient to initiate the flips from glacials (when ice-sheets spread over much of Northern Europe and the North American continent) to interglacials (conditions like the past few thousand years) and back – but only with assistance from other climate feedbacks.
The key driver that forces the climate from Hothouse to Icehouse and back is instead the slow carbon cycle. The slow carbon cycle can be regarded as Earth's thermostat. It involves the movement of carbon between vast geological reservoirs and Earth's atmosphere. Reservoirs include the fossil fuels (coal/oil/gas) and limestone (made up of calcium carbonate). They can store the carbon safely over tens of millions of years or more. But such storage systems can be disturbed.
Carbon can be released from such geological reservoirs by a variety of processes. If rocks are uplifted to form mountain ranges, erosion occurs and the rocks are broken down. Metamorphism – changes inflicted on rocks due to high temperatures and pressures – causes some minerals to chemically break down. New minerals are formed but the carbon may be released. Plate tectonic movements are also associated with volcanism that releases carbon from deep inside Earth's mantle. Today it is estimated by the U.S. Geological Survey that the world's volcanoes release between 180 and 440 million tonnes of carbon dioxide per year - as opposed to the ~35 billion tonnes we release.
Epic carbon releases in the geological past
An extreme carbon-releasing mechanism can occur when magma invades a sedimentary basin containing extensive deposits of fossil fuels. Fortunately, this is an infrequent phenomenon. But it has nevertheless happened at times, including an episode 250 million years ago at the end of the Permian Period. In what is now known as Siberia, a vast volcanic plumbing-system became established, within a large sedimentary basin. Strata spanning hundreds of millions of years filled that basin, including many large coal, oil, gas and salt deposits. The copious rising magma encountered these deposits and quite literally cooked them (fig. 1).
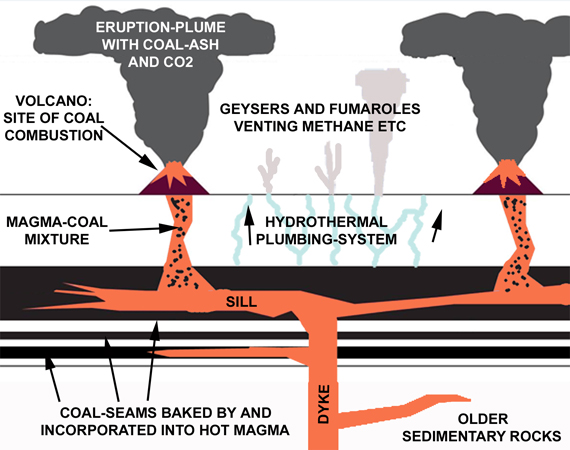
Fig. 1: schematic cross section though just a part of the Siberian Traps Large Igneous Province, showing what science has determined was going on back then, at the end of the Permian Period.
Now laden with a heavy payload of gases, boiled out of the fossil fuel deposits, some of the magma carried on up to the surface to be erupted on a massive scale. The eruptions – volcanism on a scale Mankind has never witnessed - produced lavas that cover an area hundreds of kilometres across. Known as the Siberian Traps, because of the distinctive stepped landforms produced by the multiple flows, it has been calculated that the eruptions produced at least three million cubic kilometres of volcanic products. Just for a moment think of Mount St Helens and its cataclysmic May 1980 eruption, captured on film. How many cubic kilometres with that one? Less than ten.
Recently, geologists working in this part of Siberia have found and documented numerous masses of part-combusted coal entrapped in the lavas (Elkins-Tanton et al. 2020; fig. 2). In the same district are abundant mineral deposits formed in large pipes of shattered rock as the boiling waters and gases were driven upwards by the heat from the magma.
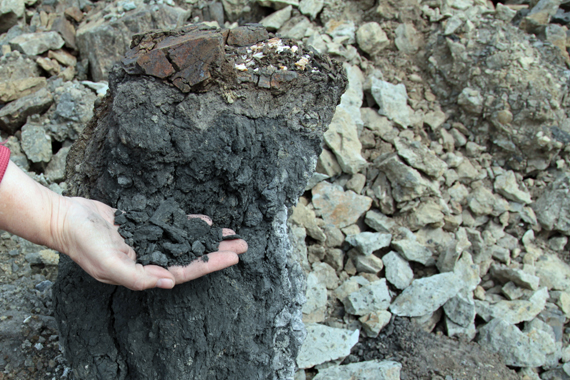
Fig. 2: an end-Permian smoking gun? One of countless masses of part-combusted coal enclosed by basalt of the Siberian Traps. Photo: Scott Simper, courtesy of Lindy Elkins-Tanton.
It has been calculated that as a consequence of the Siberian Traps eruptions, between ten trillion and one hundred trillion tons of carbon dioxide were released to the atmosphere over just a few tens of thousands of years. The estimated CO2 emission-rate ranges between 500 and 5000 billion tonnes per century. Pollution from the Siberian Traps eruptions caused rapid global warming and the greatest mass-extinction in the fossil record (Burgess et al, 2017). There are multiple lines of hard geological evidence to support that statement.
We simply break into those ancient carbon reservoirs via opencast or underground mines and oil/gas wells. Through such infrastructure, the ancient carbon is extracted and burned. At what rate? Our current carbon dioxide emissions are not dissimilar to the estimated range for the Siberian Traps eruptions, at more than 3,000 billion tons per century. The warning could not be more clear. Those telling you the climate's changed before are omitting the critical bit – the details. And when you look at the details, it's not always a pretty sight.
Last updated on 14 February 2023 by John Mason. View Archives


DSL,
Thank you for direction where to get more information on CO2 lag.
If we accept scientific measurements of samples done by reputable institutions and their findings for the last 5000 years, CO2 level in the atmosphere was between 250 – 280 ppm, except in last 50 years, when it raised to recent level. With CO2 stable as measured, for the past 5000 years it would be reasonable to have stable temperatures for the same period if CO2 was key factor. Measured temperature varied in last 5000 years much more with stable CO2 level, than it changed recently with CO2 gone considerably higher. There are Greenland Ice core findings and Vostok Ice core findings proving much more dynamic changes in temperature than change in CO2 in atmosphere.
Look through tables:
Historical Isotopic Temperature Record from the Vostok Ice Core
http://cdiac.esd.ornl.gov/trends/temp/vostok/jouz_tem.htm
temperature varied from 1.97 below mean and 1.33 above mean. More than 3 degrees for CO2 variation of roughly 30 ppm.
Temperature in central Greenland
LINK
Temperature varies from -32.18 to -28.75 – about the same as for Vostok, more than 3 degrees for the same change in CO2 content. (30 ppm)
CO2 content of almost 400 ppm should cause considerable temperature change if it is major factor, measured temperature increase does not reflect that.
[PS] Fixed links. Please use the link button in future to create therese. It would appear that either you havent read the intermediate version of article or you havent understood it. CO2 is not the only influence of climate and no scientist says that it is. Only that it is the main factor behind current warming. Also do not confuse global average temperature variation with local temperature variation.
[RH] Shortened link that was breaking page formatting.
Thanks for links - I wondered why it doesnt make them clickable. Just curious about CO2 influence, how much it really does influence climate, as there are no links to GW.
Just to correct previous statement 'there are no links to GW' there is some influence, but not significant one
[PS] Please read carefully the 3 tabs in "CO2 causing warming" and also perhaps this one. You cannot infer significance of CO2 from your presentation to date. It is logically equivalent to statement "Wildfires occur naturally therefore arson cant happen". You must consider all forcings in making inferences from past climate change.
Thank you, CO2 significance in GW
With CO2 measurements of almost 400 ppm, the recent global temperature measurements somehow do not reflect publicity given to CO2. I am trying to understand how something that is measured in ppm can make such a significant change in global temperature. At the same time, water vapor, which is present in thousand time higher concentration, is not being mentioned at all. There are dry areas on earth, trade winds carrying enormus quantity of water vapor, global circulation, ocean currents (gulf stream) all more influential than CO2 but CO2 somehow has the publicity.
Maybe this is because it can be taxed, or maybe because we can't influence any other factor. Regardless, trying to prove that in the present atmosphere the CO2 at 400 ppm influences the GW and WV at 40% is not mentioned at all, somehow does not work. Our planet has a stable pattern in climate changes for millions of years with CO2 either higher or lower than now; many spices appeared and disappeared, what one has to consider natural, as if not, we as recent planet product wouldn't even come to existence.
[PS] Please check your politics at the door and stick to science. Your comment about water vapour are pure sloganeering - the role of water vapour is in an integral part of science. Take the time to read what the IPCC WG1 actually says before trying to be dismissive. Just because you dont understand something doesnt mean that science doesnt either.
NN1953VAN-CA @504, water vapour is mentioned all the time in discussing climate, as the water vapour feedback. That is because, if you suddenly doubled the amount of water vapour in the atmosphere what would happen is that over a few weeks at most, the excess water vapour would precipitate out resulting in a WV concentration similar to current values. Likewise, if you suddenly halved the WV in the atmosphere, over a few weeks at most the WV would be replenished by evaporation. The upshot is that the only effective means to change the WV concentration of the atmosphere over the long term is to change the temperature.
In contrast CO2 concentrations are far more amenable to alteration over the short term. Indeed, for periods of time less than a few hundred years, changes in CO2 concentration are an almost direct function of emissions. Consequently, be emitting CO2 we have a small effect on temperture which is reinforced by the effect of that temperature change on the water vapour concentration. Doing the reverse, however, would not work.
Finally, as an aside, concentration alone is not a good way to judge the relative effect on the total greenhouse effect of a gas. CO2 may only have one fiftieth of the concentration of WV in the atmosphere, but it has 25% of the effect on the total greenhouse effect.
[PS] Any further discussion of water vapour should go to "Water vapour is the most powerful GHG".
responding to moderator,
In my comment NN1953VAN-CA @504 I was not being dismissive and I do understand nature around me.
There is no politics in my comment, unless … mentioning that CO2 is taxable??
I was trying to point out proportions in atmosphere content and emphasize proportional influence.
Somehow present content of CO2 concentration in the atmosphere does not produce mathematical models calculated temperature raise. That is point and lacks reasonable explanation.
IPCC prediction quote:
The average predicted temperature increase over the next 100 years is around 3 degrees centigrade
Looking at previous measurements – Antarctic or Greenland Ice core – Global temperature, recently (300 – 400 years ago) varied within 3 degrees in span of 200 years without significant CO2 change.
[JH] Please document the sources for the assertions that you have made.
[PS] Yes, your comment on tax was a completely political insertion. And your last sentence would certainly be dismissive hand-waving to me. Furthermore, your comments so far contradict your assertion "I do understand nature around me." For instance the comment "Looking at previous measurements – Antarctic or Greenland Ice core – Global temperature, recently (300 – 400 years ago) varied within 3 degrees in span of 200 years without significant CO2 change." only makes any sense if you somehow believed that science asserts that only CO2 can change the global temperature. It does not (eg see here) as both the above article and the pointers I provided indicate. Furthermore you continue to conflate local temperatures with global. A better way to assess climate sensitivity from glacial cycle (using all forcings), is discussed here (note Fig3)
JH inline @506, NN1953VAN-CA previously linked to the data Alley et al (2000), ie, GISP2, and Petit et al (1999), ie, Vostok, as the data justifying the claim. However, he clearly misrepresents it. Specifically, he claims temperature variations of 3 degrees for Vostok, GISP2 and global temperature series within the last 300-400 years. Vostok shows a maximum 0.36 and minimum -1.84 variation from the most recent value after 1600 AD, giving a maximum variation over that period of 2.2 C. GISP2 shows a maximum variation from the most recent value of 0 C and a minimum -0.4985 C over the same period, giving a maximum temperature variation of 0.5 C. The average** of the two shows a maximum 0 C and minimum -1.1412 C, giving a maximum variation of 1.14 C.
Of course, had he said 500 years, he would have shown a 3.17 C decline in temperature between 1553 and 1716 (163 years) for Vostok, but still not for GISP2 or the average value.
That is, of course, irrelevant as you know. Both GISP2 and Vostok are regional temperature indices, and regional temperature fluctuations are expected to be much larger than global temperature fluctuations. That is particularly true at the poles, where we expect higher value fluctuations than at the equator. If we expand the number of proxies to just eight, any notion of large scale global temperature fluctuations over a short the centenial scale in the holocene is clearly unwarranted:
Note, the eight temperature series include both Vostok and Gisp2. As this is very well known, the question for NN1953VAN-CA is, why are they excluding data to make plausible a clearly falsified claim?
** Average taken by infilling a value for all dates by persistence within each data series, then taking the mean at each date.
[JH] Thank you for the clarification.
Response to moderator
Reference are Ice core tables:
Vostok
Greenland
Historical Isotopic Temperature Record from the Vostok Ice Core
Deuterium
Age of content Temperature
Depth the ice of the ice Variation
(m) (yr BP) (delta D) (deg C)
0 0 -438.0 0.00
1 17 -438.0 0.00
2 35 -438.0 0.00
3 53 -438.0 0.00
4 72 -438.0 0.00
5 91 -438.0 0.00
6 110 -438.0 0.00
7 129 -438.0 0.00
8 149 -442.9 -0.81
9 170 -437.9 0.02
10 190 -435.8 0.36
11 211 -443.7 -0.95
12 234 -449.1 -1.84
13 258 -444.6 -1.09
14 281 -442.5 -0.75
15 304 -439.3 -0.22
16 327 -440.9 -0.48
17 351 -442.5 -0.75
18 375 -436.6 0.23
19 397 -430.0 1.33
temperature variation from -1.84 at year 234 BP
to 1.33 at year 397 BP
temperature variation 3.17 time 163 years
for Grenland ice core measurements temperature/ time variation takes longer, it is some 2K years for 3 degrees in temperature difference.
The only reason I reference those two is that there temperature difference is the smallest at those points. Global temperature was different but variation may have been close to those changes.
Sorry if my sentence:
'I do understand nature around me' sounded dismissive as to reply to your statement:
'Just because you don’t understand something doesn’t mean that science doesn’t either.'
your opinion on my understanding.
I was not intended to be dismissive, just stating that I do look around and look for reasons beyond.
Why I mentioned C02 content as stable, for long period of time is to question statements that with present C02 content, GT is expected to be higher, and it is not.
There are other factors as Milankovitch’s cycles, dust in the atmosphere as of volcanic activity or due to meteor hitting the earth, proportion variation in sea/land as at ice age or warm periods. etc
I was not dismissing all other factors which are affecting GT change.
Present C02 concentration in the atmosphere is not reflecting GHG theory and that is what I was trying to express.
[PS] In the role of moderator, my intention is provide guidance on what is acceptable on this site in terms of comments policy, constructive argument, and also to point to appropriate source material that should be considered. Please respond to the points made by other commentators that have addressed your argument directly. You would make discussion of your case against 'GHG theory' better if you did the following:
1/ Outline your understanding of what science predicts. References to at least the IPCC if not primary literature preferred for this prediction.
2/ Present the observations that you think contradict that prediction.
As it stands at the moment, we believe you are mistaken about what GHG predicts and mistaken in your interpretation of ice-core observations. A clearer statement would both will help clear confusion.
NN1953VAN-CA @508.
Your observation that there have been large variations in temperature as reconstructed by the Vostock ice core data does not contradict "GHG theory". You point to a 3.17°C variation over the 163 year period 397-234ybp within that Vostock data. And if you examine the GISP2 data, there are variations of a similar scale, for instance a 3.7°C variation over a 393 year period.
As Tom Curtis @507 pointed out, a single location will show greater variation in temperature than will a global average. And the poles will be the places where such local variations are expected to be the greatest. Also mentioned @507, the graph shown @507 does contain the Vostock and GISP2 data but the data are strongly smoothed so only longer-lasting wobbles will appear at full size.
Sadly the different shades of blue used in the graph @507 are not particularly clear. In the graph, Vostock is one of the two dark blue traces. Your -3.17°C variation being a very sudden variation (the preceeding 155 years show a +2.9°C variation and the following 44 years a +2.2°C variation), it is dramatically smoothed out in the graph and appears as a dip of -0.2°C. GISP2 is one of the light blue traces and for the most recent millenium it is the bottom trace on the graph. The GISP2 data contains variations that are far less sudden than with Vostock so less of the GISP2 wobbles are smoothed out.
But let us here use the un-smoothed data as provided. While the period 397-234ybp show a -3.17°C variation at Vostock, the GISP2 data over the same period shows a maximum variation of just -0.15°C. If we take just these two temperature records as a very crude global average, we get a variation of -1.66°C. Add in further variations from elsewhere in the globe (which even if of the same sign we would expect to be yet smaller) and the Vostock data becomes less prominent still. Simply, the Vostock variations are not at all a good representation of global average temperature variations over the time periods you are examining.
And to repeat this exercise for the biggest GISP2 variation, the +3.7°C variation over the 393 year period 8210-7817ypb. This appears strongly on the graph @507 as a +2.5°C variation. Over this full period 8210-7817ybp period the Vostock temperature ends at a similar temperature to the period start. Thus the two records average out as a +1.35°C variation and again would be diluted further when more temperature records are included. There is a complication with this data as the 8210-7817ybp period does include a 2.9°C Vostock deviation during part of the the 393 year period. When Vostock & GISP2 are average out, that deviation reduces to +2.2°C variation over a 91 year period. This is by far the most dramatic variation for an average of Vostock & GISP2 over the 10,000 years. Add in more data to get a better global average and it will certainly flatten out but probably still be visible. In the graph @207, this period shows a +0.4°C variation despite the smoothing, but in this 8-series global average the polar regions are grossly over-represented. (If Vostock & GISP2 were taken as representing respectively the whole antarctic & arctic, that would be only 7.5% of the globe.)
Thus we can conclude that over the last 10,000 years when CO2 has been comparatively unchanging, there have been only small wobbles in global average temperature, as the graph @507 crudely demonstrates. Yet, as "GHG theory" predicts, now that CO2 is increasing there will be (and indeed is) a much larger increase in that global average temperature.
Few centuries or even millennia observation may not give real trend in global climate, as there were abrupt changes after long steady trend. My point is that CO2 does not affect climate change in measure some are trying to prove.
Looking at Atmospheric CO2 content in time span of several centuries:
CO2 stable for several thousand years at 250 – 280 ppm
Vostok and Gereenland are the places with least temperature change expected. (I am aware it’s not global). When mentioned ‘least temperature change’ at any time and for any given period temperature variation day/night on equator or seasonal on mid latitudes varies much more than on polar regions, again, averages do not change much on either.
Vostok temperature varied 3 degrees with CO2 content stable, and in last 60 years with CO2 gone to 400 ppm (looking at 280 ppm it is 40% increase) temperature is stable. Please see table.
Vostok station
Vostok surface temp&p=Surface%20air%20temperature%20(C))
This is recent average surface temperature at Vostok – there is lack of data for 1962,1964, 1996, and 2004 other than that there is no temperature increase.
Next graphs are for Greenland:
Please check top graph – right side from 1950 to 20xx
Atmospheric CO2 gradually raised to 400 and at same time span Greenland temp. varries, but doesn’t follow CO2 trend.
Global temperature reconstruction done by Loehle, 2007 and Loehle and McCulloch, 2008 studies
Average temperature change from +0.5 to -0.8, does not follow CO2 content which is stable until 1950.
Yes, there are other forcing but somehow all other forcing are overcoming CO2 is at present level as there should be much greater GT change for 40% CO2 increase. If so, which other forcing works now and was not present when CO2 was stable and temperature rose. Because if ‘other forcing’ are preventing temperature raise, it means CO2 GHG effect is not that great as GHG theory is trying to show.
Recent GT should reflect higher upward trend if CO2 is 25% of GHG effect, and risen for 40%.
Beside, GW is not that bad, there are parts of the world which would greatly benefit from some temperature raise, e.g. great part of north hemisphere presently uninhabitable is going to be much more humans friendly. Of course there are just as many parts of planet which will become uninhabitable or under the sea. It will get back on it's own as it has times before.
NN1953VAN, you seem "stuck" on Vostok. Taking far too much stock of Vostok, so to speak :-)
As Tom Curtis has said, that's a regional record. And you seem to be concentrating on one or two regional trees . . . and you are ignoring the forest of evidence which torpedoes the case you are trying to argue.
In addition, you are wrong in your total assessment (of total human agriculture etcetera) of the outcome of present day global warming ~ please see: under the thread of "It's Not Bad", and elsewhere ~ how world agricutural output will reduce as surface temperatures rise further. [ If you care to educate yourself on the matter, then you will find multiple reasons for that deterioration. ]
And you should also "factor in" some extensive political and social disruptions from mass migration of "climate refugees" . . . and here, if you think today's Europe is managing poorly the influx of refugees . . . well, you (and Europe) ain't seen nuthin' yet ! Yes, Canada's and Russia's soils will benefit somewhat from higher temperatures ~ but those countries won't enjoy the accompanying socio-political burdens.
Will the world [in your words] "get back on it's own as it has many times before"? . . . well indeed, it might well do so in 10,000 or 100,000 years. But to be relaxed about that (distant) prospect, is like being relaxed about the deaths and miseries of World War II . . . which count as a pinprick [by your line of argument] because that war was insignificant in length ~ a mere 6 years [1939-1945]. Yet that is the view you seem to be pushing.
NN1953VAN-CA @510.
I assume you mean to say that the poles vary the more and not "with least temperature change". Similarly, individual locations will vary more than a global mean. (You cite the 1.7°C wobbles of the 2,000 year Loehle & McCulloch (2008) temperature reconstruction. The individual proxy data varies by 7.5°C.)
The graph you present of recent met. measurements at Vostok shows a trend (or lack of trend) for temperature not for temperature anomaly. If you examine the other graphs available on the site (you link to @510), you will see the individual months (which do not require converting into anomalies) show significant trends in temperature. The annual average data (again which doesn't need converting into an anomaly) gives a trend of 0.017ºC/y. This is not large compared with the global average but no single point on the globe can be expected to behave as the global average does. Do examine that "spaghettigram" of data used in Loehle & McCulloch (2008).
Perhaps the most important point you miss is that the Loehe & McCulloch (2008) graph you present only shows data to 1935. The 'decline' prevents the use of more recent proxy data. If you then splice on, say, GISTEMPS data, the reconstruction would sit at +0.825ºC using 10-year rolling averages (and +0.98ºC using rolling 12-month averages). This rise, unprecidented in the rest of the reconstruction, is AGW.
Your calculation of the effect of CO2 forcings on global temperatures is far too crude. A 40% increase in CO2 should eventually increase global temperture by roughly 1.2ºC after the forcing has been balanced by temperature, something which is a long way off as the CO2 has been present only a short time. (Also, it is not just CO2 that is resulting in AGW.)
Discussion of the benign climatic results of AGW that will indeed be evident in some parts of the world are off-topic here. However, as you are happy to make some places less habitable for many millenia, perhaps you should invite a few Nigerians, Indians Indonesians etc (who even now are suffering from elevated temperatures in an already hot climate) to come and live with you. I would go further than Eclectic @511. The view "you are pushing" is denying something potentially far far worse than WWII.
MA Rodger @512, NN1953VAN-CA actually cites a 1.3 C temperature variation (from -0.8 to +0.5 C). Even that is incorrect, however. The actual temperature range for the mean value is -0.6 to 0.56 C, for a 1.16 C temperature range.
Even that is exagerated taken as a global value. That is because, of 18 proxies used, Loehle and McCulloch use 12 from the NH extratropics, 4 from the tropics, and 2 from the SH extratropics. As they take a simple mean of the proxies, they tacitly assume that 66.7% of the Earths Surface is in the NH extratropics, 22.2% in the tropics, and just 11.1% in the SH extratropics. The real values are 30.11% NH extratropics, 39.78% tropics, and 30.11% extratropics. Even within zones, the data is heavilly biased, with 8 of the 12 NH extratropical proxies coming from the North Atlantic Region (Europe and North America) and the rest from China, the tropical proxies coming from Indonesia and Africa, with South America excluded, and all SH proxies coming from Africa.
These biases matter. The NH varies more in temperature because of the greater percentage of land in the NH. The North Atlantic is known to be the region of greatest and most persistent temperature change due to the so called Medieval Warm Period. So not only are the proxies heavilly biased in coverage, the are biased in favour of areas known to have greater temperature variation before the proxies were chosen.
That bias extends to the fact that only 8 of 18 proxies (44.4%) are for SST, despite 70.8% of the surface being ocean. This strong terrestial bias again distorts the result given that temperature changes over land are greater than those at sea. (Odd how every bias in the data exagerates temperature variability.) Unfortunately, SST proxies are limited in number, and this particular bias is not atypical of paleo temperature reconstructions. That, however, means in turn that although error bars tend to be shown as symetrical for such reconstructions, in fact the reconstructions are more likely to exagerate variability than supress it.
[PS] I note that NN1953VAN-CA is using the badly flawed reconstruction of Loehle, (published in the "tobacco science of climate" journal E&E) rather than something like Ljungqvist 2010 from the peer-reviewed literature.
Tom Curtis @513.
Indeed. The 1.7°C was a mistake that dodged being edited.
My own take on the spread of data in the Loehle & McCulloch (2008) reconstruction was that almost 60% of it is either North Atlantic or close by there. I did half think that representative thermometer records could be sourced from the GISTEMP or BEST websites as both have 'clicky' maps that yield the nearby stations. That would then allow some attempt of comparing oranges with oranges. Then I reasoned, the strong 1930s warming in the US & Arctic Atlantic will probably prevent the extra warming since 1935 shooting too far off the graph. Thus my choice of global GISTEMP to bring the reconstruction up-to-date.
MA Rodger @514, yeah. Finding an appropriate 20th century instrumental record for comparison can be tricky. In this graph, from the IPCC AR5 (Fig 5.7), they use respectively, HadCRUT4 NH and HadCRUT4 extratropics (30 N plus), HadCRUT4 SH, and HadCRUT4 Global for each each of the three appropriate panels. For what it is worth, the pre-twentieth century global temperature range is 0.8 C for Man EIV 08 (the reconstruction with the largest range. That compares to a peak range of 2.02 C in the upper panel (NH) spaghetti graph. That, however, is for a NH extratropics (30-90), land only reconstruction by Christiansen and Lungqvist (2012). Both the latitude range and land only features would again exagerate temperature variability if the reconstruction were misinterpretted as a global reconstruction.
PAGES 2000 show a 0.6 C variation for global temperatures using 30 year bins. That later feature will supress the full range of variability, but the result is consistent with Mann 08.
Given this, and that the temperature range from 1880-1910 to current is about 1 C, it is evident that 20th century plus temperatures have already exceded the maximum range of global temperature variation in the 1900 years pre 1900 AD, and by about 20-25%. Further, it has done so in just over a century, whereas the maximum temperature range pre 1900 (for the last 2 K years) is spaced by about 400-600 years.
It might help to quote some reliable sources from an earlier period before climate change became a political issue. For example: was rapid temperature change thought to be a or the cause of mass extinctions in the 80's or 90's?
i didnt find any appropriate section where to post this, so i try my luck here.
i recently attended an speach on agronomy and soil death where the INRA ingenieur bourguignon claude mentioned the cooling effect of forest and the influence of roman deforestation on mediteranean climate. Intrigued i tried to find any studies on global warming impact of deforestation but almost everything is focusing on CO2. I managed to find something here : http://www.nature.com/ncomms/2015/150325/ncomms7603/full/ncomms7603.html
but nothing on this website. So i guess my comment is how come there is almost no study on the possible role of the massive deforestation and the warming of the 20th century.
[JH] If you enter the word "deforestation" into this site's search box and click "Go", you will find a plethora of articles that address deforestation in some manner.
Tom: That PAGES reconstruction contains consecutive dots that differ by up to 0.3C. Does that mean that during that time, temps rose/fell by as much as .1C/dec? for ~30 years, or is that an issue of precision?
I usually offer deniers an analogy with forest fires.
Forest fires are often caused by lightning, a natural cause.
Does that mean that forest fires are ONLY caused by nature? Of course not. [Smokey the Bear has been telling us that for years.]
Forgive me if that's old and familiar to you.
I appreciate your website, it's excellent.
Climate has changed before!? Wow! Thank goodness someone realized this. I'm so relieved now. Let's just tell all of the scores of science academies, thousands of climatologists, economists, governments, health care organizations, militaries, and insurance companies that they don't have to worry any more. I'm surprised that none of them knew this already, that climate has changed before. I'm sure they will be as happy as I am to hear that this isn't a problem because climate has changed before.
Seriously, I can't believe people like Marco Rubio are still spewing this nonsense. All of the vast majority of climate scientists that accept the fact of anthropogenic global warming already know that climate has changed in the past, and they are still extremely concerned about our GHG emmissions. The 97% must be wrong, or involved in a giant hoax.
If past global warmings have been caused mainly by CO2, and it has caused temperatures higher than the present, then how did temperatures come back down and even into an ice age later? There were no animals trying to reduce CO2 emissions back then? That means CO2 emission came back down for some natural caused reason. Does that mean CO2 would also come back down naturally after a period of time after the present warming?
[PS] Please read the intermediate version of this article. Climate has changed before for many reasons but in these changes, GHGs operate as amplifiers. Over very long time periods earth has a crude "thermostat" in rock weathering (releasing Ca). See here in particular for details and also here and in referenced papers for more. Also, see Mathews and Weaver for how fast temperatures could change under zero emissions etc.
Mammals have the ability to adjust to warmmer weather. We have built in systems to help us reduce body heat. Sweating. Reptiles also will not be harmed by warmer weather. Reptiles cannot adjust their body temperature, they can only use the environment. If it gets warmer, they can easily stay in the water, or under shade, which is what they have been known to do. Colder weather in contrast is the main reptillian killer. There is no simple way like going under a shade or jumping into the water to elevate their body heat. When it's cold, it's cold, and it's cold everywhere.
[PS] This is extremely simplistic description but I am not sure what point you are trying to make? In what way is your comment relevant to this topic? Are you contesting the evidence in the fossil record that sudden increases in temperature also correspond with mass extinctions?
CO2 levels long long ago have been over 5000 parts per million, while at the present they are a mere 300. And yet when the CO2 levels were 5000 ppm, the earth was in an ice age. Sure, CO2 isn't the only driver of climate change. But that just reflects what little change CO2 can make to temperatures. Can you tell me, why there was an ice age back then? Have you fully investigated the other driver of climate change? How do you know that other driver is not also playing a part in the current warming? Does that mean even if current CO2 levels were to rise to 5000 ppm, it wouldn't have a significant impact on our climate? When CO2 levels were high in the past(there were also plenty of small fluctuations), WHAT caused them to drop back down? Climate scientist have poured all of their research into what CO2 does to the climate, but what about the other driver?
[PS] Please see the "CO2 was higher in the past" article and comment there if unclear. I have already pointed you to the article (on weathering) about what caused reduction in CO2 in past. The Search box on the top left or the Arguments, Taxonomy of the menu bar are a good way to find information about these common myths. And before you make assumptions about what climate scientists have and have not studied, I strongly suggest you look at the IPCC WG1 report.
Is a 4% less solar irradiance than the present enough to level out and invert the effects of a dozen times the amount of carbon dioxide than the present? Please affirm if these are true:
the carbon ppm back then was over 5000
the carbon ppm now is around 350
the solar irradiation now is around 1365.4 watts per square meter, therefore back then it was 1310.8
Under these conditions:
over 5000 carbon ppm + 1310.8 w/m³= ice age temperatures
350 carbon ppm + 1365.4w/m³=16ish degrees
Doesn't this reflect the insignificance of carbon levels?
We can all easily see how much solar irradiance affects the earths temperature. Just compare the temperature at night with the temperature in the day. Thats how much sunlight can change temperatures.
According to your articles, if we increase CO2 levels in the air by 3 times now, a sudden 1% decrease in solar irradiance will plunge us into another ice age? That is to say, the temperature difference made by 300% increase of CO2 is dwarfed by the temperature difference made by a 1% increase in solar irradiation?
Doodad @524, using the standard formula, top of atmosphere insolation 400 million years ago was 96.6% of the current value of 1360 W/m2. However, that is the insolation per meter squared prior to the effect of albedo, and for an area perpendicular to the Sun's rays. The Earth is effectively a sphere so that only a small part of it is perpendicular to the Sun's rays at any time, and half of it is in darkness at any time. Averaged over the Earth's surface, that means the incoming sunlight is one fourth of the top of atmosphere insolation. (The difference is just the ratio between the area of a circle perpendicular to the Sun's rays and just large enough to cast the Earth entirely in shadow, and the area of the Earth, ie, the ratio of πR2 to 4πR2, where R is the radius of the Earth.) Further, the Earth's albedo of 0.3 means 30% of sunlight is reflected to space and does not contribute to warming the Earth. Therefore the average sunlight that warms the surface amounts to (Top of atmosphere TSI * (1 - albedo))/4, or 238 W/m2.
Assuming the same albedo, that means the average sunlight warming the Earth's surface 400 million years ago amounted to 229.95 W/m2.
Four hundred million years ago, there was approximately 4000 ppmv of CO2 in the atmosphere:
4000ppmv is 10 times 400 ppmv, or 3.32 doublings (23.32) of 400ppmv. Each doubling of CO2 has a forcing of 3.7 W/m2, so 4000 ppmv has a forcing of 12.84 W/m2. Adding the 229.95 insolation gives a warming effect of 242.23 W/m2, or 4.23 W/m2 relative to the current forcing.
For whatever it is worth, the forcing difference between 400 ppmv and 5000 ppmv (3.64 doublings) is 13.48 W/m2.
I assume this relates to your claim that there have been ice ages with CO2 levels at 5000 ppmv. That claim is false. To understand why, it must be understood that the graph of CO2 concentration shown above has a resolution of 10 million years (top of fourth page). If there is a five million year period with low CO2 immediately preceded by a period with high CO2, it will be shown as a period of average CO2 because the resolution of the graph is incapable of distinguishing the two periods. A later publication by the lead author of the previously linked study had a look at CO2 levels during periods of glaciation with data from high resolution strata. In almost every case, the ice ages came in periods of low CO2 (< 1000 ppmv) that were too short in duration to show up in the 10 million year resolution graph. The few cases not covered by his paper have since also been shown to have low CO2 by the discovery of new high resolution strata.
And just a point of vocabulary, geologists call any age with sea level, or near sea level glaciers an ice age. The periods of massive glacier advance commonly called ice ages by non-scientists are, by geologists, called glacials; while the warm periods between glacials are called interglacials. Thus, because of the sea level glaciers on Greenland and Antartica, we are currently in an ice age. Even with projected melt of ice sheets from a 5 C warming, there will still be sea level glaciers in Antarctica, and we will still be in an ice age. Absent more detailed information, the fact that there was an ice age in the past does not tell us whether it was equivalent to a glacial (as you are probably assuming) or an interglacial (as we are now).
Note that a 5 C warming is approximately equivalent to the equilibrium effect of an increase of CO2 from 280 ppmv to 975 ppmv (ie, effectively the 1000 ppmv limit found in the paper from the second link above).