


 Arguments


Does Urban Heat Island effect exaggerate global warming trends?
What the science says...
| Select a level... |
 Basic
Basic
|
 Intermediate
| |||
|
Urban and rural regions show the same warming trend. |
|||||
Climate Myth...
It's Urban Heat Island effect
A paper by Ross McKitrick, an economics professor at the University of Guelph, and Patrick Michaels, an environmental studies professor at the University of Virginia, concludes that half of the global warming trend from 1980 to 2002 is caused by Urban Heat Island. (McKitrick & Michaels)
The Urban Heat Island Effect (UHI) is a phenomenon whereby the concentration of structures and waste heat from human activity (most notably air conditioners and internal combustion engines) results in a slightly warmer envelope of air over urbanised areas when compared to surrounding rural areas. It has been suggested that UHI has significantly influenced temperature records over the 20th century with rapid growth of urban environments.
Scientists have been very careful to ensure that UHI is not influencing the temperature trends. To address this concern, they have compared the data from remote stations (sites that are nowhere near human activity) to more urban sites. Likewise, investigators have also looked at sites across rural and urban China, which has experienced rapid growth in urbanisation over the past 30 years and is therefore very likely to show UHI. The difference between ideal rural sites compared to urban sites in temperature trends has been very small:
Figure 1. Annual average temperature anomalies. Jones et al (dotted green and brown) is a dataset of 42 rural and 42 urban sites. Li et al (solid green and brown) is an adjusted dataset of 42 rural and 40 urban sites. Li (blue) is a non-adjusted set of 728 stations, urban and rural. CRUTEM3v (red) is a land-only data set (Brohan et al., 2006). This plot uses the 1954–83 base period.
Another way to explore the UHI would be to look at where the majority of warming has occurred across the globe. The UHI should match where most people live. However, if you look at the 2006 global temperature anomaly (figure 2.), you find that the greatest difference in temperatures for the long term averages where across Russia, Alaska, far north Canada and Greenland and not where major urbanisation has occurred.
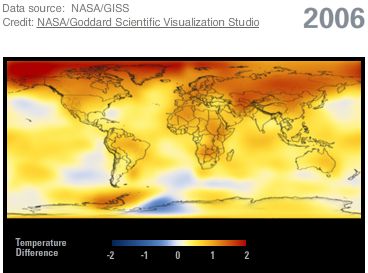
Figure 2. Using source data from NASA/GISS, this illustration shows the amount of change in global surface temperatures in 2006 from 1885.
The Urban Heat Effect has no significant influence on the record of global temperature trends.
Basic rebuttal written by mothincarnate
Update July 2015:
Here is a related lecture-video from Denial101x - Making Sense of Climate Science Denial
Last updated on 5 July 2015 by pattimer. View Archives


A response to arationofreason, who posted this question:
Inconveniently, the Koch Industries-funded BEST team has debunked this tired, trite meme. While urban areas are undoubtedly warmer than surrounding rural areas, this has had little to no impact on warming trends.
And
And
You are welcome to try again, but with actual evidence in lieu of your preferred empty assertions.
Adieu.
Is it true also that met stations which measure temperatures in rural areas have significantly reduced over the last decade all over the world? if so wouldnt this signify that the results are distorted?
Also the amount of rainfall across Australia increased from 1900 to 2000, however the rain may have fallen across different areas of land that expected by farmers. Does global warming take into account that rain doesnt always fall in the same location.
Has anyone setup a way to directly measure the reduction of the ozone layer from gases that can reach that high in the atmosphere and also directly measure how much heat from the sun the layer actually allows through. If direct measurement is accomplished and demonstrated this might be considered scientific evidence, before that time its always going to be a myth or an assumption to a portion of humanity. Kind of like a Ponzi scheme to many people I think. I have an interest in all of this as Im a studying university student
Recommended supplemetal reading:
Urban Heat Islands Don't Explain Climate Change - Here's The Bigger Problem by Marshall Shepherd, Science, Forbes, May 6, 2019
The lead paragraphs of Sheperd's essay:
Yes. I admit...I am a "Heat Islander" until all sources of science has been observered this effect has no bearing in cultural concern. This said, I have often wondered about how a geologist would respond to this subject as I have been taught that surface models have a tremendous impact on global climate. Then a friend of mine shared this link to me that shows that there is a noteabel absense from this field of science among the GWA board (LINK). If this wasn't enough to anger me, University of Maryland University College made a determination that the geology course was no longer transferrable as a "life science" towards my degree (this was during the time when the focus started shifting on the perils of greenhouse gasses in the media). Anyhow, if anyone is interested, I will gladly explane the global relief map codes that apparently used to be used by climatologists. I hope I can still find a copy of one online to illustrate.
[DB] That is not a credible source for science information, as this Note details at length.
Absolutely right, Darinscoop, if not more so. The alternating currents of the urbanised regions do produce a concentrated electromagnetic induction effect, warming the temperature sensors in the local weather stations. The previous explanation of UHI from "exhaust-heat and sun-warmed pavement" is a shabby falsehood put forward by a conspiracy of contrarians, who are receiving grants & other funding from Big Oil.
The world is actually cooling and the sea level is falling. Even the contrarians are hoaxing us.
Should we be looking at the surface area of the earth these differences in trends represents? These graphs would better be related to climate change if they included some correction for urban area change. Over time this urban area may be increasing (and suburban area decreasing) thus the total heat into the atmosphere is also increasing proportional to that area change. I expect that including urban area increase due to population would show a significant increase in total heat going into the atmosphere over time vs the suburban areas. When urban areas of the earth were small (less than 1%) the “heat island” effect was probably insignificant. Now that the urban area is over 3% of the earth’s surface an area correction is needed. There may also be some differences in the albedo of cities due to construction practices and population density.
[BL] Land use changes such as albedo are a regular part of the IPCC reporting. You can look through their reports to assess the effect of known changes.
https://www.ipcc.ch/reports/
You have posted a lot of speculation (maybe this, maybe that) without supporting evidence. In particular, what is the source of your claim that the urban area has changed by the amount you claim?
Meaningless speculation without supporiting information is not productive.
blaisct @59,
You say:-
The area of urban development is (according to Gao & O’Neill (2020) 'Mapping global urban land for the 21st century with data-driven simulations and Shared Socioeconomic Pathways' ) still well below 1% of global area at 0.6 million sq km in 2000 or 0.12% and, while growing, will remain below 1% by 2100 even with the highest of projections which show a rise to 0.7%. The Fig 1 of that paper is pasted below.
This then suggests "the “heat island” effect is and will remain probably insignificant." and thus no "correction is needed."
Here's the rate of warming per century since 1960 at some Berkeley Earth reference points.
50 km north-west of New York City:
+ 2.86°C
North-western Maine:
+ 2.90°C
Close to Barrow in northern Alaska:
+ 4.79°C
170 km north-west of Yellowknife, northern Canada:
+ 4.60°C
Northern Finland:
+ 3.03°C
Franz Josef Land, north-east of Svalbard:
+ 5.63°C
Central Kazakhstan:
+ 2.55°C
Close to Yakutsk in eastern Siberia:
+ 4.15°C
What happened to the urban heat island effect?
Thanks MA Rodger, my fault, I used the % (3%) of the earth land mass that was urban instead of the % of the total earth that was urban. The number from your graph of 0.7% urban (of the total earth area) seems to agree with other published information. I assume the heat from the “heat island” effect would be well mixed around the earth and become part of the total measurement of climate change. I present the following to check out the significance of the 0.7%.
1. The reported albedo of urban areas is about 0.04. (Albedo on a 0.0 to 1.0 scale)
2. The reported total albedo of the earth is about 0.31. (Assume that includes clouds and urban albedo)
3. The non-urban area of the earth is: 100%-0.7%= 99.3%
4. The contribution of urban areas to the total albedo is: 0.04 * 0.7% = 0.00028
5. The total non-urban area albedo contribution to the total is: (0.31-0.00028)/ 0.993 = 0.31190
6. Assume the non-urban area albedo in the 1880 era was the same as today: =0.31190
7. Current earth population is about = 7.8 B
8. 1880 era population is about =1.3 B (Using 1880 as the approximate start of IPCC temp data)
9. Assume the 1880 era urban area was proportional to population: = 1.3/7.6*0.7% = 0.12%
10. The 1880 era urban area contribution to total albedo was: 0.04*0.12% = 0.000047
11. The 1880 era non-urban area contribution to the total albedo was: (1- 0.12%)*0.3119 = 0.31154
12. The 1880 era total albedo estimate is: 0.311538+ 0.000047 = 0.311585
13. The difference in 1880 vs 2021 albedo is : 0.311585 – 0.31 = 0.001585 (or about 0.16% albedo change)
14. The reported out put of the sun reaching the earth is about: 1367 W/m^2
15. Therefore, this albedo difference is: 0.001585* 1367 = 2.1680W/m^2
16. I have seen conversion factors for converting this to ‘C in earth temperature rise of 0.5 to 0.7 ‘C/W/m^2. I’ll use the 0.5.
17. The equivalent earth temperature rise of the above albedo change from 1880 to now is: 2.168*.5 = 1.08’C
The IPCC reported temperature rise over the 1880 to now is about 1.0’C. This calculation implies that a 0.7% urban area could account for all of that temperature rise. I know this is over simplified, and was only done to find out the significance of small changes in a higher heat source ( over 4X lower albedo in urban areas vs the earth as a whole) on the earth surface. Other factors in albedo change should also be included: roads, forest fires land area, sea ice melting, land ice melting, rain forest destruction, and farming practices. I can only guess that including these albedo changes in the above would increase the man-made albedo global warming calculation.
The IPCC seems to give man-made albedo changes low significance because it is hard to measure and hard to detect change. Population change and even atmospheric CO2 change should also be an indicator of historical man-made albedo change, just need a reference point.
blaisct... Something is clearly amiss in your calculation since we can quite clearly see that most of the warming is not occurring in urban areas. Most of the warming is occurring in the Arctic, which is consistent with predictions made a century ago.
Blaisct @ 62.
As Rob Honeycutt says, there is something clearly amiss in your calculations. Let me point out the obvious ones.
1. You do not cite a sources for your urban albedo of 0.04. Wikipedia lists 0.04 as a value typical for fresh asphalt. Most urban areas are not fresh asphalt. I have a well-worn copy of Tim Oke's Boundary Layer Climates, where he lists typical urban surafaces as follows (p 281):
Your estimate of urban albedo is way too low.
Typical natural land surfaces (Ok.e op cit, p 12)
You need to consider just what urban material is replacing what natural material. Then you can estimate a change in albedo. Most urban landscapes are not that different from natural ones.
4. Global albedo is not just a surface albedo. You need to factor in cloud cover. For a global cloud cover of 50%, only half the surface is seen from space - and surface albedo changes only have half the effect you get when you ingore cloud cover. You'd need to know the cloud cover over the urban areas you are doing calculations for.
Your estimate of the contribution of urban surface albedo is an over-estimate. A serious over-estimate.
7 through 13. Urban area is not proportional to population. Haven't you ever noticed how much more closely packed people are in cities, compared to rural areas? Population density is not uniform. Oke (op cit, p291) notes that the urban heat island effect tends to be proportional to the log of population, not linear. You are seriously over-estimating the amount of global albedo change in relation to urban population growth.
14 and 15. The 1367 W/m^2 figure is for a measurement perpendicular to the sun's rays, in full sun. To compare to CO2 and other forcings, you need to divide by four, as the CO2 forcing is calculated for the entire globe, perpendicular to the earth's surface - not the sunlit side perpendicular to the sun's rays.
You are over-estimating the effect by a factor of 4.
16. As you have the wrong forcing in W/m^2, you are getting the wrong temperature rise.
17. Essentially, garbage in, garbage out.
Real scientists have been doing this the right way for decades. Try this one from way back in 1979:
https://science.sciencemag.org/content/206/4425/1363.abstract
blaisct @62,
Perhaps repeating some of the criticism @64:-
You say "The IPCC seems to give man-made albedo changes low significance because it is hard to measure and hard to detect change." But difficulty does not appear to be something to dampen your enthusiasm.
Do note that 0.04 albedo is far too low and, while potentially applicable to a sky-pointing piece of asphalt, is not applicable to urban areas. Also note that clouds float above cities forests and oceans alike and they contribute some 75% of the planet's albedo. And also note that the sun sets every evening and never rises to be overhead except at noon in the tropics. You need to divide the tropical noon-day value by four to satisfy the very simple geometry of spheres.
The solar radiation actually reflected spacewards by the Earth's surface is shown in the diagram at 23Wm^-2. If by 2100AD, the planet's urban spread were somehow to reach over 0.7% of the planet's surface area (as the most extreme projection in the graphic @60 suggests is possible) and even if that 0.7% had an albedo of zero, that 23Wm^-2 would only reduce by [23 x 0.007 =] 0.16Wm^-2 which, despite the use of the most exaggerating numbers, is significantly smaller (x10 smaller) for 2100AD than the value you arrive at for today's value. Using more realistic numbers would return an insignificant result (x100 smaller).
Thanks All for the input. You are increasing my understanding of the albedo effect. I appreciate the articles you mentioned and see that the subject is very complex and calculations like mine are only useful for understanding the simple significance of the many variables and not useful for reaching conclusions or predictions. One general conclusion that seem to come from all the articles and papers is that albedo is most likely significant but there is not agreement on how significant, or the range of each of the variables, or the total interaction of all the albedo variables. I sure hope that the GW experts are improving their models with new NASA satellite data. Does anyone out there know how much of the current GW data (1.1’C) in the IPCC model is accounted for by albedo change?
For entertainment only, I redid the significance of the 0.7% urban of total earth surface what if calculation to include some of the comments.
1. The reported albedo of urban areas is about 0.08 (double the 0.04). (Albedo on a 0.0 to 1.0 scale)
2. The reported total albedo of the earth is about 0.31. (Assume that includes clouds and urban albedo)
3. % of earth that is urban: =0.7%
4. The non-urban area of the earth is: 100%-0.7%= 99.3%
5. The contribution of urban areas to the total albedo is: 0.08 * 0.7% = 0.00056
6. The total non-urban area albedo contribution to the total is: (0.31-0.00056)/ 0.993 = 0.31162
7. Assume the non-urban area albedo in the 1880 era was the same as today: =0.31162
8. Current earth population is about = 7.8 B
9. 1880 era population is about =1.3 B (Using 1880 as the approximate start of IPCC temp data)
10. Assume the 1880 era urban area was proportional to population: = 1.3/7.6*0.7% = 0.12%
11. The 1880 era urban area contribution to total albedo was: 0.07*0.12% = 0.0000933
12. The 1880 era non-urban area contribution to the total albedo was: (1- 0.12%)*0.31162 = 0.311257
13. The 1880 era total albedo estimate is: 0.311257+ 0.0000933 = 0.311351
14. The difference in 1880 vs 2021 albedo is : 0.311351 – 0.31 = 0.00135 (or about 0.14% albedo change)
15. The reported output of the sun reaching the earth is about: 1367 W/m^2
16. Assume that the urban albedo is only seeing one half (balk of urban areas are in the middle half of the earth’s surface) of the above due to the curvature of the earth: 50%
17. Average surface of the earth cloud cover: =67%
18. Average albedo of clouds: = 50%
19. Total sun’s output reaching cloud covered urban areas + non cloud covered urban (corrected for curvature) is : 455 W/m^2.
20. Therefore, this energy of the albedo difference is: 0.00135* 455= 0.61W/m^2
21. I have seen conversion factors for converting this to ‘C in earth temperature rise of 0.5 to 0.7 ‘C/W/m^2. I’ll use the 0.5.
22. The equivalent earth temperature rise of the above albedo change from 1880 to now is: 0.61*.5 = 0.31’C
The IPCC reported temperature rise over the 1880 to now is about 1.1’C. This what if calculation implies that a 0.7% urban area could account about 30% of this temperature rise – not insignificant.
One of the papers (in your previous references) on land use albedo change seems to agree that man-made albedo changes (mainly in agriculture by Mark Healey https://www.scirp.org/pdf/ijg_2020062914563820.pdf) are significant and could account for all the IPCC temperature rise. Mark Healey’s paper suggest that land use changes since 1910 are stronger than the UHI albedo effect.
I am switching over to the “It’s albedo” thread. What are all the possible albedo changes since 1880?
[BL] Link activated.
The web software here does not automatically create links. You can do this when posting a comment by selecting the "insert" tab, selecting the text you want to use for the link, and clicking on the icon that looks like a chain link. Add the URL in the dialog box.
blaisct:
I have replied to you here, which is a more suitable thread to continue discussion.
blaisct:
I have also replied to your post # 66 over on the Albedo Effect where Michael Sweet has responded.
In my view, the most important — and understudied — effect of UHI as it relates to global warming is the fact that large expanses of macadam act as heat sinks. This resuts in the phenomenon where by cities create their own weather: on the coast, UHI-expanses like that of Houston increase the effect of the landbreeze; stack moisture in clouds at a higher rate, and, eventually, drop more water onto the heat sinks. The rain cools these heat sinks off and, in the process, transfers warmer water into aquifers that feed the Gulf Stream.
Our senses, higher summer temperature readings at airports, and the chart above showing no significant difference over time between the temperature increase in rural and urban areas tells us this heat transfer is significant.
The UHI heat-transfer model explains both the effect on the polar ice cap and the warming of tropical waters. The Gulf Stream, now warmer than otherwise, leads up to the arctic polar ice cap and melts it. In the summer months, the Gulf Stream slows its transfer of warmer water into cooler water so that warmer water remains in Caribbean to develop into storm.
The Greenhouse Gas model does not account for any heat transfer arising from rain-cooled macadam. In omitting the fact of transfer, the Greenhouse Gas model must be inaccurate.
Within a model that takes into account UHI-created weather patterns and rain-cooled macadam, atmospheric increase in carbon dioxide is less as the cause of global warming than an index of burning.
HamletsGhost @69 :
You propose interesting methods of heat transfer from cities to rural & marine regions (such as Siberia and the Arctic sea).
However, to be worth consideration of this matter, it would be necessary for you to give at least a rough approximation of the actual quantification of this proposed effect. Size matters.
In post #60 above, MA Rodger notes the world's urban area is about 0.12% of global area. How will that percentage (adjusted by its albedo difference from rural) alter the Greenhouse Gas related calculations of global warming? My off-the-cuff guesstimate is that the overall alteration would be a poofteenth* .
[ *poofteenth is a mathematical term recently adopted by analysts assessing various magnitudes of contribution from heating/cooling factors driving Earth's surface temperature ]
I am also mystified by the energy budget here. Radiation absorbed by low albedo areas, tend to radiate that back in infrared which is absolutely part of the models. Conductive transfer to rainwater is negible by comparison. Take a small amount of conductive heat transfer from a very small part of the area of the world going into a very large body of water and I would challenge you to measure the effect. I suspect it would hard to measure the effect on even the rivers flowing through a city let alone the ocean but happy to contradicted by data
A quick addition for the sake of clarity:
HamletsGhost mentions land breezes. A land breeze is kind of the opposite phenomenon of a sea breeze. In land breeze conditions, the land surface cools down and reaches a lower temperature than the adjacent sea surface. They are usually stongest in the morning, when the temperature gradient is the largest. As a result, air flows from the land toward the sea, where air rises by convection. Although some sea breezes are known to reach far over land (it's relative, the farthest reaches identified are about 200 miles in tropical regions), land breezes are usually weaker and seldom reach beyond the 30 miles range off the coast.
In any case, it is worth emphasizing that a land breeze brings cooler air from the land over the sea surface. A sea breeze occurs during the day, when the land surface heats up quicker than the water and reaches a higher temperature. Air then rises over land and cooler air comes from the sea. These local patterns have been studied.
There is research suggesting that increased urbanization plays a role in decreasing trends in sea and land breezes, although no clear trend appears to be identifiable on a larger, global scale.
The biggest failing in Hamlet'sGhost's comment #69 is his use of the phrase 'Greenhouse Gas model". There is no such model - what we do use in climatology is models of things like radiation transfer, energy conservation, fluid motion, conduction, the hydrological cycle, cloud formation and precipitation, etc., all built together into broad-scope "climate models". Greenhouse gas effects are the result of the well-understood radiation tranfser part of that - as they play out across all the combined physics.
There is also no such thing as an "Urban Heat Island model" - unless it's a creation of HamletsGhost's imagination. The urban heat island effect is a combination of energy balances, surface properties, changes in evaporation due to availability of water (see "hydrological cycle"), etc. All those physical properties and processes are part of "climate models" HamletsGhost's idea that UHI is something excluded from our climate models is bizarre.
In short, HamletsGhost has no idea what he is talking about.
HamletsGhost @69
You say “The Greenhouse Gas model does not account for any heat transfer arising from rain-cooled macadam.” By greenhouse gas model, perhaps you are referring to the models for radiant energy transfer in the atmosphere. MODTRAN In Infrared Light in the Atmosphere is one such model available to everyone and can be used to clearly demonstrate the powerful effect of greenhouse gases. Urban heat island effects, including changes to albedo, evaporation, transpiration, precipitation, and energy production, are negligible compared to radiant energy loss to space. Actually, while the changes in these effects are tiny, the hydrologic cycle, convection, and conduction in the troposphere are built into the atmospheric temperature profile (lapse rate) upon which radiant energy transfer models are based. All that you have described are ways that energy moves around within a small portion of the troposphere and they do not have any significant effect on the global average temperature profile of the atmosphere. You jump to an incorrect conclusion that “In omitting the fact of transfer, the Greenhouse Gas model must be inaccurate.” Then to say that “Within a model that takes into account UHI-created weather patterns and rain-cooled macadam, atmospheric increase in carbon dioxide is less as the cause of global warming than an index of burning” is simply not true.