


 Arguments


What does past climate change tell us about global warming?
What the science says...
| Select a level... |
 Basic
Basic
|
 Intermediate
| |||
|
Greenhouse gasses, principally CO2, have controlled most ancient climate changes. This time around humans are the cause, mainly by our CO2 emissions. |
|||||
Climate Myth...
Climate's changed before
Climate is always changing. We have had ice ages and warmer periods when alligators were found in Spitzbergen. Ice ages have occurred in a hundred thousand year cycle for the last 700 thousand years, and there have been previous periods that appear to have been warmer than the present despite CO2 levels being lower than they are now. More recently, we have had the medieval warm period and the little ice age. (Richard Lindzen)
At a glance
Just imagine for a moment. You fancy having a picnic tomorrow, or you're a farmer needing a dry day to harvest a ripe crop. So naturally, you tune in for a weather-forecast. But what you get is:
“Here is the weather forecast. There will be weather today and tomorrow. Good morning.”
That's a fat lot of use, isn't it? The same applies to, “the climate's changed before”. It's a useless statement. Why? Because it omits details. It doesn't tell you what happened.
Climate has indeed changed in the past with various impacts depending on the speed and type of that change. Such results have included everything from slow changes to ecosystems over millions of years - through to sudden mass-extinctions. Rapid climate change, of the type we're causing through our enormous carbon dioxide emissions, falls into the very dangerous camp. That's because the faster the change, the harder it is for nature to cope. We are part of nature so if it goes down, it takes us with it.
So anyone who dismissively tells you, “the climate has always changed”, either does not know what they are talking about or they are deliberately trying to mislead you.
Please use this form to provide feedback about this new "At a glance" section. Read a more technical version below or dig deeper via the tabs above!
Further Details
Past changes in climate, for which hard evidence is preserved throughout the geological record, have had a number of drivers usually acting in combination. Plate tectonics and volcanism, perturbations in Earth's slow carbon cycle and cyclic changes in Earth's orbit have all played their part. The orbital changes, described by the Milankovitch Cycles, are sufficient to initiate the flips from glacials (when ice-sheets spread over much of Northern Europe and the North American continent) to interglacials (conditions like the past few thousand years) and back – but only with assistance from other climate feedbacks.
The key driver that forces the climate from Hothouse to Icehouse and back is instead the slow carbon cycle. The slow carbon cycle can be regarded as Earth's thermostat. It involves the movement of carbon between vast geological reservoirs and Earth's atmosphere. Reservoirs include the fossil fuels (coal/oil/gas) and limestone (made up of calcium carbonate). They can store the carbon safely over tens of millions of years or more. But such storage systems can be disturbed.
Carbon can be released from such geological reservoirs by a variety of processes. If rocks are uplifted to form mountain ranges, erosion occurs and the rocks are broken down. Metamorphism – changes inflicted on rocks due to high temperatures and pressures – causes some minerals to chemically break down. New minerals are formed but the carbon may be released. Plate tectonic movements are also associated with volcanism that releases carbon from deep inside Earth's mantle. Today it is estimated by the U.S. Geological Survey that the world's volcanoes release between 180 and 440 million tonnes of carbon dioxide per year - as opposed to the ~35 billion tonnes we release.
Epic carbon releases in the geological past
An extreme carbon-releasing mechanism can occur when magma invades a sedimentary basin containing extensive deposits of fossil fuels. Fortunately, this is an infrequent phenomenon. But it has nevertheless happened at times, including an episode 250 million years ago at the end of the Permian Period. In what is now known as Siberia, a vast volcanic plumbing-system became established, within a large sedimentary basin. Strata spanning hundreds of millions of years filled that basin, including many large coal, oil, gas and salt deposits. The copious rising magma encountered these deposits and quite literally cooked them (fig. 1).
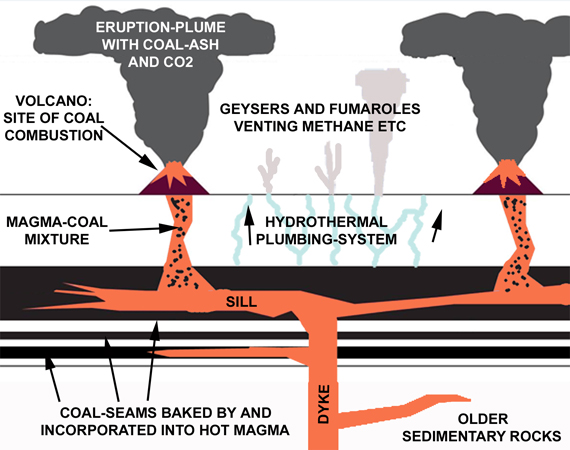
Fig. 1: schematic cross section though just a part of the Siberian Traps Large Igneous Province, showing what science has determined was going on back then, at the end of the Permian Period.
Now laden with a heavy payload of gases, boiled out of the fossil fuel deposits, some of the magma carried on up to the surface to be erupted on a massive scale. The eruptions – volcanism on a scale Mankind has never witnessed - produced lavas that cover an area hundreds of kilometres across. Known as the Siberian Traps, because of the distinctive stepped landforms produced by the multiple flows, it has been calculated that the eruptions produced at least three million cubic kilometres of volcanic products. Just for a moment think of Mount St Helens and its cataclysmic May 1980 eruption, captured on film. How many cubic kilometres with that one? Less than ten.
Recently, geologists working in this part of Siberia have found and documented numerous masses of part-combusted coal entrapped in the lavas (Elkins-Tanton et al. 2020; fig. 2). In the same district are abundant mineral deposits formed in large pipes of shattered rock as the boiling waters and gases were driven upwards by the heat from the magma.
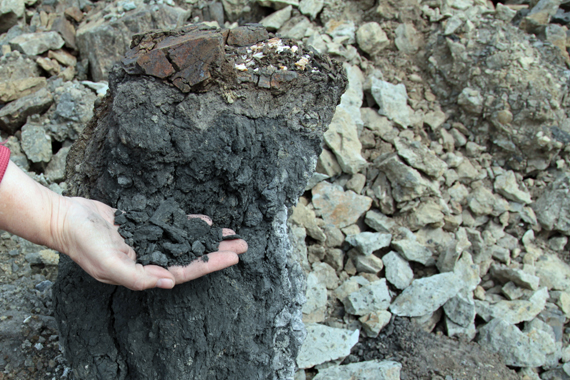
Fig. 2: an end-Permian smoking gun? One of countless masses of part-combusted coal enclosed by basalt of the Siberian Traps. Photo: Scott Simper, courtesy of Lindy Elkins-Tanton.
It has been calculated that as a consequence of the Siberian Traps eruptions, between ten trillion and one hundred trillion tons of carbon dioxide were released to the atmosphere over just a few tens of thousands of years. The estimated CO2 emission-rate ranges between 500 and 5000 billion tonnes per century. Pollution from the Siberian Traps eruptions caused rapid global warming and the greatest mass-extinction in the fossil record (Burgess et al, 2017). There are multiple lines of hard geological evidence to support that statement.
We simply break into those ancient carbon reservoirs via opencast or underground mines and oil/gas wells. Through such infrastructure, the ancient carbon is extracted and burned. At what rate? Our current carbon dioxide emissions are not dissimilar to the estimated range for the Siberian Traps eruptions, at more than 3,000 billion tons per century. The warning could not be more clear. Those telling you the climate's changed before are omitting the critical bit – the details. And when you look at the details, it's not always a pretty sight.
Last updated on 14 February 2023 by John Mason. View Archives


TVC15 , if I may add a little to MA Rodger's Post #800 :
your denialist friend's 2nd scientific paper quoted, is dealing with a small coastal area at the southern tip of Brazil. The paper specifically says it has not allowed for "tectonic processes" that might modify the results.
When you add in a quantum of uncertainty of timings locally, and at the Vostok site also . . . then really he is making no useful comparison with changes in insolation at 65N [was your 651N a typo?] . . . nor any useful comparison with CO2 levels. And looking at temperature changes over the course of each MIS or interglacial period, you see that each cycle shows its own unique pattern of variations against the grand sweep of glaciation/deglaciation. From "minor" variations in insolation, ocean currents, vegetation changes, etcetera ~ and variation in sea-levels.
Your denialist friend has not shown any evidence to disprove the role of CO2 in connection with planetary surface temperature.
And he seems to have quite misunderstood the papers he quoted : indeed he is wasting the time of the readers.
And tell him, regarding sea-level highstands . . . he's out of his depth!
Again many thanks to both MA Rodgers and Ecletic!
I am also out of my depths with respect to sea-level highstands but I knew that this denier was as well and I knew enough to know that neither of his links disproved anything I stated.
Without this site I would have to return to college and go an additional 2 years with intense focus on the science mythologies of climate change.
Thank you so much for broadening my scientific knowledge! :)
TVC,
I'll add that I looked at both links in your comment above and can not understand the allusion to "government." One study from Oxford University was funded by the Gary Comer Abrupt Climate Change Fellowship, the other is from the Annals of the Brazilian Academy of Science. Unless you're from Brazil, it would suggest your interlocutor did not spend much time looking at the studies; it would be a pity because the full text is available for free on both of them.
Its a matter of history that as global tempatures rise evaporation increases and so dose plant matter that ends up traping it in soil or algea or bactria humans are a small pawn in this game. they only real major contributor to co2 is volcano's there is no way humans will ever elvate co2 levels to 4500 ppm
Jkss97 @804 ,
did you really mean 4500 ppm ?!?!
I ask, because you made nine other errors/typos in your four lines.
And that's not counting your major scientific errors.
Please improve your climate science education !
Eclectic @805,
I think the reason for the 4,500ppm is probably that such levels of atmospheric CO2 have been found in studies for the early Phanerozoic, indeed perhaps higher. And if all the fossil fuels were burnt [they reckon coal reserves are perhaps 1,000Gt(C) with oil & gas perhaps another 500Gt(C)] you'd 'only' raise CO2 by some 350ppm with perhaps natural feedbacks adding as much again. So mankind would be hard pressed to 'achieve' a 4,500ppm level of CO2 by fossil-fuel-use alone.
Thanks, MA Rodger. It was mysterious to me, where he ( Jkss97 ) had gotten the 4500ppm figure from. As you say, a future 4500ppm level would require the decomposition of vast amounts of carbonate rock, or maybe some other almost unimaginable cataclysmic event.
And yet if he had meant to type 450ppm, then this figure is easily achievable by mankind continuing "business as usual" ~ and probably will be reached in a few decades' time.
But with so many typo errors (and scientific errors) in his post #804 , there was a great deal of uncertainty about what he was on about. ( I gave a marking of nine errors there . . . though a stricter assessment might have scored thirteen errors, not counting the 4500 and the scientific errors).
It is less than 24 hours [now] so it is just possible that #804 might not be a room-temperature-level typical "drive-by" comment: and Jkss97 may return and explain what he means.
My other thought was of some translational difficulties perhaps ~ but then again, a non-native English speaker would likely be too careful in his typing to make such a large number of typographical errors . . . and also, the peculiar grocers' plural - volcano's - is an error unlikely to be made by a foreign learner of English.
We shall see.
Especially the meaning of the chart from the University of Copenhagen remains unclear to me:
1) CO2 has been measured in the ice of the antarctica. It should therefore reflect the CO2 content of the sea in the past. Warmer oceans can dissolve less CO2. Wouldn't we then expect a CO2 content in the ice indirect proportional to the temperature?
2) It is a common fallacy in science to assume a causal relationship between two parameters just because they show a similar behaviour over time. If we assume there is a direct causal relationship between the greenhouse gases and temperature, we would expect a much higher temperature in the present in contrast to what we see in the chart. Looking at the graphic from an unbiased perspective I would assume that both greenhous gases and temperature are correlated to other parameters. According to the data CO2 and methane don't seem to have a significant influence on temperature therefore.
All in all, temperatures in the antarctica seem to be rather unobtrusive with no visible deviations since the industrial age.
The Skeptic:
1) Your question is hard to read. Indirectly proportional means as one variable goes up the other goes down. Directly proportional means as one variable goes up the other goes up.
We expect that as ocean temperature goes up less CO2 will be dissolved. The CO2 goes from the ocean into the atmosphere. We see in the Copenhagen graph that as temperature goes up, CO2 also goes up. That is exactly what was predicted by scientists decades before the ice core was obtained.
2) Scientists first predicted that increasing CO2 would result in increasing temperature in around 1855. The ice core measurements made over 100 years later confirmed this prediction. A prediction made over 100 years in advance of the data is not the same as "assum[ing] there is a direct causal relationship between the greenhouse gases and temperature". Validation of predictions is strong confirmation that the theory is correct.
The ice core data end before the start of the industrial age. Note that the first line on the timeline is 50,000 years ago. You need to look at the Hocky Stick to see the changes due to the industrial age. That data shows a clear link between dramatic increases in temperature and release of CO2. This temperature increase is known to cause sea level rise, unprecedented wild fires and extreme weather.
theSkeptik @808,
You refer to the plot of CO2, Methane & temperature found in the 'intermediate' OP which is derived from Antarctic ice cores.
(1) The CO2 and Methane data is obtained from the content of air bubbles so is not a measutre of ocean CO2 but of atmospheric CO2.
(2) You compare the increase in CO2 through recent ice age cycles with the modern anthropogenic increase and, given the larger temperature swings plotted through the ice ages you suggest "we would expect a much higher temperature in the present in contrast to what we see in the chart." Do note firstly that the climate forcing from GHGs through the ice ages still exceeds the modern anthropogenic forcing which have had little-enough time to act and that GHGs were not the sole forcing agent through the ice ages. Secondly, the temperatures plotted are from the Antarctic which hasn't regionally seen as much warming as there has been globally, and that despite polar amplification which would have 'amplified' the ice age temperature swings in Antarctica.
You also dismiss CO2 and methane as significant forcers of climate because you "assume that both greenhous gases and temperature are correlated to other parameters." What are these other 'parameters' you talk of and their means of 'correlation' to GHGs and to temperature?
theSkeptik - " I would assume that both greenhous gases and temperature are correlated to other parameters"
Well, yes, because physics. Long lived non-precipitating greenhouse gases in the atmosphere (CO2, CFCs, Methane) reduce IR emissions to space from the top of the atmosphere, which causes an imbalance of energy in the climate against incoming sunlight, and the climate therefore warms until radiated energy once again equals incoming.
Along the way there are feedbacks both (mostly) positive and (some) negative which on the whole amplify the temperature response, such as changing CO2 solubility in the oceans, changing Earth albedo by melting snow over darker landscapes, methane releases from warming permafrost, and as a fast response changes in absolute humidity due to warm air holding more water vapor (itself a greenhouse gas, although as a feedback, not a driver).
Physics comes first - correlation analysis to determine the exact amplitude of the response between drivers and the climate comes later.
What has happened in the past is easily accounted for within our current theory of climate. No unexplained physics though there are unfortunately plenty of underconstrained problems (where more than one possible cause for observations and insufficient measurable to distinquish).
What we can say with confidence is that increasing GHG will increase the amount of radiation received at the surface because we can unambiguously measure it. Unless you can dream up some other way to account for the observations, then I dont see how you can dispute this.
Now, if the sun increased its output so that an extra 4W/m2 reached the surface, do you think the planet would warm? (If you dont think so, then I am fascinated to hear your theory of seasons...). If you accept that, then why dont think an extra 4W/m2 from GHG would also warm the surface.
@michal sweet, MA Rodger and KR:
First of all I very much appreciate your quick comments on my post.
to 1) yes, I realize now that ice core measurements have been taken in the antarctica (not arctica) which I assume means it's about CO2 from the atmosphere, not the sea water. The shown direct relationship to the temperature is therefore plausible to me.
to 2) I am discussing solely the meaning of the presented data from the University of Copenhagen. The article claims it supports the assumption that there is a causal relationship between the GHG and global temperature. Don't get me wrong, there may be other evidence for that claim but that's not my point here.
@michael sweet
The predicion you mentioned about the global warming 100 years ago is outside the scope of the discussed data. Apart from that, there are only two possible outcomes from such a prediction: a) It can turn out right - temperatures are rising or b) it can turn out wrong - temperatures are falling. So even with an uneducated guess one would have a 50% chance to be right. Finally, the graphic doesn't even show any evidence of global warming, though it does show a very significant raise in methane and CO2 in the last decades.
@MA Rodger
I see your first argument is in line with another claim of the article that recent data show a phase shift in GHG and temperature. Since 2012 GHG movement is said to no longer lag behind temperature data. I agree this would be an indication of a significant change. Unfortunately this data is not shown in the article and it can't be seen in the presented graph. Your second argument just seems to support my concern: Global warming can't be seen in the antarctica according to the chart so far. It is possible that it shows up in the future, but the shown data gives no evidence to that assumption.
Finally I do not make any claims about any relationships between GHG and temperature or other related parameters. I am just looking for unbiased information and constantly come across overinterpreted data and conclusions driven by preoccupation. If one claims a causal relationship between two parameters its up to them to give evidence, not to me to proof otherwise.
@KR
As a physicist working for several decades in RnD companies I am not easily convinced of simple models describing the behaviour of complex reality. At least it's not obvious to me that a gas in a concentration of only several hundreds of ppm is likely to have such a significant influence on global temperature. It might not be impossible and I will surely have a closer look at this matter in due course. However, as I mentioned before this is not my current point. I am discussing the presented graphic which seems to support nothing of the claims about global warming apart from unusual high greenhouse gas concentrations.
theSkeptik - Please see How substances in trace amounts can cause large effects regarding increasing the ppm of CO2. Raising the primary greenhouse gas concentration by more than 30% has a very significant effect.
And those unusually high greenhouse gas concentrations are exactly the issue - based upon simple spectroscopy, supported by direct empirical measurements of surface and orbital temperatures and radiation, and by examining all physically plausible temperature forcings (observed changes in natural forcings would have cooled the climate over the last 50 years, only anthropogenic greenhouse gas increases have warmed it).
So yes, the change in greenhouse gas concentrations which that graphic displays is hugely significant.
theSkeptic - See also the Argument from Incredulity regarding CO2 concentrations.
TheSkeptic - It is amusing to see a self-professed scientific-minded individual claim that "I will surely have a closer look at this matter in due course" in reference to The Key Apsect of the Issue being discussed.
How is it you have developed so many thoughts on this matter without first developing a robust understanding of its most fundamental basis?
"The article claims it supports the assumption that there is a causal relationship between the GHG and global temperature"
It does, but you cannot isolate the diagram from the rest of physics and I do not believe the article purports to do so. The claim is not that "because CO2 levels move lock step with temperature, ergo CO2 is causing temperatures to rise", which would indeed be a misstep. The claim is more that these observation support what we would predict from the underlying physics and chemistry at work. The tricky thing with iceage cycle is that it is strongly correlated with insolation at 65N. While the forcing at that latitude is strong, the forcing globally is weak (can be antiphased in southern hemisphere). However, the feedback loop that change the GHG composition with temperatures at in high northern latitude easily accounts for converting a local change into a global event.
I would also say, that if you are a physicist, do you go with your gut or do you do the maths?
OnePlanetOF @816 ~ well stated, sir. I also admire the droll delicacy of your final sentence.
Like you, I enjoy the obfuscatory sophistry that "TheSkeptic" is employing . . . and reading between the lines of his own comments, it appears that he enjoys constructing these obfuscatory sophistries.
TheSkeptic ~ sir, when you have finished with your footwork, would you please make a straightforward presentation of how, where & why you consider the modern mainstream science to be wrong in matters of climate. ( I would like to think you have something definite in mind . . . and are not just trying to bluff while holding a completely valueless hand of cards.)
[PS] Thanks. Fixed.
@theSkeptic 813
"At least it's not obvious to me that a gas in a concentration of only several hundreds of ppm is likely to have such a significant influence on global temperature."
It was not obvious to anyone until the work had been done and the conclusions drawn. A skeptic, of course, asks the question is it possible that a small amount of a substance can have a large effect? And then researches it.
Looking around we can see hundreds of examples in the real world where small amounts have a large effect. For instance the cascade effect in the body of a small amount of hormone triggers reactions very speedily. I doubt you would eat fuga fish if you felt the chef had done less than a stellar job preparing it.
You are an experienced R&D scientist. So why are you not more skeptical?
theSkeptik @813,
Such is the composition of your specific responses (not least to my comment @810) that I feel you should be made aware of how far you are from grasping the reality of the climatology you criticise. This makes addressing the substance of your comment (which actually has some merit) an impossibility.
Thus (& specific to you reply to my comment @810), what you call my "first argument" is correcting your error @808 by pointing out the well-known situation that the CO2 measured from ice cores is measuring trapped air. You move on from this 'correction' and on to the so-far-unmentioned-by-you problem of the difference between the age of the ice and the age of the air entrapped within the ice which as you correctly say is not addressed in this SkS post. It is addressed on a different SkS post which is linked within the above SkS post. "Unfortunately" you are unable to cope with that situation.
Similarly, you use part of what I present within what you call my "second argument" to begin anew with a different argument that an absence of Antarctic warming is equivalent to there being no global warming. (Actually if this were the issue, more up-to-date temperature data, so for instance the warming below -70ºS measured by GISTEMP, records a great deal of Antarctic warming over recent years.)
Finally you are flat wrong to suggest that you "do not make any claims about any relationships between GHG and temperature or other related parameters." Whatever your experience in "just looking for unbiased information," do not deny that you yourself come here with "overinterpreted data and conclusions driven by preoccupation," and I would suggest your two comments @808 & @813 show you are more pre-occupied than those you criticise.
The SkS post above, addresses the nonsense myth set out by denialist Richard Lindzen that "climate is always changing" and thus "wasting resources on symbolically fighting ever present climate change is no substitute for prudence." You may be unsatisfied that this SkS post properly addresses Lindzen's denialist argument. And I may agree with you on that specific-but-narrow point. But such a deficiency does not, as you attempt to argue, make the underlying thesis wrong. And you failure to present consistent and trustworthy analysis suggests proper discussion of all this likely a little pointless.
Skeptic @813:
I am astonished that you will not consider conclusions over 100 years old. It is no wonder that you conclude that the scientists over generalize their conclusions when you restrict discussion to only the data in their paper. I note that the paper provides no evidence that the Earth is round, that matter is made of atoms or that the Sun will come up tomorrow. Normal scientific discussion includes data previously gathered. Your claims that only the data in the paper can be considered is in contravention to all scientific and normal conversation.
You make no attempt to provide a scientific justification for your wild claims. Since many others are commenting to you I will withdraw to prevent dogpiling.
Wow, I am overwhelmed by all this aggression, I never intended to offend anyone and I don't dare to imagine what would have happened if I said that I don't believe in anthropogenic climate change - which I haven't so far.
Please understand that I am no longer able to respond to every comment in detail. Especially I won't comment any postings from people who are apparently not able to formulate a single argument.
My second point was that the graphic from the University of Copenhagen does not show any evidence or even indication for a direct temperature GHG relation. I explicitely stated that there may be other evidence for that apart from the graphic. The simple question "what information can be derived from the graphic" obviously can and must be answered only in the context of the graphic. Just assume that I agree with you about the direct causal relationship between GHG and temperature. Would it change the meaning and information of the shown data? Certainly not within the boundaries of science.
I noticed one single argument related to that question so far. The lack of correlation between temperature and GHG in the presence may be due to a lag of the temperature change since the last couple of years. It therefore doesen't show up in the graphic. Well, fair enough. But that even more so underlines my point: It's something the graphic does not show. So my statement "why presenting that data which does not show what the article intends to" stays unchallanged.
[DB] Inflammatory and baiting rhetoric snipped.
Please note that posting comments here at SkS is a privilege, not a right. This privilege can be rescinded if the posting individual treats adherence to the Comments Policy as optional, rather than the mandatory condition of participating in this online forum.
Please take the time to review the policy and ensure future comments are in full compliance with it. Thanks for your understanding and compliance in this matter.
Finally, please understand that moderation policies are not open for discussion. If you find yourself incapable of abiding by these common set of rules that everyone else observes, then a change of venues is probably best. Electrons are plentiful and abundant.
NOTE: T his user has requested to recuse themselves from further participation here.
"Does not show any evidence of direct ...for a direct GHG temperature relationship"
Physics and chemistry predict that temperature will correlate with GHG for milankovich forcings. The data supports that prediction.
Here they are from Epica directly overlain.
And here is a correlation plot, though the GHG forcing instead of CO2 concentration since there is non-linear relationship between CO2 concentration and forcing.
Source:
Shows a pretty good relationship if you ask me - or statistically calculate it. I dont think you are articulating your problem with the graphic well enough.
"The lack of correlation between temperature and GHG in the presence may be due to a lag of the temperature change since the last couple of years."
I suspect English is not your first language, but I cannot parse your meaning here. "a couple of years" is not something discernable on UoC graphic. If you mean present time, (since say 1970), then climate (not weather) is strongly correlated with GHG levels. Even more strongly correlated with total radiative forcing (taking into a account all influences on climate). Note of course that decadal-level variations in temperatures are not driven by GHG. Claiming that science predicts constant, temperature/GHG relationship is a straw-man fallacy.
This is may first post and I am not able to repeat the 823 POST chart. What ir says to me is that changes in temperature clearly ocurr in advance of changing CO2 levels. Which makes sense since with warming teperatures the ocean will release CO2.
Does CO2 in the atmosphere reflect the sunlight? Similar to clouds. If so then the greater effect orf increased CO2 is to cool the Earth because there is much more energy reflected toward space than toward Earth.
This is a simplistic view, but CO2 from the ocean and from decompostion of organic matter are so dominant, does it not make sense? Also, man has done awful things to the ocean so mightened this contribute to the warming and therefore the CO2 release. "See this: Is CO2 causing climate change?"
[DB] Hyperlinked source that was breaking page formatting.
Bruce Monk, the nature of both your questions and remarks clearly show that you are nowhere near the level of knowledge and understanding that you would need in order to formulate any kind of opinion that could be of interest to others. There is plenty to learn on this site and it refers other sources as well; you have lots of reading to do if you want to contribute.