


 Arguments


Sun & climate: moving in opposite directions
What the science says...
| Select a level... |
 Basic
Basic
|
 Intermediate
|
 Advanced
| ||||
|
The sun's energy has decreased since the 1980s but the Earth keeps warming faster than before. |
|||||||
Climate Myth...
It's the sun
"Over the past few hundred years, there has been a steady increase in the numbers of sunspots, at the time when the Earth has been getting warmer. The data suggests solar activity is influencing the global climate causing the world to get warmer." (BBC)
At a glance
Thankfully for us, our Sun is a very average kind of star. That means it behaves stably over billions of years, steadily consuming its hydrogen fuel in the nuclear reaction that produces sunshine.
Solar stability, along with the Greenhouse Effect, combine to give our planet a habitable range of surface temperatures. In contrast, less stable stars can vary a lot in their radiation output. That lack of stability can prevent life, as we know it, from evolving on any planets that might orbit such stars.
That the Sun is a stable type of star is clearly demonstrated by the amount of Solar energy reaching Earth's average orbital position: it varies very little at all. This quantity, called the Total Solar Irradiance, has been measured for around forty years with high accuracy by sensitive instruments aboard satellites. Its average value is 1,362 watts per square metre. Irradiance fluctuates by about a watt either way, depending on where we are within the 11-year long sunspot cycle. That's a variation of no more than 0.15%.
From the early 1970s until today, the Solar radiation reaching the top of Earth's atmosphere has in fact shown a very slight decline. Through that same period, global temperatures have continued to increase. The two data records, incoming Solar energy and global temperature, have diverged. That means they have gone in opposite directions. If incoming Solar energy has decreased while the Earth continues to warm up, the Sun cannot be the control-knob of that warming.
Attempts to blame the sun for the rise in global temperatures have had to involve taking the data but selecting only the time periods that support such an argument. The remaining parts of the information - showing that divergence - have had to be ditched. Proper science study requires that all the available data be considered, not just a part of it. This particular sin is known as “cherry-picking”.
Please use this form to provide feedback about this new "At a glance" section, which was updated on May 27, 2023 to improve its readability. Read a more technical version below or dig deeper via the tabs above!
Further details
Our Sun is an average-sized main sequence star that is steadily using its hydrogen fuel, situated some 150 million kilometres away from Earth. That distance was first determined (with a small error) by a time consuming and complex set of measurements in the late 1700s. It led to the first systemic considerations of Earth's climate by Joseph Fourier in the 1820s. Fourier's number-crunching led him to realise a planet of Earth's size situated that far from the Sun ought to be significantly colder than it was. He was thereby laying the foundation stone for the line of enquiry that led after a few decades to the discovery of what we now call the Greenhouse Effect – and the way that effect changes in intensity as a response to rising or falling levels of the various greenhouse gases.
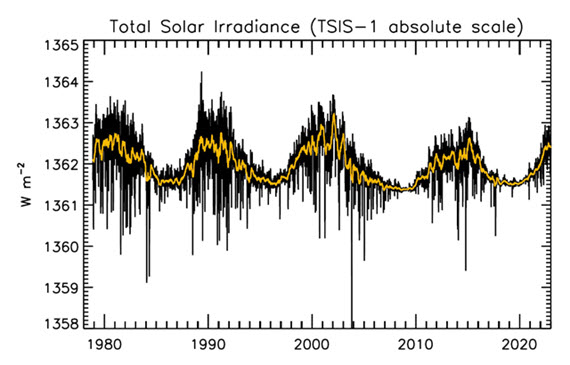
Figure 1: Plot of the observational record (1979-2022) on the scale of the TSIS-1 instrument currently flying on the space station. In this plot, the different records are all cross calibrated to the TSIS-1 absolute scale (e.g., the TSIS1-absolute scale is 0.858 W/m^2 higher than the SORCE absolute scale) so the variability of TSI in this plot is considered to be its “true variability” (within cross calibration uncertainties). Image: Judith Lean.
The Sun has a strong magnetic field, but one that is constantly on the move, to the extent that around every 11 years or so, Solar polarity flips: north becomes south, until another 11 years has passed when it flips back again. These Solar Cycles affect what happens at the surface of the Sun, such as the sunspots caused by those magnetic fields. Each cycle starts at Solar Minimum with very few or no sunspots, then rises mid-cycle towards Solar Maximum, where sunspots are numerous, before falling back towards the end. The total radiation emitted by the Sun – total solar irradiance (TSI) is the technical term – essentially defined as the solar flux at the Earth's orbital radius, fluctuates through this 11-year cycle by up to 0.15% between maximum and minimum.
Such short term and small fluctuations in TSI do not have a strong long term influence on Earth's climate: they are not large enough and as it's a cycle, they essentially cancel one another out. Over the longer term, more sustained changes in TSI over centuries are more important. This is why such information is included, along with other natural and human-driven influences, when running climate models, to ask them, “what if?"
An examination of the past 1150 years found temperatures to have closely matched solar activity for much of that time (Usoskin et al. 2005). But also for much of that time, greenhouse gas concentrations hardly varied at all. This led the study to conclude, "...so that at least this most recent warming episode must have another source."

Figure 2: Annual global temperature change (thin light red) with 11 year moving average of temperature (thick dark red). Temperature from NASA GISS. Annual Total Solar Irradiance (thin light blue) with 11 year moving average of TSI (thick dark blue). TSI from 1880 to 1978 from Krivova et al. 2007. TSI from 1979 to 2015 from the World Radiation Center (see their PMOD index page for data updates). Plots of the most recent solar irradiance can be found at the Laboratory for Atmospheric and Space Physics LISIRD site.
The slight decline in Solar activity after 1975 was picked up through a number of independent measurements, so is definitely real. Over the last 45 years of global warming, Solar activity and global temperature have therefore been steadily diverging. In fact, an analysis of solar trends concluded that the sun has actually contributed a slight cooling influence into the mix that has driven global temperature through recent decades (Lockwood, 2008), but the massive increase in carbon-based greenhouse gases is the main forcing agent at present.
Other studies tend to agree. Foster & Rahmstorf (2011) used multiple linear regression to quantify and remove the effects of the El Niño Southern Oscillation (ENSO) and solar and volcanic activity from the surface and lower troposphere temperature data. They found that from 1979 to 2010, solar activity had a very slight cooling effect of between -0.014 and -0.023°C per decade, depending on the data set. A more recent graphic, from the IPCC AR6, shows these trends to have continued.
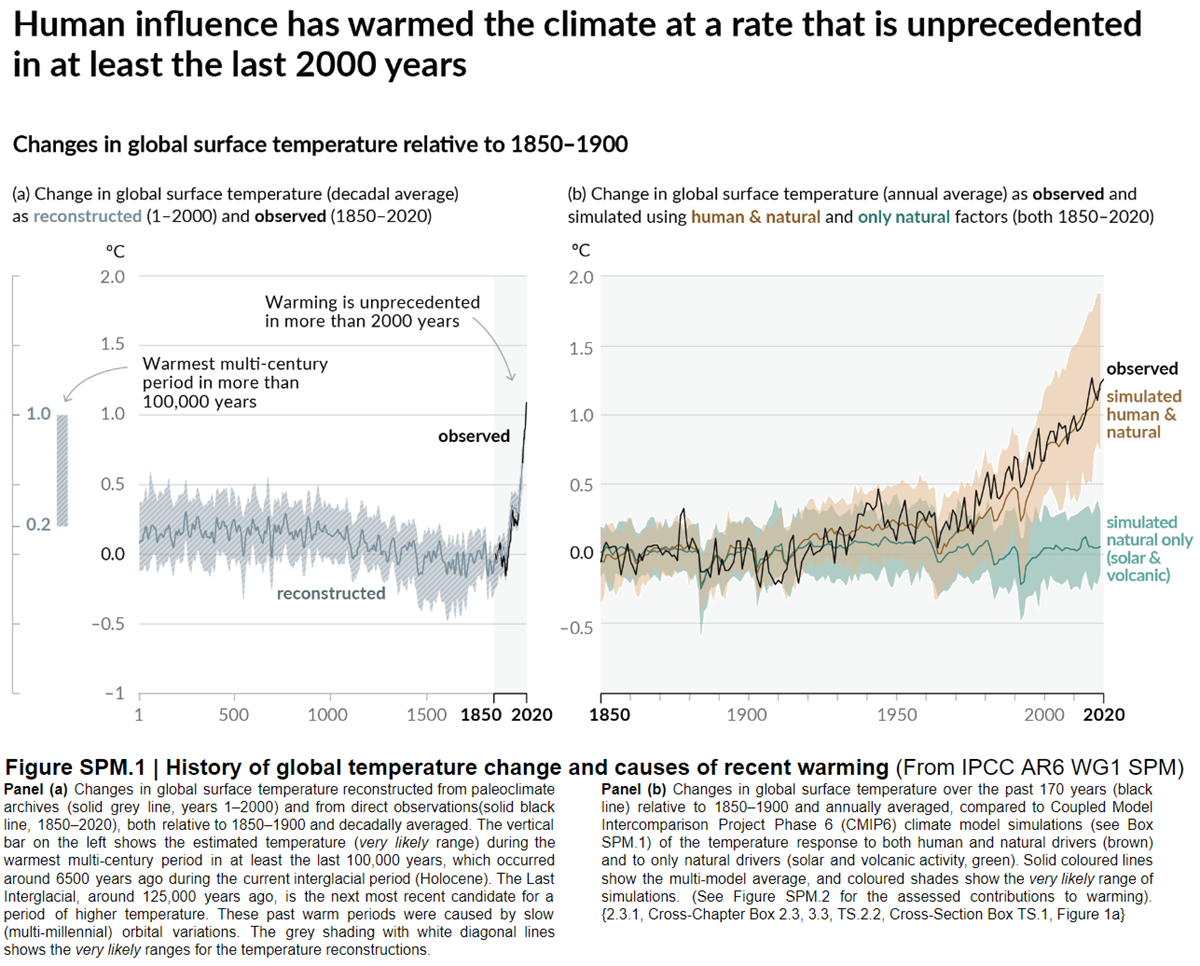
Figure 3: Figure SPM.1 (IPCC AR6 WGI SPM) - History of global temperature change and causes of recent warming panel (b). Changes in global surface temperature over the past 170 years (black line) relative to 1850–1900 and annually averaged, compared to Coupled Model Intercomparison Project Phase 6 (CMIP6) climate model simulations (see Box SPM.1) of the temperature response to both human and natural drivers (brown) and to only natural drivers (solar and volcanic activity, green). For the full image and caption please click here or on the image.
Like Foster & Rahmstorf, Lean & Rind (2008) performed a multiple linear regression on the temperature data, and found that while solar activity can account for about 11% of the global warming from 1889 to 2006, it can only account for 1.6% of the warming from 1955 to 2005, and had a slight cooling effect (-0.004°C per decade) from 1979 to 2005.
Finally, physics does not support the claim that changes in TSI drive current climate change. If that claim had any credence, we would not expect to see the current situation, in which Earth's lower atmosphere is warming strongly whereas the upper atmosphere is cooling. That is exactly the pattern predicted by physics, in our situation where we have overloaded Earth's atmosphere with greenhouse gases. If warming was solely down to the Sun, we would expect the opposite pattern. In fact, the only way to propagate this myth nowadays involves cherry-picking everything prior to 1975 and completely disregarding all the more recent data. That's simply not science.
Longer-term variations in TSI received by Earth
It's also important to mention variations in TSI driven not by Solar energy output but by variations in Earth's orbit, that are of course independent of Solar activity. Such variations, however, take place over very long periods, described by the Milankovitch orbital cycles operating over tens of thousands of years. Those cycles determine the distance between Earth and the Sun at perihelion and aphelion and in addition the tilt the planet's axis of rotation: both affect how much heat-radiation the planet receives at the top of its atmosphere through time. But such fluctuations are nothing like the rapid changes we see in the weather, such as the difference between a sunny day and a cloudy one. The long time-factor ensures that.
Another even more obscure approach used to claim, "it's the sun" was (and probably still is in some quarters) to talk about, "indirect effects". To wit, when studies can't find a sufficiently large direct effect, bring even lesser factors to the fore, such as cosmic rays. Fail.
In conclusion, the recent, post 1975 steep rise in global temperatures are not reflected in TSI changes that have in fact exerted a slight cooling influence. Milankovitch cycles that operate over vastly bigger time-scales simply don't work quickly enough to change climate drastically over a few decades. Instead, the enormous rise in greenhouse gas concentrations over the same period is the primary forcing-agent. The physics predicted what is now being observed.
Last updated on 27 May 2023 by John Mason. View Archives


That chart shows temperatures continuously and sharpely increasing since 1980, that is pure nonsense. The most accurate measurements, satellite measurements, the ones the Clinate Scientists seem to choose to ignore shows flat temperatures from 1980 to 2000, with a few spikes. Then the reletively volcano free 2000 through today shows an increase of 0.2 degrees. As recent as 2008 we were at or below the level of 1980. If the best the (-snip-)highlighted by the original article starting this thread. http://www.drroyspencer.com/latest-global-temperatures/
"The most accurate measurements, satellite measurements, the ones the Clinate Scientists seem to choose to ignore shows flat temperatures from 1980 to 2000, with a few spikes"
Nonsense. UAH, a satellite measurement from climate "skeptics" Roy Spencer and John Christy, shows about .22*C of warming from 1980 to 2000. From 1980 to the present it shows about .42*C. You are completely wrong.
"As recent as 2008 we were at or below the level of 1980."
Nonsense again. 2008 was no where near as cool as 1980.
" If the best the (-snip-) can do is rely on highly innacurate ground measurements they don't have much of a case."
The ground measurements agree very well with the satellite data, which you are obviously are unfamiliar with. Nothing you said above is true. Talk about a . (-snip-)
Robert Wagner @ 1042, those same satellite measurements you claim to be accurate show a TOA energy imbalance: more energy entering the Earth system than leaving it. What do you think is happening to all that extra energy Earth is absorbing, if it is not warming the biosphere?
Robert Wagner @1041, below are 11 year running averages of Gistemp (as used in figure 1 above) post 1950, along with 11 year running averages of RSS and UAH data, all offset to have a common baseline of 1981-2010. As can clearly be seen, the trends of the three are virtualy indistinguishable. Your primary claim is, therefore, patently false.
I will also note that your supposition that the satellite records, by virtue of being satelite records, are more accurate records is unfounded. It is well known that the surface temperature record needs adjustment for the Urban Heat Island (UHI) effect, Time of Observation (TOBS), along with changes of instruments over time. The satellite record, however, invovles adjustments for changes of instruments (as one Satellite is replaced by another), for the fact that the raw data includes a large measure of the cooling stratosphere in its observations, for the fact that the time of observation at any location changes as the satellite orbits , for bias arising from the properties of different surfaces, and their altitudes; and so on. Far more, and far more mathematically challenging mathematical adjustments are required to take raw satellite records and turn them into a temperature record than are required for the surface record.
Below are a list of the main corrections of the main, known errors in the UAH record that have been needed over time (and acknowledged by Roy Spenser). There has been a scientific paper published pointing out yet another apparently needed correction that Dr Spencer does not yet agree with. Only time will tell if he has finally got it about right, or whether yet more corrections will be needed before UAH can finally be considered as accurate as the surface record:
Why are people even debating this The empirical evidence in favor of the solar explanation is overwhelming.
Dozens of peer-reviewed studies have found a very high degree of correlation (.5 to .8) between solar-magnetic activity and global temperature going back many thousands of years (Bond 2001, Neff 2001, Shaviv 2003, Usoskin 2005, and many others listed below). In other words, solar activity “explains,” in the statistical sense, 50 to 80% of past temperature change.
Such a high degree of correlation over such long time periods implies causality, which can only go one way. Global temperature cannot be driving solar activity, so there must be some mechanism by which solar activity is driving or modulating global temperature change. The high degree of correlation also suggests that solar activity is the primary driver of global temperature on every time scale studied (which is pretty much every time scale but the Milankovitch cycle).
In contrast, records of CO2 and temperature reveal no discernable warming effect of CO2. There is a correlation between atmospheric CO2 and temperature, but with CO2 changes following temperature changes by an average of about 800 years (Caillon 2003), indicating that it is temperature change that is driving atmospheric CO2 change (as it should, since warming oceans are able to hold less CO2). This does not rule out the possibility that CO2 also drives temperature, and in theory a doubling of CO2 should cause about a 1 degree increase in temperature before any feedback effects are accounted, but feedbacks could be negative (dampening rather than amplifying temperature forcings), so there no reason, just from what we know about the greenhouse mechanism, that CO2 has to be a significant player. The one thing we can say is that whatever the warming effect of CO2, it is not detectable in the raw CO2 vs. temperature data.
This is in glaring contrast to solar activity, which lights up like a neon sign in the raw data. Literally dozens of studies finding .5 to .8 degrees of correlation with temperature. (-snip-). RF for CO2 is entered as ___ W/m^2 while RF for total solar effects is entered as ___ W/m^2. [I'm not going to quote the actual numbers, but yeah, the ratio is an astounding 40 to 1, up from 14 to 1 in AR4, which listed total solar forcing as 0.12 W/m^2, vs. 1.66 for CO2.]
So the 50% driver of global temperature according to mountains of temperature correlation data is assumed to have 1/40th the warming effect of something whose warming effect is not even discernable in the temperature record. (-snip-).
(-snip-)
Sabre, you did read the intermediate and advanced articles tabbed above, yes? Yes, global temp track solar variation quite well until about 1960. Where is it argued that it doesn't? What happens after 1960, as TSI drops from the modern max, and temp just keeps on rising. You're familiar with Pasini et al. (2012), yes? And the same Usoskin (2005) points out "during these last 30 years the solar total irradiance, solar UV irradiance and cosmic ray flux has not shown any significant secular trend, so that at least this most recent warming episode must have another source."
DSL,
Apparently some people don't feel uncomfortable commenting on posts they haven't read. It gets a bit ridiculous when the post you'd provide them with a link to in order to dispel their misconception is the one they've commented on!
Just out of curiosity, what's the most-commented post here at SkS? This would have to be a contender, which strikes me as amazing because it's one of the most obviously wrong myths yet apparently one of the most fervently argued.
Sabre @1045... Do you honestly believe that the broad scientific community hasn't already considered everything you've stated here before coming to the overwhelming conclusion that human are primarily responsibe for the rise of global temperature of the past 40 years?
Just curious.
JasonB... I was thinking exactly the same thing. Literally, this is probably THE most clearly debunked myths there is in the climate debate. It's stunning that anyone is still clinging to it.