


 Arguments


Sun & climate: moving in opposite directions
What the science says...
| Select a level... |
 Basic
Basic
|
 Intermediate
|
 Advanced
| ||||
|
The sun's energy has decreased since the 1980s but the Earth keeps warming faster than before. |
|||||||
Climate Myth...
It's the sun
"Over the past few hundred years, there has been a steady increase in the numbers of sunspots, at the time when the Earth has been getting warmer. The data suggests solar activity is influencing the global climate causing the world to get warmer." (BBC)
At a glance
Thankfully for us, our Sun is a very average kind of star. That means it behaves stably over billions of years, steadily consuming its hydrogen fuel in the nuclear reaction that produces sunshine.
Solar stability, along with the Greenhouse Effect, combine to give our planet a habitable range of surface temperatures. In contrast, less stable stars can vary a lot in their radiation output. That lack of stability can prevent life, as we know it, from evolving on any planets that might orbit such stars.
That the Sun is a stable type of star is clearly demonstrated by the amount of Solar energy reaching Earth's average orbital position: it varies very little at all. This quantity, called the Total Solar Irradiance, has been measured for around forty years with high accuracy by sensitive instruments aboard satellites. Its average value is 1,362 watts per square metre. Irradiance fluctuates by about a watt either way, depending on where we are within the 11-year long sunspot cycle. That's a variation of no more than 0.15%.
From the early 1970s until today, the Solar radiation reaching the top of Earth's atmosphere has in fact shown a very slight decline. Through that same period, global temperatures have continued to increase. The two data records, incoming Solar energy and global temperature, have diverged. That means they have gone in opposite directions. If incoming Solar energy has decreased while the Earth continues to warm up, the Sun cannot be the control-knob of that warming.
Attempts to blame the sun for the rise in global temperatures have had to involve taking the data but selecting only the time periods that support such an argument. The remaining parts of the information - showing that divergence - have had to be ditched. Proper science study requires that all the available data be considered, not just a part of it. This particular sin is known as “cherry-picking”.
Please use this form to provide feedback about this new "At a glance" section, which was updated on May 27, 2023 to improve its readability. Read a more technical version below or dig deeper via the tabs above!
Further details
Our Sun is an average-sized main sequence star that is steadily using its hydrogen fuel, situated some 150 million kilometres away from Earth. That distance was first determined (with a small error) by a time consuming and complex set of measurements in the late 1700s. It led to the first systemic considerations of Earth's climate by Joseph Fourier in the 1820s. Fourier's number-crunching led him to realise a planet of Earth's size situated that far from the Sun ought to be significantly colder than it was. He was thereby laying the foundation stone for the line of enquiry that led after a few decades to the discovery of what we now call the Greenhouse Effect – and the way that effect changes in intensity as a response to rising or falling levels of the various greenhouse gases.
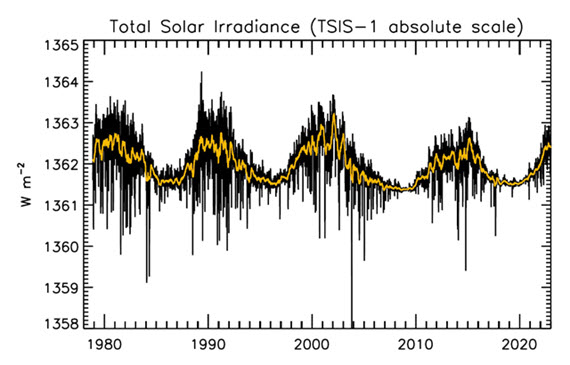
Figure 1: Plot of the observational record (1979-2022) on the scale of the TSIS-1 instrument currently flying on the space station. In this plot, the different records are all cross calibrated to the TSIS-1 absolute scale (e.g., the TSIS1-absolute scale is 0.858 W/m^2 higher than the SORCE absolute scale) so the variability of TSI in this plot is considered to be its “true variability” (within cross calibration uncertainties). Image: Judith Lean.
The Sun has a strong magnetic field, but one that is constantly on the move, to the extent that around every 11 years or so, Solar polarity flips: north becomes south, until another 11 years has passed when it flips back again. These Solar Cycles affect what happens at the surface of the Sun, such as the sunspots caused by those magnetic fields. Each cycle starts at Solar Minimum with very few or no sunspots, then rises mid-cycle towards Solar Maximum, where sunspots are numerous, before falling back towards the end. The total radiation emitted by the Sun – total solar irradiance (TSI) is the technical term – essentially defined as the solar flux at the Earth's orbital radius, fluctuates through this 11-year cycle by up to 0.15% between maximum and minimum.
Such short term and small fluctuations in TSI do not have a strong long term influence on Earth's climate: they are not large enough and as it's a cycle, they essentially cancel one another out. Over the longer term, more sustained changes in TSI over centuries are more important. This is why such information is included, along with other natural and human-driven influences, when running climate models, to ask them, “what if?"
An examination of the past 1150 years found temperatures to have closely matched solar activity for much of that time (Usoskin et al. 2005). But also for much of that time, greenhouse gas concentrations hardly varied at all. This led the study to conclude, "...so that at least this most recent warming episode must have another source."

Figure 2: Annual global temperature change (thin light red) with 11 year moving average of temperature (thick dark red). Temperature from NASA GISS. Annual Total Solar Irradiance (thin light blue) with 11 year moving average of TSI (thick dark blue). TSI from 1880 to 1978 from Krivova et al. 2007. TSI from 1979 to 2015 from the World Radiation Center (see their PMOD index page for data updates). Plots of the most recent solar irradiance can be found at the Laboratory for Atmospheric and Space Physics LISIRD site.
The slight decline in Solar activity after 1975 was picked up through a number of independent measurements, so is definitely real. Over the last 45 years of global warming, Solar activity and global temperature have therefore been steadily diverging. In fact, an analysis of solar trends concluded that the sun has actually contributed a slight cooling influence into the mix that has driven global temperature through recent decades (Lockwood, 2008), but the massive increase in carbon-based greenhouse gases is the main forcing agent at present.
Other studies tend to agree. Foster & Rahmstorf (2011) used multiple linear regression to quantify and remove the effects of the El Niño Southern Oscillation (ENSO) and solar and volcanic activity from the surface and lower troposphere temperature data. They found that from 1979 to 2010, solar activity had a very slight cooling effect of between -0.014 and -0.023°C per decade, depending on the data set. A more recent graphic, from the IPCC AR6, shows these trends to have continued.
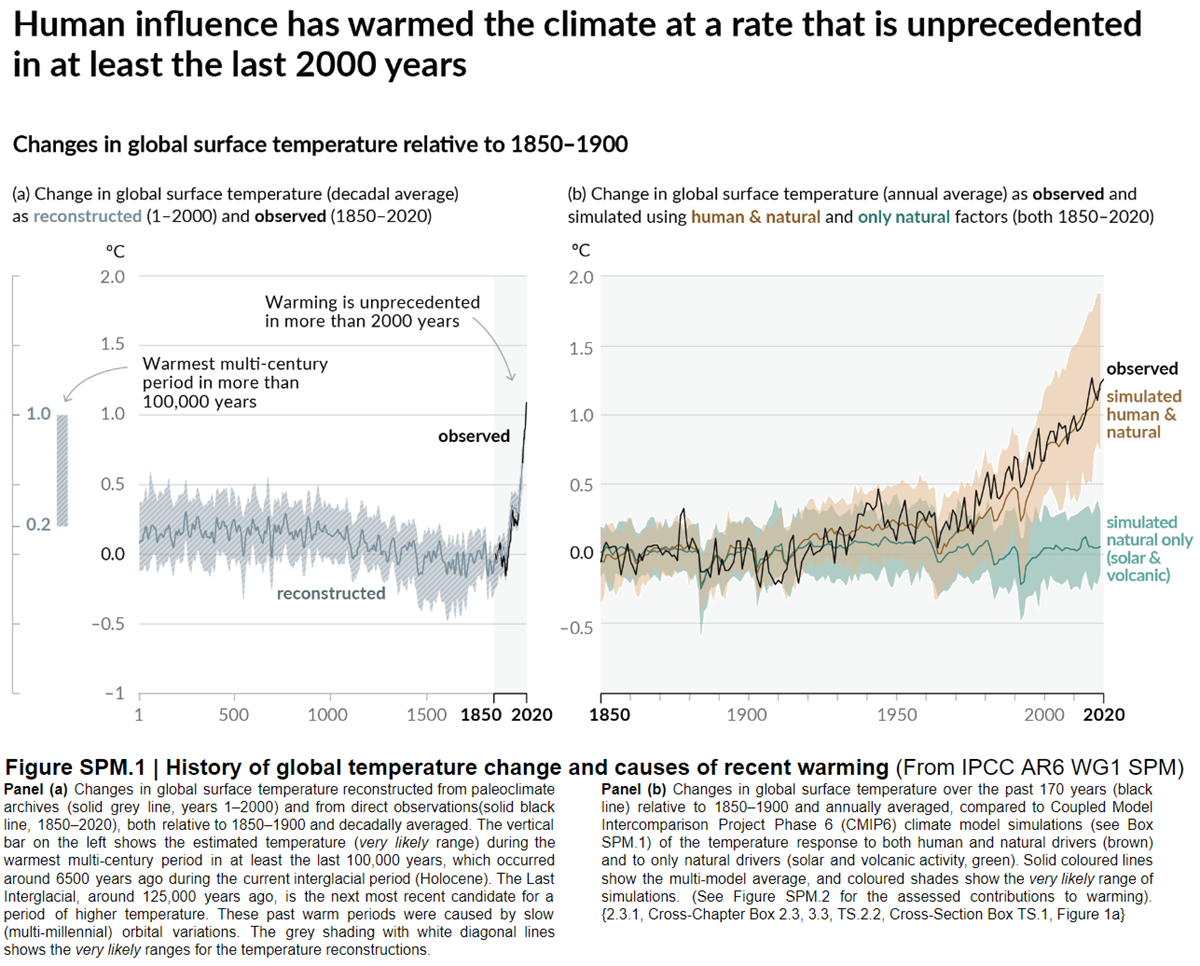
Figure 3: Figure SPM.1 (IPCC AR6 WGI SPM) - History of global temperature change and causes of recent warming panel (b). Changes in global surface temperature over the past 170 years (black line) relative to 1850–1900 and annually averaged, compared to Coupled Model Intercomparison Project Phase 6 (CMIP6) climate model simulations (see Box SPM.1) of the temperature response to both human and natural drivers (brown) and to only natural drivers (solar and volcanic activity, green). For the full image and caption please click here or on the image.
Like Foster & Rahmstorf, Lean & Rind (2008) performed a multiple linear regression on the temperature data, and found that while solar activity can account for about 11% of the global warming from 1889 to 2006, it can only account for 1.6% of the warming from 1955 to 2005, and had a slight cooling effect (-0.004°C per decade) from 1979 to 2005.
Finally, physics does not support the claim that changes in TSI drive current climate change. If that claim had any credence, we would not expect to see the current situation, in which Earth's lower atmosphere is warming strongly whereas the upper atmosphere is cooling. That is exactly the pattern predicted by physics, in our situation where we have overloaded Earth's atmosphere with greenhouse gases. If warming was solely down to the Sun, we would expect the opposite pattern. In fact, the only way to propagate this myth nowadays involves cherry-picking everything prior to 1975 and completely disregarding all the more recent data. That's simply not science.
Longer-term variations in TSI received by Earth
It's also important to mention variations in TSI driven not by Solar energy output but by variations in Earth's orbit, that are of course independent of Solar activity. Such variations, however, take place over very long periods, described by the Milankovitch orbital cycles operating over tens of thousands of years. Those cycles determine the distance between Earth and the Sun at perihelion and aphelion and in addition the tilt the planet's axis of rotation: both affect how much heat-radiation the planet receives at the top of its atmosphere through time. But such fluctuations are nothing like the rapid changes we see in the weather, such as the difference between a sunny day and a cloudy one. The long time-factor ensures that.
Another even more obscure approach used to claim, "it's the sun" was (and probably still is in some quarters) to talk about, "indirect effects". To wit, when studies can't find a sufficiently large direct effect, bring even lesser factors to the fore, such as cosmic rays. Fail.
In conclusion, the recent, post 1975 steep rise in global temperatures are not reflected in TSI changes that have in fact exerted a slight cooling influence. Milankovitch cycles that operate over vastly bigger time-scales simply don't work quickly enough to change climate drastically over a few decades. Instead, the enormous rise in greenhouse gas concentrations over the same period is the primary forcing-agent. The physics predicted what is now being observed.
Last updated on 27 May 2023 by John Mason. View Archives


Jason B @1048, the most commented thread would have to be the 2nd Law of Thermodynamics thread, with (currently) 1424 comments. I suspect this one comes second, although I have not done a survey.
Pretty sure this is No. 2.
I'm also pretty sure Sabre's a drive-by. As I recall, he/she/it drove by over the summer with another bag full of wonders.
Sabretruthtiger wrote: "The high degree of correlation also suggests that solar activity is the primary driver of global temperature on every time scale studied (which is pretty much every time scale but the Milankovitch cycle)."
As others have noted, the period since ~1960 is another time scale where solar activity is clearly not the primary driver of temperature change. However, it is interesting that you were apparently aware that your argument did not hold true for the Milankovitch cycles... yet apparently couldn't make the connection between CO2 being the primary driver of temperature changes there and the 'recent time scale' link between increasing CO2 and temperature.
So yes, if we ignore every time scale at which solar activity was not the primary driver of temperature changes then we would conclude that solar activity is always the primary driver of temperature changes. We would just be wrong. As your argument clearly is.
I thought that both the IPCC and NASA have admitted that the Sun plays a much more major role then previously thought.
Is this true?
Kevin, while the regular commenters on this site will be more than happy to address your concerns, they do expect you to read the main articles (basic, intermediate, and advanced). The people at NASA are among those who have contributed to the studies upon which the main articles are based. Further, if you have a specific piece of information--a quote, for example--that is driving your questioning, please link to it so that we don't have to rely on a vague reference in a single sentence.
Kevin,
"Admitted"? What, as if they've been caught trying to Global Swindle people?
I have an idea... actually read and learn, instead of throwing lame denier slogans around.
Kevin:
It seems to me that it would be hard for NASA or anyone else to admit that the Sun plays a much larger role in influencing Earth's climate than has already been known since... well probably since we had a concept of Earth-system climate.
Close to 100% of the incoming energy flux that affects the Earth climate comes from the Sun. However, this energy flux is close to constant at decade-to-century timescales, with limited variation (the solar cycle) at annual-to-decade timescales and slow but consistent increase over millions of years. Do you have references to anyone at NASA or any IPCC documentation seriously contesting this?
The concern with climate change has to do with greenhouse gases involves their effect on the Earth's outgoing energy flux. Which, to my knowledge, the Sun has very little to do with.
The important thing to remember is that both the incoming and outgoing energy fluxes affect Earth climate.
composer99
I posted this link to a serious study of solar activity from evidence found in ice cores. It is relevant as it is documented data taken from the last millenia of solar activity.
The authors concluded "In conclusion, we have presented here a new reconstruction of solar activity on the millennium time scale based upon a description of the related physical processes. It implies that the present high level of sunspot activity is unprecedented on the millennium time scale. The results will be the subject of further analysis."
Sapa[ronia?]:
The paper you cite does not change or rebut the most important statement in my comment:
As the moderator indicates, any discussion pertinent to the paper you describe is best left to the other thread.
Whenever you see a chart that has unlike elements, i.e. W/m2 and temp C, on the Y axis superimposed ( -snip-) and they are not expressed in terms of percentage of change then you are witnessing propaganda.
fmbatchelor @1060, really? So when I carefully scale change in ppmv of CO2 concentration and change in temperature in degrees C such that a the predicted transient climate responce in temperature for a given change in concentration matches the temperature scale, that would constitute propoganda in your book? Where as if I scaled them so that a change of 1 ppmv in CO2 concentration (0.25%) matches a change in temperature of 0.72 K (0.25%) that would not constitute propoganda, even though the later change in temperature is only predicted for an approx 90 ppmv change in concentration for the transient response? Frankly, I consider your suggestion absurd, and it is not one applied (to my knowledge) in any science. Indeed it could not be.
As it happens, the graph I take it you are criticizing has the scale it does because that is the scale chosen by advocates of the sun being the cause of the current warming to make their case. They now face a dilemma. If that scale is correct, than the lack of correlation after 1980 refutes their claim. If, on the ohter hand, the scale is incorrect, then they have established no relation between solar activity and temperature to begin with.
fmbatchelor @1060:
OK. If what you say is true, then can you tell what the percentage change in temperature is when the absolute change is:
a) 0C to -10 C
b) -10C to 0C?
c) +5C to -5C?
d) -5C to +5C?
Or perhaps you'd like to reword your claim?
...and following up on what I asked in #1062:
If you provide the request % changes, then can you also tell me what the % change is for the following?
a) 32F to 14F?
b) 14F to 32F?
c) 41F to 23F?
d) 23F to 41 F?
...and if they are not the same as the % for the examples in degrees C, can you explain why?
I love that when such a graph clarifies a scientific point, it's propaganda, but when it appears to prove that all of the world's climate sceintists are engaged in a gigantic hoax-conspiracy, it's laudable citizen science.
And these people don't recognize their irrational, internal bias.
I think it is inappropiate to name this forum topic as 'It's the Sun'. This forum shows confusion amoung a lot of smart people. For people who have no scientific background it is hard to establish what this phrase means. If anything it would confuse an average person. Planet Earth's life has a timer as the sun progresses to become a red giant(the luminousity becomes greater with time). This does not mean that we should not take into consideration that the unregulated pumping of greenhouse gases can destroy the current equilbrium we have. Essentially scienitists are worried about the equilbrium (positive and negative feedbacks) of our system. Our fossil fuel emissions lead to an imbalance of this equilbrium. This imbalance can potentially lead to a positive feedback that quickly changes the state of the system. This is where the danger is. Climate change is a confusing topic for most and the anger towards 'deniers' is unwarrented. The solution to climate change is easy in my eyes. Transfer all that energy that you put into proving climate change into creating a new energy source that is more efficient than fossil fuels. Peak oil tells us that fossil fuels are finite. Energy gradients are not (solar, wind and many others yet to be discovered). Stop using fear mongering on both sides, it is unnessary. A fearful public is a public more likely to make bad decisions. There is nothing to worry about. Technology and science will solve this little problem called climate change. That is my life's pursuit as a scientist.
kcron24 @1065, not only does the sun have a timer as it proceeds towards the red giant stage, in just over five billion years, or ten times longer than there has been vertebrate life on Earth, but it is also gradually warming over time. Four billion years ago, it only gave of 70% of its current light, whereas in a mere 3.5 billion years it will drive the Earth into a runaway greenhouse effect.
So how long will this warming sun take to reach an increase in luminosity equivalent to the doubling of CO2? Approximately 300 million years! Three hundred million years ago the first vertebrates land animals were just evolving. That is a period more than a thousand times longer than Homo sapiens have existed. Yet that is the time period before the increase in solar luminosity will match the threat we expect from increased CO2 in just this century.
Given the time scales evovled, perhaps we can wait before tacking increases in solar lumnosity, and concentrate, in the mean time, on more pressing problems.
Please reread my comment. I feel climate sciencitists have great work but a terrible way of handling climate change. Using fear to intimidate people only makes matters worse... Eduation is key not brainwashing. There is where the debate is. That is all I'm saying.
kcron24 - I would encourage you to read the IPCC WG1 scientific basis reports, you will find that the scientists presentations are generally rather moderate. I would start with the 1990 report as this is written in rather less technical language than subsequent editions (which have become increasingly terse due to the increase in the amount of research that has been performed). In particular they explicitly discuss the uncertainties.
Of course many climate blogs do not present the science that way, but as a clear statement of the mainstream position is freely available on the WWW (i.e. the IPCC reports), you can always verify the truth for yourself.
All this article is doing is explaining how it is we can be pretty sure that the warming we have seen in recent decades is not caused by solar activity. I personally don't see how this can be described as "fear mongering". SkS is a site for discussing the science, so if you don't want to talk about the science relating to the effect of solar activity on climate, then please find a more appropriate article for your comments. Posting comments that are off-topic is disruptive behaviour, and is likely to result in attention from the moderators.
kron24... It would be, likewise, completely irresponsible for scientists to not warn people of an imminent crisis when evidence shows that one is present.
The overwhelming evidence of a crisis is there. That you refer to it as a "little problem" reveals your inadequate understanding of the full body of research.
(-snip-)
I understand that its best to prepare for the worst but its also important to hope for the best. By the way I've read all the IPCC reports and I thought they were very good but they might want to update some of their eariler estimates of warming. (-snip-)
kcron, did you read the intermediate and advanced tabs of this article?
Further, the studies you mention are getting rather dated. You should visit this page and its comment stream (and this one).
Also, "deniers" are not people who present a well-reasoned, evidence-based argument for low sensitivity. "Deniers" are people who misrepresent science and then refuse to acknowledge evidence-based correction of their misrepresentations. They engage in baseless denial.
What's your argument for low sensitivity (i.e. "little problem")? (respond on the appropriate thread -- not this one)
kcron24 @1070:
1) Given that we have had debated in comments on this forum suggestions that the current warming is due to radar, that the Earth is warmed by geothermal heat, not the sun, and innumerable people arguing that the second law of thermodynamics refutes the greenhouse effect, your suggestion that people "always follow the truth" is naive at best. More importantly, I know of no better term than denier for people so set against accepting the science for whatever reason that they can promote such absurdities.
More importantly, I have repeatedly seen leaders among the deniers such as Christopher Monckton make false assertions, they truth of which they clearly have not checked (on a generous interpretation) simply to vilify scientists and those warn the public about AGW. They also accuse scientists of fraud either as part of a machiavalian conspiracy, or simply for monetary gain; and accuse scientists of lying simply for telling the truth. You yourself, in the very post where you complain about abuse of "deniers", hint that scientists are committing fraud to stay on the gravy train. And against that torrent of abuse and calumny, we apparently "abuse" those who deny the science by calling them "deniers". We turn the verb of their actions into a noun.
Clearly you do not know what abuse is. Indeed, given your own little sally, you are hypocritical in your protestations about abuse.
2) I find it amusing that you should copy and past a bibliography to back up your scientific credentials without having even noticed that the last item on the bibliography refers to a satellite mission that failed at launch. Perhaps a bit more thought about the contents of that bibilography, and a bit less pontificating is in order.
3) Apart from one an oblique reference in the first paragraph of your first post, your entire commentary has been off topic for this thread. There is a reason for the rule that you should stay on topic, and even if you disagree with that reason, as a guest here you are obliged to accept the rules of your host. Please make the attempt to do so.
kchron24 @1072:
What? Articles in Nature and Science aren't good enough for you.
More importantly, this appears to be an admission that you are commenting on the contents of this page without having read the contents of this page. So, which is it. Is your claim false; or should you be banned from further commentary here as your refusal to read the articles you are commenting on means you are inevitably off topic, and vacuously pontificating.
(-snip-)
Sun is the dominant energy source for life on planet Earth. According to Intergovernmental Panel on Climate Change (IPCC), the Sun’s radiation provides around 10,000 times more energy to Earth’s climate system than any other energy source (IPCC 2007). Due to the magnitude of the Sun’s energy, small fluctuations of Since solar radiation is not constant, due to sunspots and other solar phenomena, changes in incoming solar radiation can occur. Collecting such data is imperative for climate research and radiative budget modeling.
Measurements of total solar irradiance began with the ERB satellite in 1979 and continued with ACRIM series of measurements. Ten years ago NASA launched the Solar Radiation and Climate Experiment or SORCE into orbit. This satellite provides measurements of solar radiation from 1nm to 2000nm, encompassing 95% of the electromagnetic spectrum. Instruments on SORCE such as the Total Irradiance Monitor (TIM) allow the measurement of spectrally integrated solar radiation incident at the top of the Earth's atmosphere.
Background
Keeping human consumption in equilibrium with Earth’s climate system to prevent extreme positive feedbacks remains as one of today’s paramount challenges. Anthropogenic gases such as CO2 contribute to the climate change through the greenhouse effect. There has been an increase of about 0.8 K since preindustrial times. However, the current climate sensitivity in climate models indicates that the forcing by greenhouse gases would have contributed to a rise of 2.1 K (range 1.5–3.2 K) (Schwartz et al. 2010). In the IPCC Third Assessment Report (TAR), the IPCC recognizes that there is more work to be done to understand solar variation and its effect on climate change (Forster et al. 2007). However the IPCC mentions that the effect of greenhouse gases plays a bigger role in recent warming than solar variation.
Gaining more knowledge on climate sensitivities will provide added momentum of restructuring the current dependence on fossil fuels. Some estimate this knowledge to be in the tens of trillions of dollars (Edmonds and Smith 2006). According to Hansen et al., uncertainties with the current knowledge of aerosol radiative forcing and solar irradiance limit the ability of current climate models to accurately predict with high confidence (Hansen et al. 2007). Suspect data collected by SORCE and other total solar irradiance monitors show that uncorrected instrumental drifts could contribute to errors in TSI trends (Kopp and Lean 2011). The small data set of 33 years and the imprecise measurements further contribute to unreliable trends and analysis (Kopp and Lean 2011).
In order to alleviate this problem more data needs to be collected with better equipment. Unfortunately, an improved version of SORCE with an upgraded TIM called Glory, never had an opportunity to make a measurement. Glory crashed shortly after launching costing NASA 435 million dollars. SORCE continues to be the main TSI collector. The future TIM measurement goals of 0.01% uncertainties with stabilities
[Sph] Corrupted comment corrected.