


 Arguments


Sun & climate: moving in opposite directions
What the science says...
| Select a level... |
 Basic
Basic
|
 Intermediate
|
 Advanced
| ||||
|
The sun's energy has decreased since the 1980s but the Earth keeps warming faster than before. |
|||||||
Climate Myth...
It's the sun
"Over the past few hundred years, there has been a steady increase in the numbers of sunspots, at the time when the Earth has been getting warmer. The data suggests solar activity is influencing the global climate causing the world to get warmer." (BBC)
At a glance
Thankfully for us, our Sun is a very average kind of star. That means it behaves stably over billions of years, steadily consuming its hydrogen fuel in the nuclear reaction that produces sunshine.
Solar stability, along with the Greenhouse Effect, combine to give our planet a habitable range of surface temperatures. In contrast, less stable stars can vary a lot in their radiation output. That lack of stability can prevent life, as we know it, from evolving on any planets that might orbit such stars.
That the Sun is a stable type of star is clearly demonstrated by the amount of Solar energy reaching Earth's average orbital position: it varies very little at all. This quantity, called the Total Solar Irradiance, has been measured for around forty years with high accuracy by sensitive instruments aboard satellites. Its average value is 1,362 watts per square metre. Irradiance fluctuates by about a watt either way, depending on where we are within the 11-year long sunspot cycle. That's a variation of no more than 0.15%.
From the early 1970s until today, the Solar radiation reaching the top of Earth's atmosphere has in fact shown a very slight decline. Through that same period, global temperatures have continued to increase. The two data records, incoming Solar energy and global temperature, have diverged. That means they have gone in opposite directions. If incoming Solar energy has decreased while the Earth continues to warm up, the Sun cannot be the control-knob of that warming.
Attempts to blame the sun for the rise in global temperatures have had to involve taking the data but selecting only the time periods that support such an argument. The remaining parts of the information - showing that divergence - have had to be ditched. Proper science study requires that all the available data be considered, not just a part of it. This particular sin is known as “cherry-picking”.
Please use this form to provide feedback about this new "At a glance" section, which was updated on May 27, 2023 to improve its readability. Read a more technical version below or dig deeper via the tabs above!
Further details
Our Sun is an average-sized main sequence star that is steadily using its hydrogen fuel, situated some 150 million kilometres away from Earth. That distance was first determined (with a small error) by a time consuming and complex set of measurements in the late 1700s. It led to the first systemic considerations of Earth's climate by Joseph Fourier in the 1820s. Fourier's number-crunching led him to realise a planet of Earth's size situated that far from the Sun ought to be significantly colder than it was. He was thereby laying the foundation stone for the line of enquiry that led after a few decades to the discovery of what we now call the Greenhouse Effect – and the way that effect changes in intensity as a response to rising or falling levels of the various greenhouse gases.
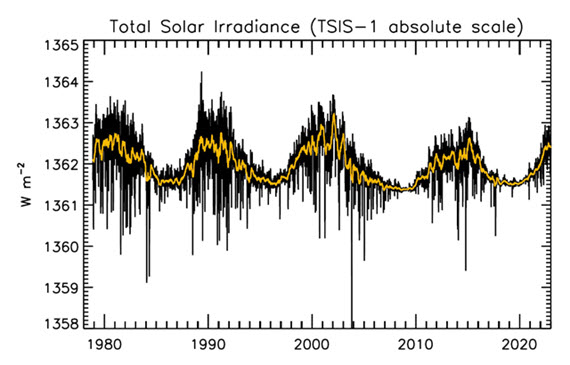
Figure 1: Plot of the observational record (1979-2022) on the scale of the TSIS-1 instrument currently flying on the space station. In this plot, the different records are all cross calibrated to the TSIS-1 absolute scale (e.g., the TSIS1-absolute scale is 0.858 W/m^2 higher than the SORCE absolute scale) so the variability of TSI in this plot is considered to be its “true variability” (within cross calibration uncertainties). Image: Judith Lean.
The Sun has a strong magnetic field, but one that is constantly on the move, to the extent that around every 11 years or so, Solar polarity flips: north becomes south, until another 11 years has passed when it flips back again. These Solar Cycles affect what happens at the surface of the Sun, such as the sunspots caused by those magnetic fields. Each cycle starts at Solar Minimum with very few or no sunspots, then rises mid-cycle towards Solar Maximum, where sunspots are numerous, before falling back towards the end. The total radiation emitted by the Sun – total solar irradiance (TSI) is the technical term – essentially defined as the solar flux at the Earth's orbital radius, fluctuates through this 11-year cycle by up to 0.15% between maximum and minimum.
Such short term and small fluctuations in TSI do not have a strong long term influence on Earth's climate: they are not large enough and as it's a cycle, they essentially cancel one another out. Over the longer term, more sustained changes in TSI over centuries are more important. This is why such information is included, along with other natural and human-driven influences, when running climate models, to ask them, “what if?"
An examination of the past 1150 years found temperatures to have closely matched solar activity for much of that time (Usoskin et al. 2005). But also for much of that time, greenhouse gas concentrations hardly varied at all. This led the study to conclude, "...so that at least this most recent warming episode must have another source."

Figure 2: Annual global temperature change (thin light red) with 11 year moving average of temperature (thick dark red). Temperature from NASA GISS. Annual Total Solar Irradiance (thin light blue) with 11 year moving average of TSI (thick dark blue). TSI from 1880 to 1978 from Krivova et al. 2007. TSI from 1979 to 2015 from the World Radiation Center (see their PMOD index page for data updates). Plots of the most recent solar irradiance can be found at the Laboratory for Atmospheric and Space Physics LISIRD site.
The slight decline in Solar activity after 1975 was picked up through a number of independent measurements, so is definitely real. Over the last 45 years of global warming, Solar activity and global temperature have therefore been steadily diverging. In fact, an analysis of solar trends concluded that the sun has actually contributed a slight cooling influence into the mix that has driven global temperature through recent decades (Lockwood, 2008), but the massive increase in carbon-based greenhouse gases is the main forcing agent at present.
Other studies tend to agree. Foster & Rahmstorf (2011) used multiple linear regression to quantify and remove the effects of the El Niño Southern Oscillation (ENSO) and solar and volcanic activity from the surface and lower troposphere temperature data. They found that from 1979 to 2010, solar activity had a very slight cooling effect of between -0.014 and -0.023°C per decade, depending on the data set. A more recent graphic, from the IPCC AR6, shows these trends to have continued.
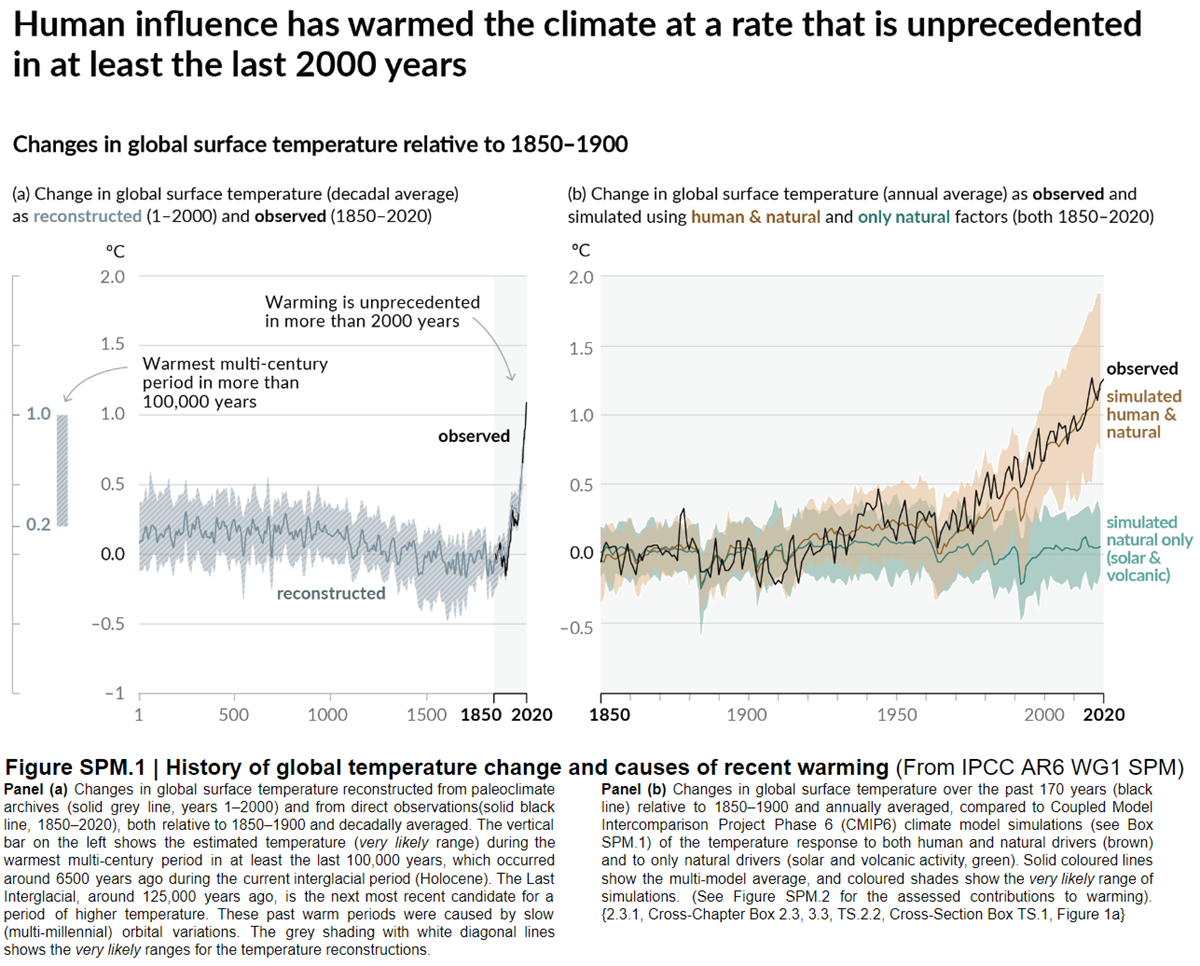
Figure 3: Figure SPM.1 (IPCC AR6 WGI SPM) - History of global temperature change and causes of recent warming panel (b). Changes in global surface temperature over the past 170 years (black line) relative to 1850–1900 and annually averaged, compared to Coupled Model Intercomparison Project Phase 6 (CMIP6) climate model simulations (see Box SPM.1) of the temperature response to both human and natural drivers (brown) and to only natural drivers (solar and volcanic activity, green). For the full image and caption please click here or on the image.
Like Foster & Rahmstorf, Lean & Rind (2008) performed a multiple linear regression on the temperature data, and found that while solar activity can account for about 11% of the global warming from 1889 to 2006, it can only account for 1.6% of the warming from 1955 to 2005, and had a slight cooling effect (-0.004°C per decade) from 1979 to 2005.
Finally, physics does not support the claim that changes in TSI drive current climate change. If that claim had any credence, we would not expect to see the current situation, in which Earth's lower atmosphere is warming strongly whereas the upper atmosphere is cooling. That is exactly the pattern predicted by physics, in our situation where we have overloaded Earth's atmosphere with greenhouse gases. If warming was solely down to the Sun, we would expect the opposite pattern. In fact, the only way to propagate this myth nowadays involves cherry-picking everything prior to 1975 and completely disregarding all the more recent data. That's simply not science.
Longer-term variations in TSI received by Earth
It's also important to mention variations in TSI driven not by Solar energy output but by variations in Earth's orbit, that are of course independent of Solar activity. Such variations, however, take place over very long periods, described by the Milankovitch orbital cycles operating over tens of thousands of years. Those cycles determine the distance between Earth and the Sun at perihelion and aphelion and in addition the tilt the planet's axis of rotation: both affect how much heat-radiation the planet receives at the top of its atmosphere through time. But such fluctuations are nothing like the rapid changes we see in the weather, such as the difference between a sunny day and a cloudy one. The long time-factor ensures that.
Another even more obscure approach used to claim, "it's the sun" was (and probably still is in some quarters) to talk about, "indirect effects". To wit, when studies can't find a sufficiently large direct effect, bring even lesser factors to the fore, such as cosmic rays. Fail.
In conclusion, the recent, post 1975 steep rise in global temperatures are not reflected in TSI changes that have in fact exerted a slight cooling influence. Milankovitch cycles that operate over vastly bigger time-scales simply don't work quickly enough to change climate drastically over a few decades. Instead, the enormous rise in greenhouse gas concentrations over the same period is the primary forcing-agent. The physics predicted what is now being observed.
Last updated on 27 May 2023 by John Mason. View Archives


Bill,
Could you put some numbers to that delta uncertainty please. Clearly as my post shows, they are making calibration adjustments (obviously at least in part due to the reasons you posted) and have quantified their estimate of long-term relative uncertainties. Where are your numbers? And how much difference between yours and theirs?
Thanks
Hello "Eclectic". You are spot-on correct about me making no claims about either increased or decreased TSI being reliably measured by these instruments. I am simply saying that this "data point" does not exist, one way or the other.
As for ground instruments, even if they could be reliably calibrated to the 0.01% stability requirement (which in itself is dubious), the atmospheric induced variablities in ground based TSI measuement are enormous compared to the stability requirement, even if averaged over time. I am unaware of anyone that has established the ability to reliably ground measure long term TSI changes to the precision required.
As someone who spent a career dealing with optical stability issues, I can not overemphasize just how dramatically difficult it is to achieve 0.01% long term optical stability of radiometric instrumentation, even under the best of circumstances. Some scientists believe their instruments are a lot more optically stable than they are, and then we engineers have to present them with the "realities" of practical radiometry "in the field" to set them straight (I'm not picking on scientists here, oops, maybe I am, hehe). I hope some of the TIM folks aren't making any "overblown" claims about their instrument, or the similar previous ones. It seems though that some do indeed appreciate the difficulties involved, to the point of saying "it's not reliably stable enough."
I'll address the stratospheric cooling issue in my next post.
Bill,
In the graph of TSI in the intermediate OP their data goes back to 1880, well before satellite measurements. In the link to their data (Krivova 2007) they describe a model that estimates the TSI based on a series of ground based measurements. I am not expert like you, but it seems to me that your argument that the satellites are not stable enough for the displayed data is moot since the data is not satellite based. Perhaps they use the satellites to ground truth the model? Can you address the issues with the model used to generate the graph of the data? Obviously it is best if you have a direct measurement but for the period before satellites you have to use the data you have and a model. The described calibration issues of the satellites are much higher than the changes in the TSI over the period of observation. Since it is based on ground measurements can the model be used to correct the calibration errors of the satellites?
It seems reasonable to me that if you had 30 years of satellite data you could calibrate a model that would generate data covering the period before you had the satellite data. For the climate argument they do not require the model to be absolutely correct, they only need relative TSI to determine if the warming correlates with TSI.
In the linked data source they describe several models of TSI that are used to generate data over various time periods before we had satellite or ground based machne based TSI measurements.
Hey again @Eclectic. I decided to make a separate post on the stratospheric cooling issue to keep the TSI instrumentation optical stability postings separate.
My background for this issue: Masters degree in Physics. As an optical engineer, developed and/or utilized thermal modelling of spaceborne instruments and spacecraft that were heated by the Sun and cooled by their emitted IR radiation, determining then their internal and surface temperature environments under solar variations induced by spacecraft orbital and orientational changes.
Opinion on maturity of science: As far as I can tell, the science and modelling of solar induced warming of our Earth, especially when combined with the influences of greenhouse gasses present (manmade or natural), has not matured to the point to be able to definitavely conclude that the observed temperature distributions in our atmosphere indicate that manmade greenhouse gas emmisions are responsible for the observed global warming as opposed to a long term TSI increase. Heck, even a few years ago the "official" (IPCC) position was that solar TSI changes had essentially no influence on the Earth's temperature. Only recently then has the science matured to the point that it is now understood that long term TSI changes could indeed significanly change the average Earth temperature. Having only just found this out, claims then that the science has matured so rapidly since this discovery as to be able to distinguish between TSI based changes in our atmosphere and greenhouse gas based changes, seems highly dubious.
"Mixing" issue: Has the recent modelling included the effects of "chaotic mixing" of the stratoshere with the rest of the atmosphere. After all, this is long term warming we are talking about. Certainly the daily winds will "churn" the entire atmosphere to the point as to "swamp" layered atmospheric temperature predictions of one model vs another.
Greenhouse gas perturbation: Assuming that the above "mixing" issue has been properly accounted for, there is still the issue of greenhouse gas induced perturbation in the atmospheric temperature distribution. This will occur even if a solar TSI increase is causing the warming. So when modelling solar induced heating, the "atmospheric layering effect" of the natural greenhouse gasses present must still be included. My suspicion is that this is not being done by the folks attmpting to differentiate between solar and manmade greenhouse gas warming. It is simply a mistake then to model solar warming without including the "atmospheric layering effect" of the natural greenhouse gas that is always present. Once this effect has been properly included in the modelling, I strongly suspect that there will not be a significant difference between the predicted stratospheric cooling of the solar warming model and the manmade greenhouse gas model. As is well understood, long term geologic records show that natural greenhouse gas levels will indeed rise and fall with the Earth's temperature, regardless of the reason for the temperature change. So even if the warming is solar induced, don't forget to include the measured increase in greenhouse gas levels that go along with it.
Opinion: So IMHO, it can not be concluded at this point in our science and modelling, that the observed stratosperic temperatures indicate that the warming is due to manmade greenhouse gas increases as opposed to solar warming.
Hi RedBaron,
Unfortunately, there are scant numbers available, either from me or the instrument engineers/scientists for that matter, quantifying the degree of optical changes for some of the effects I have mentioned. That is indeed the problem.
For instance, I can assure you that no one has a handle on how much TSI is being lost by buildup of outgassing contamination on the specular optical surface of the cone traps of these instruments. Outgassing of even "clean" materials can be significant over time, with for instance even MIL-SPEC anodized aluminum coatings (typically used to make baffle chambers from) significantly varying in outgassing from one production batch to another, and from one type of cleaning procedure to another. Even though the FOV (Field of View) of the instrument picks up only a small fraction of the solar disk, so that the solar light intensity at the cone is only a small fraction of the full TSI, the instrument has to stay on for a while in order to come to thermal equilibrium when making a measurement (thermal equilibrium under loading is the basis for making the measurement). The result is that over time, the integrated solar power is enough to "fry" the contamination many many times over, turning it into diffusely reflecting "gue." No objective experienced optical engineer would ever be comfortable making the claim that even this one effect was contained within the required <0.01% degredation level, not without extensive testing such as use of the groundbased twin witness instrument placed in a vacuum and hit with a solar simulator. Even then, outgassing distributes differently when in 1g on Earth and weightless in space, so use of the witness to quantify this effect is "sketchy" at best (assuming the same production run and cleaning procedure was used for the chamber materials of both).
I hope the above example gives you a feel for what you're up against when attempting to achieve <0.01% optical stability. I can tell you that in the business, the way the game is played when such dramatically small radiometric stability errors are required, is that the instrument builder/user must prove that it is that stable, not that those of us that scoff at their overblown claims must come up with numbers indicating that it is not.
Hi Micheal,
You have hit the nail on the head bringing up the other measurements spanning since well before the satellite measurements. Indeed, a key reason for me "throwing out" reliance on the satellite measured TSI changes, is to force reliance on just the ground based measurements you are talking about.
These measuremnts primarily fall into two groups: accurate measurements of sunspots and faculae since around 1850; measurements of carbon-14 levels in tree rings going back much further.
On the sunspot/faculae measurements, the best solar modelling to date establishes a causal relationship between average magnetic flux in the solar outer layer (averaged over the 11yr sunspot cycles), and the "amplitude" of the sunspot cycles, with a higher amplitude meaning a higher magnetic flux. In turn, the solar modelling also establishes a causal relationship between the average magnetic flux and the TSI, with a higher flux meaning a higher TSI. Now until the latest sunspot cycle, the cycle "amplitude" (variation in areal sunspot/faculea coverage) has been observed to increase since the beginning of when such measurements were made starting around 1850. Using the latest greatest TSI vs magnetic flux vs sunpot cycle amplitude modelling, the predicted averaged TSI has increased on the order of 0.1% from 1850 to present. Based on our latest greatest atmospheric temperature modelling under solar loading, this predicts beautifully the observed solar warming of about 0.7C from 1850 to present. So there you go. Once you throw out the unreliable satellite data, then the observed global warming since 1850 is completely explained by the observed/modelled solar TSI increase, down to evidently the observed "stratospheric cooling" by including the above mentioned "atmospheric layering effect" of the natural greenhouse gas that is always present.
The carbon-14 data is used to determine past TSI levels by using modelling in which the cosmic rays inducing carbon-14 production, are partially "blocked" by solar wind production that has a known causal relationship with sunspot activity. The carbon-14 is absorbed by trees as they grow, with the tree rings giving a timeline for the past carbon-14 presence in our atmosphere. This then is used to infer past sunspot and solar wind activity, which infers then past TSI levels. The resultant historical TSI levels inferred from this technique, fit beautifully with the TSI levels based on the directly observed sunspots since 1850 to present, providing then key support for the conclusion that the observed global warming is solar induced.
With my principle goal at this website established, mainly throwing out reliance on the satellite data, the onus on folks thinking that the observed global warming is due to manmade greenhouse gas emissions, is to prove that it is NOT indeed due to a solar TSI increase since the mid-1800's, as this is the most straightforward conclusion that can be made based on the best modelling and science we have to date.
Bill,
It strikes me that you are speaking with a great deal of confidence for someone who has not read very much about AGW.
In the Scientific Guide to Global Warming Skepticism, there is an illustration at the bottom of page 3 that shows why we know without doubt that the warming is due to carbon dioxide and not the sun. If the Sun was causing warming we would expect days to warm faster than nights, summer faster than winter, the stratosphere to warm with the troposphere, the same amount of heat to be returning to Earth as backradiation, the same heat escaping to space and several others. We measure that nights are warming faster than days, winter is warming faster than summer, the stratosphere is cooling as the troposphere warms, more backradiation, and less heat is escaping to space. You will have to counter all of these observations if you wish to support your claim that unmeasured TSI increase could be the cause of warming.
I suggest that you forget all the propaganda that you have read at WUWT and other skeptical sites and try reading the Newcomers Start Here post on the home page. If you continue to post here with claims supported only by your opinion you will not get very far. Your opinion as an engineer about TSI measurements does not count much against the observations I have summarized above. It is not necessary to have any TSI measurements to be sure that the warming is caused by carbon dioxide pollution and not the Sun.
Keep in mind that the warming caused by carbon dioxide pollution was predicted in 1896 by Arhennius. Arhennius predicted most of the observations that I listed above 100 years before they were measured. You are countering a 120 year old scientific prediction with an ad hoc explaination that has a great deal of evidence against it and no measured support.
Bill N . . . my apologies for not completely following your chain of logic. Surely there must be some factor I am overlooking?
You have said there is no clear evidence (from the satellite measurements) that TSI has increased or fallen, since 1978. As to TSI in earlier times : observed sunspot activity has less than perfect correlation. And ice-core and tree-ring proxies are based on a deposition of certain isotopes - an isotopic deposition suffering considerable variation from changes in terrestrial magnetic field and changes in atmosphere circulation.
It is well established that there has been rapid global warming in the last 50 or 100 years. And the general scientific view is that that change is well explained by the radiative properties of CO2 (and other greenhouse gasses) .
Yet you yourself feel that possibly there has been a relatively large [ 0.1% or greater ] rise in TSI over the past century or two, and which possibly may have caused all the recent warming.
In addition, you will somehow have to abolish the warming effect of CO2 and other greenhouse gasses, in order for your proposed (but not demonstrated) large and rising increment of TSI to do its work in heating up the Earth. On top of that, you will need to explain away the observed diurnal and climatic changes mentioned by Michael Sweet (above) .
Bill N, your line of argument does not hold together.
So there must be some other factor which I have overlooked?
Bill:
Here is the illustration of human fingerprints. These fingerprints show that warming is caused by carbon pollution and not the sun.
OK Micheal and Eclectic. Now I am going to have to ask the moderators to get involved for your "dog piling" and ad hominum attacks, which are clear rule violations at this sight. Your discussions have degenerated from bonified scientific debate to childish antics.
Michael, you have no idea what I do or do not know about this subject. My views are formed from refereed publications and books on this subject. Eclectic, I take personal afront of your claims that I just made my opinions up from thin air. If the both of you have a problem with the emerging views and findings of an ever growing number of bonified scientists showing that the observed global warming is solar induced, you should take it up with them. Don't shoot the messenger. I will not argue any further with you two.
My primary purpose here is to state that in my area of expertice, namely optical instruments, the claim that the satellite instruments have successfully measured that the solar TSI has not gone up since 1978 (even gone down a little), is completely bogus. That then shoots down a major cornerstone used by folks claiming that the observed warming must be due then to manmade greenhouse gas emissions.
Bill N , surely you are capable of conversing with 2 people, rather than only 1 .
I certainly don't wish for you to waste your time arguing with yourself about whether there has or has not been any ad-hominem attack on you - for as far as I can see, there has been nothing of any personal attack against you, of any sort.
You have been asked to supply a logical coherent reasoning, showing that the standard science (accepted by all climate scientists) is somehow wrong. You have failed to do so - thus far, anyway.
Therefore please put aside your deflections and diversions about ad-homs; put aside your rhetorical assertions and quibbles about satellite instrumentation - instrumentation which is a very small part of the total picture of climate science.
Whatever cogent ideas you have, I am sure our readers here would be delighted to see them. If they exist, of course. Likewise it would be gratifying to know something of these [your quote] "bonified scientists" (not bonified* in the cranium, surely ??! :-P ) and their contrarian ideas. Contrarian ideas which so far seem uncirculated in the scientific realm (or pehaps are simply not cited . . . which says something in itself) .
So, Bill N , please proceed rationally. For myself, I am keen to see anything useful you can provide.
* Bill N , please note that these comments columns have no SpellChecker . . . so you misspell at your peril. "Bona fide" humorous efforts are always welcome, though !
Bill N @various, the IPCC AR12, Working Group 1, Chapter 8.4.1 says:
The SORCE/TIM home page gives an accuracy to 1σ of 350 ppm, or 0.48 W/m^2 of 1360.8 W/m^2, so I take that accuracy to be represnt one standard deviation, giving a 2σ accuracy of 0.07%. The SORCE/TIM home page also gives a"long term repeatability" of 10 ppm per annum (1σ), or 0.002% per annum, where the former is the accuracy of the absolute estimate of TSI, and the later is the accuracy of estimates of relative change in TSI from year to year.
It also says:
The Guidance Note on Uncertainty indicates that something is "very likely" if it has a 90-100% probability (Table 1), so we can take that uncertainty range to be the 90% uncertainty range. The reduction in the PMOD composite over that period is 0.04 W/m^2, giving an estimated reduction, with 90% confidence intervals of 0.04 +/- 0.04 W/m^2, which represents an accuracy of 0.003% relative to the 1360.8 W/m^2 estimate of TSI from SORCE/TIM. Assuming a normal distribution, a 90% confidence interval of 0.04 W/m^2 is equivalent to a 2 standard deviation interval of 0.05 W/m^2. Even allowing that the error on the estimate the IPCC estimate represents an 80% range ( the minimum consistent with their expressed likelihood) yields a 2 standard deviation interval of 0.06 W/m^2.
The current version of the PMOD composite, with monthly values estimated by taking the mean of daily values, excluding missing values) shows an OLS trend of -0.014 +/- 0.008 W/m^2 per annum (2σ error margin). The absolute difference between the Months with the lowest Sunspot Number is the respective minimums (June 1986 and Aug 2008 respectively) is -0.255 W/m^2, while that between the average of the two years is -0.219 W/m^2. The trend difference is -0.3 +/- 0.18 W/m^2. Expressed as changes in forcing to two significant figures, these values are -0.04 W/m^2, -0.04 W/m^2 and -0.05 +/- 0.03 W/m^2 respectively. It appears, therefore (and is confirmed by the IPCC 8.SM.6), that the value expressed by the IPCC is the absolute difference between the relevant years expressed as a forcing rather than as TSI. Expressed as percentages of the 2008 TSI (SORCE/TIM), they all represent 0.02% of the value, rounded to two significant figures.
The IPCC's (and PMODS's) stated accuracy is less than the relative accuracy of TIMS (by all accounts their most reliable single instrument) if expanded over the June 1986-Aug 2008 interval, which would have an accumulated error of 0.6 W/m^2 (or 0.11 W/m^2 expressed as a forcing; 2σ error margin). This is in part due to the fact that typically (and always from 1986 to 2008) at least three space borne instruments have observed TSI at any given time. This is important, both because the drift in satellite instruments is unlikely to be synchronous, and because multiple measurements reduce error (as errors are summed in quadrature).
More importantly, in developing PMOD, each satellite record of TSI was fit against the square root of the Sunspot Number (SSN), which then provided a framework to develop the composite TSI record. In that way, the superior accuracy of the SSM record is used to overcome the deficiencies of the satellite record. Because of this use of the SSN, and because of the use of multiple instruments observing simultaneously, no consideration of innate instrument accuracy alone can correctly characterize the error in TSI observations.
The use of SSNs by PMOD also indicates that belief in the decline in solar intensity is not based on satellite instruments alone. Indeed, the SSNs show a trend of -3.09 +/- 1.33 per annum (2σ range). Given that you accept the accuracy of the SSN record, and accept a high correlation between SSNs and solar intensity, that should mean you also agree that solar intensity has declined over the last four decades, although we may be in doubt as to just by how much.
In the mean time, and with respect, you retain effective anonymity so your authority on this or any topic (as is mine) is just that of "some random guy on the internet". Even if we take your claimed credentials and expertise on face value (as I am inclined to do), those credential and experience are no better than those of the teams of scientists working on individual TSI instruments, composites, and in reviewing the data for the IPCC. Given that, I see no reason to give your beliefs on this matter particular credence.
Bill,
At this time you have provided no links to any "peer reviewed" studies that you used to form your opinions. I have only your unsupported claim that you are an expert on TSI (although you have apparently never been involved with the measure of TSI). I have provided links to peer reviewed studies that support my position. The Comments rules for Skeptical Science require peer reveiwed links to support your position.
Eclectic and I have shown that TSI is not required to determine that carbon pollution is the cause of warming and not an unmeasured increase in TSI. It is incumbent on you to answer these arguments. Since you have refused to even acknowledge them I presume that you have realized that you cannot respond and concede our position.
You have not " [shot] down a major cornerstone used by folks claiming that the observed warming must be due then to manmade greenhouse gas emissions", you have made unsupported assertions from unsubstantiated authority. Tom Curtis above has demsonstrated (using peer reviewed sources) that your argument is incorrect. That leaves you with only your unsupported opinion. Since I have shown that TSI measurements are unnecessarry to prove that warming is not due to the sun, you have shown nothing.
You are welcome to decide who you want to communicate with. If you want to argue by claiming expertise in a subject you clearly have not studied well (I look forward to your peer reviewed studies that answer Tom above) , claim you have proven a substantial part of AGW theory is incorrect when you have not, refuse to provide peer reviewed data and ignore arguments from other sources of analysis that show your argument fails, go for it. I think you will find that your unsupported opinions do not convince people at this web site.
A word to the wise: people who come here with bold assertions that they have overturned everything scientists have learned over the past 150 years are frequently recieved harshly. If you instead ask questions about what you do not understand people are happy to discuss these issues in great detail. If you say you do not understand the TSI measurements and how they relate to overall AGW theory you will be much better received. If you say you will not discuss how scientists know that the sun is not the cause of warming because you are an expert (at something you have never measured) you will not get friendly responses.
Hello Tom,
Thank you for the excellent post about the satellite instruments. It looks like you put a lot of work into it, which is greatly appreciated.
I especially took notice of the part about comparing 3 instruments at once to reduce errors. This of course significantly reduces all "drift errors" in which the drift mechanism has a equal likilyhood of moving in either direction. Unfortunately, optical radiometric changes are typically "one way," so that for instance all 3 compared instruments will have a reduced sensitivity over time due to the three error sources indentified previously: outgassing induced contamination, solar light induced degredation of the cone optical surface, and accumulation of spaceborn dust. All three sources will increase the diffuse reflectivity of the (designed) specular cone, thereby reducing the amount of light collected, yielding then a lower measured TSI over time for all instruments flown.
Of course, the degree of change for any particular source will vary between instruments. One of these error sources is likely to be predominant over the others (my guess would be either the outgassing contamination or the solar light induced degredation), and if its rate of change varied significantly from one instrument to the next, it would be detected as a relative change in the sensitivity of 3 instruments being compared. But IMHO, the variation between instruments for the rate of change of the predominant error source, is likely to be less than the average rate of change for the instruments combined, so as long as the average rate of change is not dramatic, the variation in the rate of change between instuments will not be significant enough to indicate the presence of the error. The TSI measurements themselves are "stable" enough to indicate that the optical error sources are not dramatic, so the predominant one is of course also not dramatic. Therefore, what ever the predominant optical error source is, it is reducing the sensitivity of all instruments together, but not so much as to indicate the variation in the rate of change from one instrument to the next. However, the average variation can still be large enough to significantly exceed the 0.01% stability requirement neccessary to rely on these instruments to show the TSI levels are not changing. Therefore, the issue still remains.
You are right in not taking my word on this issue with any more credence than what anyone else has to say, especially against the engineers/scientists building and using these instruments. However, in one respect, I am simply pointing out what any objective optical engineer will tell you, which is that an optical stability level of <0.01% for radiometric instrumentation is extremely difficult to obtain and prove, especially for "field instruments" such as ones flown in space. You should also be aware that there is disagreement amongst the instrument engineers and scientists as to whether they can be relied upon at all for measuring TSI changes (as opposed to absolute TSI measurements which everyone seems happy with). In particular, the claims of achieved stability made by PMOD are in dispute, as are their resultant measurements. I suggest you Google on this issue and take a look for yourself (I mentioned a starting point in my original post).
I believe I've "done my job here" in pointing out that the claimed stability of these instruments in order to successfully infer that the TSI is not changing (or even going down), is in question, even amongst the engineers and scientists that built and use these instruments. So I am now "signing off."
I will try to keep this short for the moment, as it look as if BillN may be leaving.
BillN has made several assertions about space-based measurements of TSI. I have not been involved in any space-based measurements, but I have a dozen year of experience in ground-based measurements of direct beam solar radiation using Eppley HIckey-Frieden (HF) cavity radiometers, of identical type to those that have been used in space. [All Eppley HF radiometers are built to the same space-rated specifications. I can't point to a peer-reviewed article that says so, so in a scientific paper I would have to reference this as "John Hickey, personal communication". He's the "Hickey" in "HF"...]
Anyway, BillN has made several questionable assertions. I will respond to a few:
So, stability of an HF instrument depends on the absorption in the cavity remaining stable, and the electronics that measure the electrical heating remaining stable. There are no other "optics" involved.
Rather than taking my word on any of this, HIckey, Frieden, and Brinker have reported on the stability of the Eppley HF after six years in space:
This is a 1990 paper, unforunately paywalled, but the abstract reports a 0.1% stability, but with a 0.1% uncertainty on that value. 0.1% of 1368 W/m2works out to less than 1.5 W/m2. After accounting for global abedo (30%) and dividing by 4 (area of sphere vs. area of circle), this leads to an uncertainty of less than 0.25 W/m2 in global absorbed solar radiation. Much less than the CO2 forcing.
BillN is wrong in implying that the developers of such instruments have not considered stability. Tom Curtis' post above also explains how examiniation of multiple instruments and multiple sources of analysis increases confidience in the readings of TSI.
In short, BillN's implied position of infallible authority on matters of spaced-based TSI measurements is fallible.
Bob,
You have mischaracterized what I have said on almost every count.
The only thing you have corrected me on is that the FOV for these instruments encompasses the entire solar disk, which only serves to strengthen my argument that the solar light hitting the cavity wall will degrade it and cook any outgassing contamination on it. I never said an adjustment must be made to account for what I thought was a limited FOV, so again you mischaracterize.
I never said that there were any other optics besides the open aperture and the optical cavity, so again you mischaracterize. You yourself said that the only room for optical change is the cavity reflectance (absorption ratio). But that's exactly what I have been talking about, nothing more, nothing less. It is the long term stability of this optical property under degrading environmental influences that is the question here.
I did not feel the need to explain what "active cavity radiometers" are beyond the optical components being evaluated, assuming that interested readers here can Google this in a split second and get a lot more detail on them than what I could provide in writing. So what's you beef here.
Again you BS when claiming that I said the instrument developers did not consider stability. I have stated here till I'm blue in the face that there is disagreement amongst the developers and users over what the stability is, even to the point that some think they can not be relied upon for long term TSI variability measurements. So obviously this is a hot topic for them, as I have said again and again.
Finally, I have made no claim whatsoever as to being an authority on space-based TSI measurements, so you last mischaracterization of me about this is a cheap shot. My only "authoritity" is my general experience as an optical engineer flying spaceborne instruments, with of course then radiometry part of that experience (some of this covered solar measurements).
So summarizing Bob, you're really a piece of work.
After recieving so much vitriol about reasonably poised questions and thoughts by me, I decided to Google what other folks think about what is going on at ScepticalScience. Wow! It seems the world opinion is that this site is populated by a bunch of alarmist trolls (kids mainly) who engage in dirty tactics to voraciously defend their pseudo-scientific viewpoints, so that anyone who comes here with a differing viewpoint, no matter how reasoned, will not be treated fairly. Well, that is certainly what I have experienced here (with a few exceptions). So good bye.
BillN:
I expect that your latter paragraphs, if not your whole post, will be deleted by the moderators. For someone who complains about others' tone, you seem to not hold yourself to the same standards. What you consider to be "reasonable" in your own posts is not considered reasonable by others here.
In your post #1180, the full sentence is:
You may not have specifically stated that an adjustment is needed, but you did say (incorrectly) that the instrument does not measure the full disk, which certainly implies that something needs to be done about it. How would you get a proper reading of the full TSI from a partial measurement if you do not account for the partial measurement? Or were you just (incorrectly) implying that an assumption had been made that thought was unwarranted?
Your use of the word "optical" implies much more than it should to the casual reader. I pointed out the very limited limited scope in which that term applied to the Eppley HF. If what I said was (to quote you) "exactly" what you meant, then that is what you should have said to begin with. I have not accused you of intentionally misleading anyone, but I have clarified the very limited scope in which your statement applies, so that casual readers will not take the wrong impression from what you have said.
When you walk in here and start proclaiming your expertise, and acting as if we should only take your word on things, then you are making an argument from your own authority. I provided links to the group (PMOD) responsible for the surface-based pyrheliometer comparisons and the World Radiation Reference. I provided a link to a peer-reviewed journal paper describing the stability of the Eppley HF after space exposure. Tom Curtis has provided you with other links. You have not (as far as I can see) provided a single link to support any of your assertions - instead expecting us to believe you solely on the basis of your claimed expertise. Since you claim to have knowledge in these areas, surely you can back up your claims with some references?
You are correct that SkS is a web site where individuals that can provide nothing more than a viewpoint are subject to critical reaction. People are expected to provide independent support of those opinions.
http://notrickszone.com/wp-content/uploads/2016/10/Modern-Grand-Maximum-Usoskin14.jpg
study shows above normal solar activity in the 1900-2000 period.
[JH] Please do not post a url without an explanation of what it links to and why it is relevant to either the OP or the commentary or both. Posting naked urls is prohibited by the SkS Comments Policy.
Sorry Pink, but the Notrickszone .com has an abysmal level of accuracy. They'll tell you that black is white, if that's the particular propaganda line they wish to push at the moment.
That site is something like 97% garbage - you can find almost any sort of misleadingly massaged information there. Basically you are wasting your own valuable time by going there.
Please look elsewhere, if you seek more reliable information. And please use your critical facilities. And where better to start, than right here on the SkS website ! It is a very useful entry portal to climate science in general, and to more detailed information sources.
Pink, as a small point, e.g. with your Aanda. org link ( which you haven't yet motivated me to read ) , please show consideration for your readers' own valuable time, by (a) activating the link, and by (b) giving a short description or "thumbnail sketch" of what's in the link, and of why you think it is significant. ( There's so much rubbish out there on the internet, that it's all too easy to waste 60 seconds of irrecoverable time, assessing something that just isn't worthy of attention. )
[JH] Pink's Aanda. org link was deleted because it violated the SkS Comments Policy which prohibits naked urls.
pink's graph @1194 is Figure 2 from Usoskin et al (2014). Although the abstacts teases about the potential impact of the paper's findings on climate, no actual inferences about climate are drawn. Any inference drawn by pink, therefore, is from his/her own fervid imagination.
The red plot on the graph is the group sunspot number from Hoyt and Schatten (1998). It is shown here (in blue) agains the international sunspot number (red):
Given the close correlation between group sunspot number, and the international sunspot number, it is reasonable to suppose that the group sunspot number would also have rapidly declined in the early 21st century (indeed, that it may be verging on a Grand Solar Minimum). Regardless, it is clear that there is an increase in solar activity from the late 18th century to about 1950, which may have contributed the rapid increase in temperature in the early 20th century. Since, circa 1950, however, it has been in decline, and since 2000 in rapid decline. Therefore it can only have mitigated, not enhanced the rapid rise in temperature from about 1970 to present, although it may have contributed to the apparent reduction in the rate of increase in temperatures since 2007. Direct observations of the Total Solar Irradiance, however, show the contribution to either must have been minimal.
Pink merely trys to present old information without commentary in the hope that, absent that commentary the visual image may decieve, wheras actually understanding the graph shows it to in no way support the viewpoint pink has pushed in the past.
But even chart posted by Tom Curtis shows exceptional solar activity in the period of 1900-2000, definently beating the previous 300 years. And that's the same century where the establishment science claims too much warming due to GHGs. I don't see a big difference between that chart and the chart published in Usoskin et al., 2014.
pink @1196, read again my paragraph immediately following the chart. To make it clearer, the difference in TSI between the 2008 solar minimum and the 1958 solar maximum was just 1 W/m^2, or 0.07%. That works out to a solar forcing of just 0.175 W/m^2, or less than a 10th of the change in anthropogenic forcing over the 20th century. Further, arguing that "its the Sun" requires you to believe that the most rapid and longest sustained temperature increase driven by the Sun was the result of the Sun having a slightly cooling trend (from 1951-2008).
A paper was published 2 weeks ago, can some experts comment on it ?
http://www.sciencedirect.com/science/article/pii/S1367578816300931
@Jc
I'm no expert but it reads like a vanity project born of engineer-flavoured dunning-kruger. It isn't worth an expert's time.
@Tristan
Thanks for confirming what I feel too.
Still, if someone comes with an argument which has not yet met a rebutal, then the argument should be reviewed. SkS is not the place for that, I agree. I was just looking if someone had enough background to point me where the bias lies.
So many arguments can be made based on stats alone. Stats are a real mine field. Easy to get trapped in it. And those stats are not the one I use in my field. Frustrating.
Thanks the same. I appreciate.