


 Arguments


How sensitive is our climate?
What the science says...
| Select a level... |
 Basic
Basic
|
 Intermediate
|
 Advanced
| ||||
|
Net positive feedback is confirmed by many different lines of evidence. |
|||||||
Climate Myth...
Climate sensitivity is low
"His [Dr Spencer's] latest research demonstrates that – in the short term, at any rate – the temperature feedbacks that the IPCC imagines will greatly amplify any initial warming caused by CO2 are net-negative, attenuating the warming they are supposed to enhance. His best estimate is that the warming in response to a doubling of CO2 concentration, which may happen this century unless the usual suspects get away with shutting down the economies of the West, will be a harmless 1 Fahrenheit degree, not the 6 F predicted by the IPCC." (Christopher Monckton)
At-a-glance
Climate sensitivity is of the utmost importance. Why? Because it is the factor that determines how much the planet will warm up due to our greenhouse gas emissions. The first calculation of climate sensitivity was done by Swedish scientist Svante Arrhenius in 1896. He worked out that a doubling of the concentration of CO2 in air would cause a warming of 4-6oC. However, CO2 emissions at the time were miniscule compared to today's. Arrhenius could not have foreseen the 44,250,000,000 tons we emitted in 2019 alone, through energy/industry plus land use change, according to the IPCC Sixth Assessment Report (AR6) of 2022.
Our CO2 emissions build up in our atmosphere trapping more heat, but the effect is not instant. Temperatures take some time to fully respond. All natural systems always head towards physical equilibrium but that takes time. The absolute climate sensitivity value is therefore termed 'equilibrium climate sensitivity' to emphasise this.
Climate sensitivity has always been expressed as a range. The latest estimate, according to AR6, has a 'very likely' range of 2-5oC. Narrowing it down even further is difficult for a number of reasons. Let's look at some of them.
To understand the future, we need to look at what has already happened on Earth. For that, we have the observational data going back to just before Arrhenius' time and we also have the geological record, something we understand in ever more detail.
For the future, we also need to take feedbacks into account. Feedbacks are the responses of other parts of the climate system to rising temperatures. For example, as the world warms up. more water vapour enters the atmosphere due to enhanced evaporation. Since water vapour is a potent greenhouse gas, that pushes the system further in the warming direction. We know that happens, not only from basic physics but because we can see it happening. Some other feedbacks happen at a slower pace, such as CO2 and methane release as permafrost melts. We know that's happening, but we've yet to get a full handle on it.
Other factors serve to speed up or slow down the rate of warming from year to year. The El Nino-La Nina Southern Oscillation, an irregular cycle that raises or lowers global temperatures, is one well-known example. Significant volcanic activity occurs on an irregular basis but can sometimes have major impacts. A very large explosive eruption can load the atmosphere with aerosols such as tiny droplets of sulphuric acid and these have a cooling effect, albeit only for a few years.
These examples alone show why climate change is always discussed in multi-decadal terms. When you stand back from all that noise and look at the bigger picture, the trend-line is relentlessly heading upwards. Since 1880, global temperatures have already gone up by more than 1oC - almost 2oF, thus making a mockery of the 2010 Monckton quote in the orange box above.
That amount of temperature rise in just over a century suggests that the climate is highly sensitive to human CO2 emissions. So far, we have increased the atmospheric concentration of CO2 by 50%, from 280 to 420 ppm, since 1880. Furthermore, since 1981, temperature has risen by around 0.18oC per decade. So we're bearing down on the IPCC 'very likely' range of 2-5oC with a vengeance.
Please use this form to provide feedback about this new "At a glance" section. Read a more technical version below or dig deeper via the tabs above!
Further details
Climate sensitivity is the estimate of how much the earth's climate will warm in response to the increased greenhouse effect if we manage, against all the good advice, to double the amount of carbon dioxide in the atmosphere. This includes feedbacks that can either amplify or dampen the warming. If climate sensitivity is low, as some climate 'skeptics' claim (without evidence), then the planet will warm slowly and we will have more time to react and adapt. If sensitivity is high, then we could be in for a very bad time indeed. Feeling lucky? Let's explore.
Sensitivity is expressed as the range of temperature increases that we can expect to find ourselves within, once the system has come to equilibrium with that CO2 doubling: it is therefore often referred to as Equilibrium Climate Sensitivity, hereafter referred to as ECS.
There are two ways of working out the value of climate sensitivity, used in combination. One involves modelling, the other calculates the figure directly from physical evidence, by looking at climate changes in the distant past, as recorded for example in ice-cores, in marine sediments and numerous other data-sources.
The first modern estimates of climate sensitivity came from climate models. In the 1979 Charney report, available here, two models from Suki Manabe and Jim Hansen estimated a sensitivity range between 1.5 to 4.5°C. Not bad, as we will see. Since then further attempts at modelling this value have arrived at broadly similar figures, although the maximum values in some cases have been high outliers compared to modern estimates. For example Knutti et al. 2006 entered different sensitivities into their models and then compared the models with observed seasonal responses to get a climate sensitivity range of 1.5 to 6.5°C - with 3 to 3.5°C most likely.
Studies that calculate climate sensitivity directly from empirical observations, independent of models, began a little more recently. Lorius et al. 1990 examined Vostok ice core data and calculated a range of 3 to 4°C. Hansen et al. 1993 looked at the last 20,000 years when the last ice age ended and empirically calculated a climate sensitivity of 3 ± 1°C. Other studies have resulted in similar values although given the amount of recent warming, some of their lower bounds are probably too low. More recent studies have generated values that are more broadly consistent with modelling and indicative of a high level of understanding of the processes involved.
More recently, and based on multiple lines of evidence, according to the IPCC Sixth Assessment Report (2021), the "best estimate of ECS is 3°C, the likely range is 2.5°C to 4°C, and the very likely range is 2°C to 5°C. It is virtually certain that ECS is larger than 1.5°C". This is unsurprising since just a 50% rise in CO2 concentrations since 1880, mostly in the past few decades, has already produced over 1°C of warming. Substantial advances have been made since the Fifth Assessment Report in quantifying ECS, "based on feedback process understanding, the instrumental record, paleoclimates and emergent constraints". Although all the lines of evidence rule out ECS values below 1.5°C, it is not yet possible to rule out ECS values above 5°C. Therefore, in the strictly-defined IPCC terminology, the 5°C upper end of the very likely range is assessed to have medium confidence and the other bounds have high confidence.
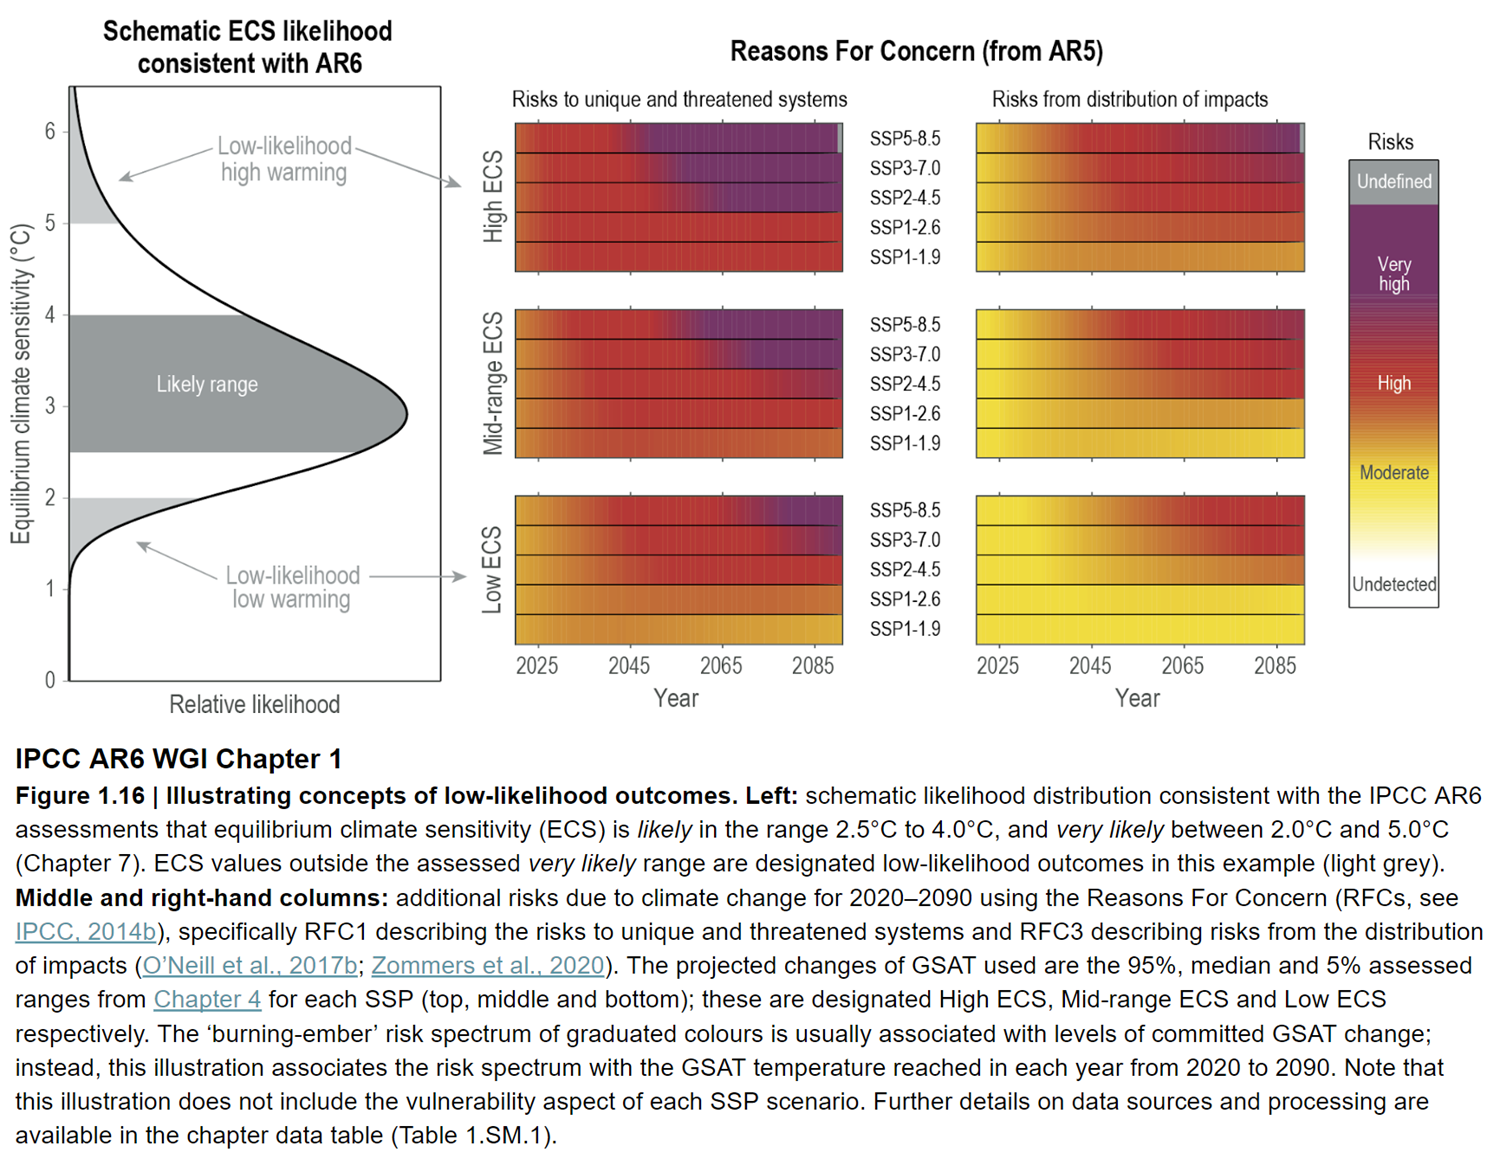
Fig. 1: Left: schematic likelihood distribution consistent with the IPCC AR6 assessments that equilibrium climate sensitivity (ECS) is likely in the range 2.5°C to 4.0°C, and very likely between 2.0°C and 5.0°C. ECS values outside the assessed very likely range are designated low-likelihood outcomes in this example (light grey). Middle and right-hand columns: additional risks due to climate change for 2020 to 2090. Source: IPCC AR6 WGI Chapter 6 Figure 1-16.
It’s all a matter of degree
All the models and evidence confirm a minimum warming close to 2°C for a doubling of atmospheric CO2 with a most likely value of 3°C and the potential to warm 4°C or even more. These are not small rises: they would signal many damaging and highly disruptive changes to the environment (fig. 1). In this light, the arguments against reducing greenhouse gas emissions because of "low" climate sensitivity are a form of gambling. A minority claim the climate is less sensitive than we think, the implication being that as a consequence, we don’t need to do anything much about it. Others suggest that because we can't tell for sure, we should wait and see. Both such stances are nothing short of stupid. Inaction or complacency in the face of the evidence outlined above severely heightens risk. It is gambling with the entire future ecology of the planet and the welfare of everyone on it, on the rapidly diminishing off-chance of being right.
Last updated on 12 November 2023 by John Mason. View Archives


Penguin,
In hte paper you cite they claim that climate sensitivity is derived completely from cliamte models. That is false. there are several ways to derive climate sensitivity from data includig paleoclimate data. I note they provide no citations to support their claims. They will only be read by skeptics.
They assume that the change in cloud cover forces the change in temperature. That is completely backwards. Cloud cover is a response to the change i temperature and not the casue of the change. In order to chage the temperature you have to add energy. Changes in clouds do not add energy.
Penguin, the response to the JK&PM paper is huge laughter.
A paper based on limited observations ( over just 25 years ) and giving a "calculated" climate CO2 sensitivity of 0.24 degreesC (transient sensitivity) . . . is laughable.
Also amusing, is the paper title. JK&PM themselves did no experiment !
Penguin ~ some more details about the JK&PM paper you mentioned :-
It is not a paper in a peer-reviewed scientific journal. It has been described as a re-hash of an older (and non-peer-reviewed) paper from Energy & Environment journal (which is a social journal, not a scientific journal).
It was based on a limited amount of information from old satellite data ~ which was subsequently found to be faulty. You can find extensive criticisms of it, by various respected scientists, at the high-quality blog climatefeedback.org/claimreview/non-peer-reviewed-manuscript-falsely-claims . . . . (etcetera)
Not only that, but JK&PM have made a number of other gross mistakes (such as saying that only a tiny portion of the 20th & 21st Century rise in atmospheric CO2 level derives from human influence).
Penguin, the short version is: the "No experimental evidence (etcetera)" manuscript was authored by crackpots and is rubbish from beginning to end. Laughable !
Penguin, if you'd like to gain some climate knowledge in a relaxed easy-going way, then have a look at "Climate Change — the scientific debate" by youtuber Potholer54 (a science journalist) and the whole follow-up series of videos (most, fairly short!) Not only very informative, but done in an entertaining & often humorous manner.
Penguin @375,
You specifically ask "Do we know what longer series or more recent data would show?"
The paper (or actually the paper of 2014) uses alleged low cloud data for 1983-2008 without describing the source. The dates suggest ISCCP data which has been sourced by the denialists on the Climate4you website to provide identical data. (Elsewhere Exeter University's Richard Betts describes Kauppinen & Malmi's cloud data as "at odds with peer-reviewed papers.") The paper also plots relative humidity 1970-2010 as a proxy for low cloud, again without attribution. A previous paper describes this as 700mbar & 850mbar data but using NCEP reanalysis data it looks more 700mbar than 850mbar. (So that's 3,000m - not exactly low cloud.) The temperature data appears to be based on HadCRUT4.
If you plot NCEP 700mbar data 1948 to date, it shows no change post-2010 while the global temperatures actually show significant rise. And pre-1970 there is a large Relative Humidity change 1948-60s which by Kauppinen & Malmi's grand theory would suggest a there was a rise in global temperature of +0.8ºC when, of course, global temperature was pretty-much flat as a pancake. The 850mbar data is a poorer fit 1970-2010 but also shows the same trends beyond the 1970-2010 period.
I am an anthropogenic climate change denier because I have never found any scientific evidence that supports it. The theory is based upon modeling climate sensitivity to CO2 and as you state: “In truth, nobody knows for sure quite how much the temperature will rise”.
We hear regularly from the media that 90+% of scientists believe in anthropogenic climate change but my question is how many scientists are actually trained and practice climate modeling?
I’ve looked at the undergraduate and graduate curriculum for the top US environmental science universities and have found only one course on climate modeling. Penn State offered METEO 523 in Spring 2020 and only 6 of 30 seats were filled and the course has been since dropped. So what course is available in climate modelling so I can learn the science?
Given the lack of curriculum on climate modeling it is apparent that all climate science curriculum is based upon the assumption of anthropogenic climate change without providing any scientific evidence or expertise. This isn’t science, it’s group think. So the opinion of those 90+% so called scientists is based upon blind faith rather than science. This isn’t science it’s a hoax.
I remain interested in finding a quality course in climate modeling.
[DB] Please start off by reading this thread and this thread. Then proceed to this post, which discusses the empirical evidence for AGW. Skeptical Science has dedicated posts on pretty much every point anyone would think to contend with the science of climate change on, just use the Search function to find the most appropriate thread, read it including the comments, and only then if you still have questions, post them there, and not here.
Off-topic and Gish Gallop snipped per the Comments Policy, which you should also read. As this is a moderated forum, you should also ensure that future comments are constructed to adhere to it.
Moderation complaints and sloganeering are unacceptable.
@381 Deplore This. Everyone has seen this argument. It was a well known published "merchant of doubt" argument full of logic fallicies and false premises designed to mislead people like you... which unfortunately it seems to have worked so far. However, if you are honestly seeking a University level course, I suggest you change your google search terms to "statistical modeling" and /or "statistical modeling of climate change" and you will find a whole lot of universities in the world can help you.
And yes sensitivity is a factor in all of them. In some as a constant and in a few papers there are calls for sensitivity as a variable to fine tune accuracy.
However, the statement, "The theory is based upon modeling climate sensitivity to CO2" is false. Called a false premise logic fallacy.
Actually global warming is based on empirical evidence.
[DB] The user to whom you are replying has recused themselves from further participation here.
Climate theory is most certainly not based on climate modelling, but observation including the measurable increase in surface irradiation from increased CO2. If sun increased output by 4W/m2 then you would surely expect earth to warm (if not, what is your theory for seasons), but somehow increase from GHG wont cause warming. Climate models are our best guide as to how the future might look. Far from perfect but lightyears ahead of reading entrails or believing nothing will change. I remain stunned that people insist the consensus reported by the IPCC is wrong while obviously having never even opened it the WG1 reports.
Interesting math, but it doesn't appear to be consistent with NASA, Berkeley, Hadley, World Meteriorlogic Organization, and Cowtan and Way global temperature datasets--every international real-time and long-term dataset for Global Temperature.
Please bear with me as I focus on real data generated by hard working climate scientists over the past 6+ decades.
Mauna Loa Observatory (MLO) began recording CO2 in Mar1958 and continues to be the longest real-time record of atmospheric CO2.
The average temperature change of the above internationally highly acclaimed datasets for global temperature (Mar1958 through May2020), is 0.85 C {1.00, 0.92, 0.78, 0.72, 0.83} respectively.
CO2, per MLO, rose from 315.71 to 417.07.
If climate sensetivity for CO2 was 2 C (.85 C / ln[417.07/315.71] x ln(2 or a double) = 2 C), CO2 alone would explain 100% of all climate change!
1) The Sensetivity of all GHG combined > 2 C is not supported by real-time climate for the past 6+ decades.
2) CO2 is not the only GHG and GHG is not the only thing causing climate change.
[TD] It appears that you did not read the Advanced tabbed pane of this post. Please do.
Leehoe @383 ,
please, the word is Sensitivity. Remember the humorous old saying :-
"Typo me once, error me twice".
Yes, the past 6 decades have been a moderately good time for doing a back-of-envelope calculation of sensitivity, because of the fairly flat level of insolation ( around 1360 w/m2 ). And with only a rather small change in non-CO2 / non-H2O greenhouse gas levels.
Unfortunately, the last part of of your post was so abrupt, that your meaning is ambiguous. Please expand your wording, to give a clear indication of your meaning. Readers may be confused on your intention regarding ECS versus TCS. And it is entirely unclear whether you were alluding to the industrial aerosols and volcanic aerosols during this 6 decade period.
Please clarify !
leehoe - do you understand the difference between Equilibrium Climate Sensitivity (often just climate sensitivity) and Transient Climate sensitivity? The box on pg 1110 of the IPCC WG1 has some explanation.
Discussions around estimates of climate sensitivity from the instrument record here especially the Marvel et al paper. And also here for earlier work by Otto, Curry, Lewis
The big news announced yesterday is the narrowing of equilibrium climate sensitivity (ECS) from a combination of paleoclimate and historical measurements and feedback modelling, a study which will feed into IPCC AR6. As I understand it, ECS is now very likely (90% likely) to be within 2.0‐5.7 °C, and likely (66% probability) to be 2.6‐3.9 °C, with a longer tail above 4.5 °C than below 2 °C. Anyone 'gambling' on low sensitivity would lose. Sherwood et al, "An assessment of Earth's climate sensitivity using multiple lines of evidence", Reviews of Geophysics, 2020. http://dx.doi.org/10.1029/2019RG000678
The following long review tells me more than I need to know about feedbacks of all kinds: Heinze et al, "Climate feedbacks in the Earth system and prospects for their evaluation", Earth System Dynamics, 2019. https://doi.org/10.3929/ethz-b-000354206
Although there may be 'black swan' events and earth-system feedbacks, the idea that climate scientists aren't including albedo or cloud changes in models is incorrect.
More recent info on feedbacks in the latest CMIP6 models is in Meehl et al, "Context for interpreting equilibrium climate sensitivity and transient climate response from the CMIP6 Earth system models", Science Advances, 2020. https://doi.org/10.1126/sciadv.aba1981 and Zelinka et al, "Causes of Higher Climate Sensitivity in CMIP6 Models", Geophysical Research Letters, 2020. https://doi.org/10.1029/2019GL085782, the latter including a nice figure S7 showing the contribution of different feedbacks in different models.
Can anyone comment on Nic Lewis' 'rebuttal' of Sherwood et al's findings ?
https://link.springer.com/article/10.1007/s00382-022-06468-x
[BL] Link activated.
The web software here does not automatically create links. You can do this when posting a comment by selecting the "insert" tab, selecting the text you want to use for the link, and clicking on the icon that looks like a chain link. Add the URL in the dialog box.
retiredguy @387,
Lewis (2022) 'Objectively combining climate sensitivity evidence' was given the once-over in a comment thread at RealClimate when it first appeared last year.
Please note: the basic version of this rebuttal has been updated on November 12, 2023 and now includes an "at a glance“ section at the top. To learn more about these updates and how you can help with evaluating their effectiveness, please check out the accompanying blog post @ https://sks.to/at-a-glance
Not sure if this has been addressed already. Couls someone analyse this report? https://scienceofclimatechange.org/wp-content/uploads/SCC-Vol5.3-Huijser-Balancing-Act.pdf
SCaGW2 @ 390:
Well, the "journal" is the publishing house of the organization "Science of Climate Change", which lists Hermann Harde as its editor. Harde is a well-known Norwegian "skeptic" with a reputation for misinformation. The organization's web page outlines their publishing purpose:
You can't express a predetermined agenda much more clearly than that.
As a result, there seems little reason to think that the paper represents an unbiased analysis. A very short glance at the paper suggests that his "climate model" is extremely simplistic. Huijser's name seems pretty new in the climate skeptic camp, and Google Scholar doesn't seem to pick up any publications in credible climate science journals.
Is there anything in the paper that you find remotely interesting? It looks like yet another self-published analysis from a highly unreliable source. My personal view is that it is probably not worth reading in depth, but if there is an aspect of it that you think is interesting, please tell us.