Climate Science Glossary

Term Lookup

Enter a term in the search box to find its definition.

Settings

Use the controls in the far right panel to increase or decrease the number of terms automatically displayed (or to completely turn that feature off).

Term Lookup

Settings


All IPCC definitions taken from Climate Change 2007: The Physical Science Basis. Working Group I Contribution to the Fourth Assessment Report of the Intergovernmental Panel on Climate Change, Annex I, Glossary, pp. 941-954. Cambridge University Press.

Home Arguments Software Resources Comments The Consensus Project Translations About Support

Bluesky Facebook LinkedIn Mastodon MeWe

Twitter YouTube RSS Posts RSS Comments Email Subscribe


Climate's changed before
It's the sun
It's not bad
There is no consensus
It's cooling
Models are unreliable
Temp record is unreliable
Animals and plants can adapt
It hasn't warmed since 1998
Antarctica is gaining ice
View All Arguments...


Username
Password
New? Register here
Forgot your password?

Latest Posts

Archives

Sun & climate: moving in opposite directions

What the science says...

Select a level... Basic Intermediate Advanced

The sun's energy has decreased since the 1980s but the Earth keeps warming faster than before.

Climate Myth...

It's the sun

"Over the past few hundred years, there has been a steady increase in the numbers of sunspots, at the time when the Earth has been getting warmer. The data suggests solar activity is influencing the global climate causing the world to get warmer." (BBC)

At a glance

Thankfully for us, our Sun is a very average kind of star. That means it behaves stably over billions of years, steadily consuming its hydrogen fuel in the nuclear reaction that produces sunshine.

Solar stability, along with the Greenhouse Effect, combine to give our planet a habitable range of surface temperatures. In contrast, less stable stars can vary a lot in their radiation output. That lack of stability can prevent life, as we know it, from evolving on any planets that might orbit such stars.

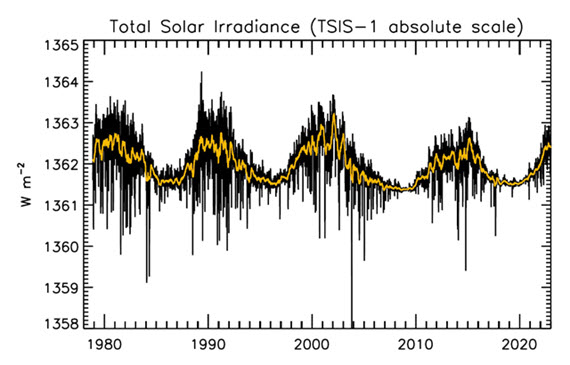
That the Sun is a stable type of star is clearly demonstrated by the amount of Solar energy reaching Earth's average orbital position: it varies very little at all. This quantity, called the Total Solar Irradiance, has been measured for around forty years with high accuracy by sensitive instruments aboard satellites. Its average value is 1,362 watts per square metre. Irradiance fluctuates by about a watt either way, depending on where we are within the 11-year long sunspot cycle. That's a variation of no more than 0.15%.

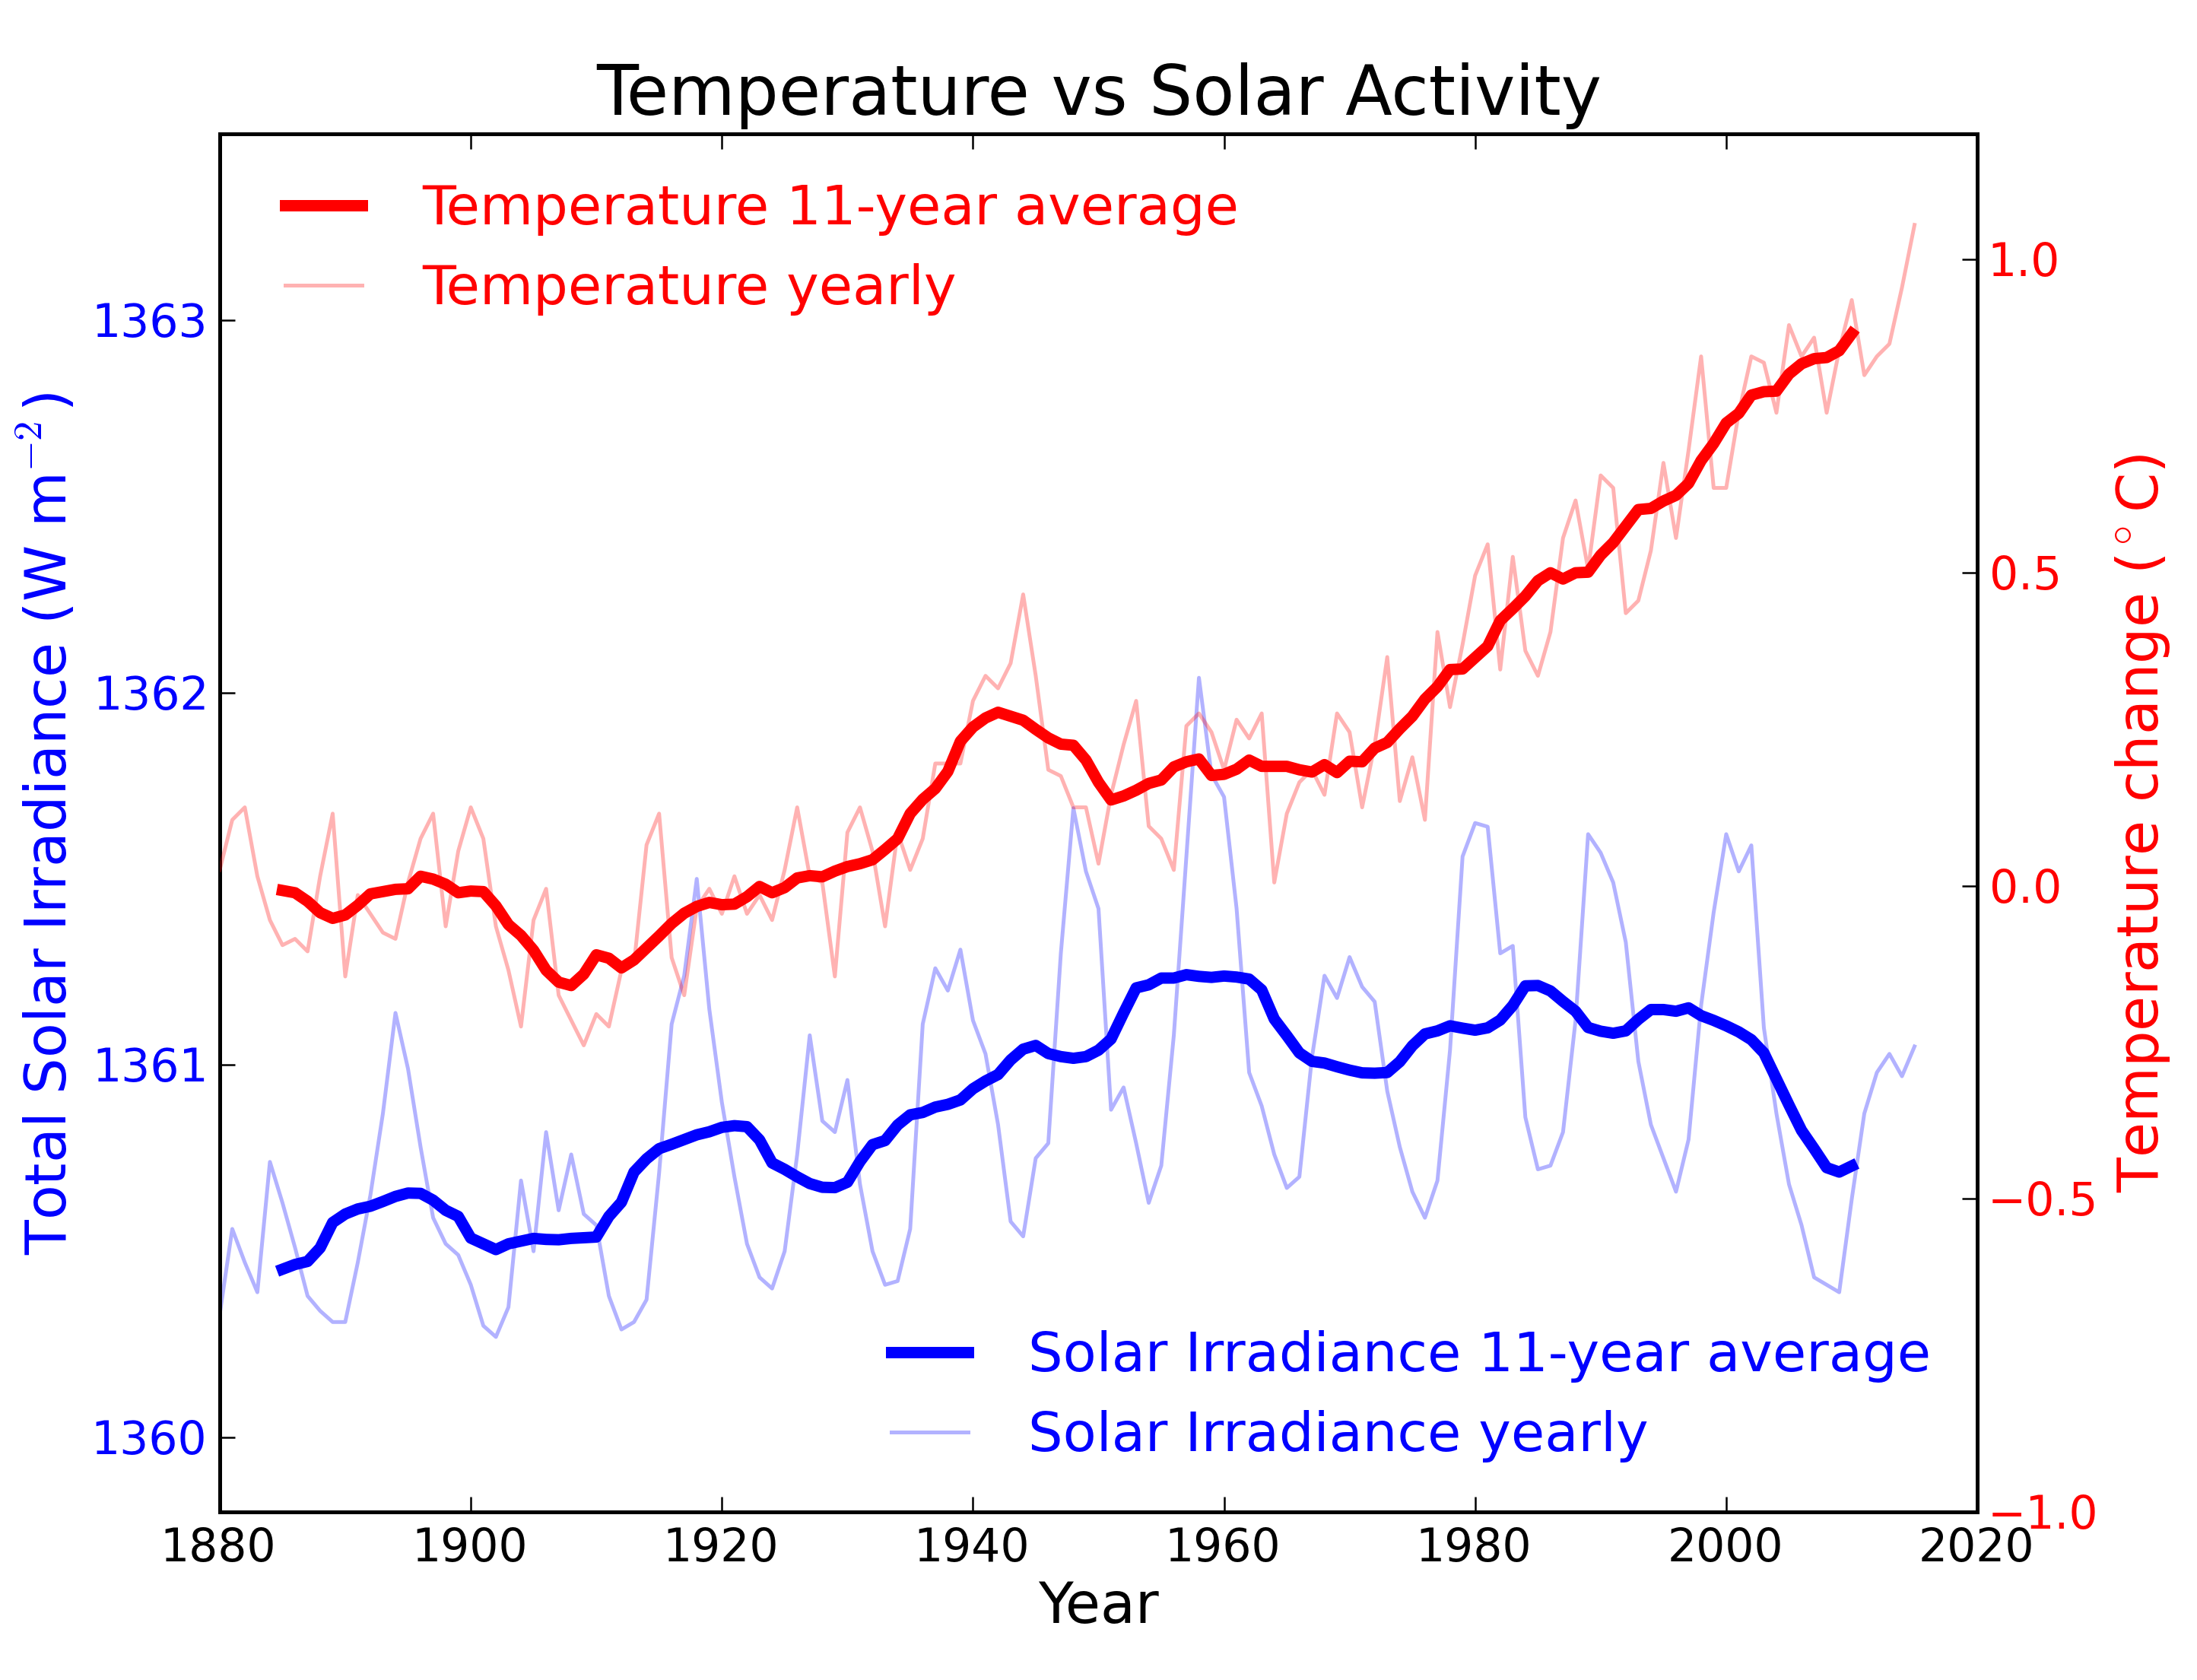
From the early 1970s until today, the Solar radiation reaching the top of Earth's atmosphere has in fact shown a very slight decline. Through that same period, global temperatures have continued to increase. The two data records, incoming Solar energy and global temperature, have diverged. That means they have gone in opposite directions. If incoming Solar energy has decreased while the Earth continues to warm up, the Sun cannot be the control-knob of that warming.

Attempts to blame the sun for the rise in global temperatures have had to involve taking the data but selecting only the time periods that support such an argument. The remaining parts of the information - showing that divergence - have had to be ditched. Proper science study requires that all the available data be considered, not just a part of it. This particular sin is known as “cherry-picking”.

Please use this form to provide feedback about this new "At a glance" section, which was updated on May 27, 2023 to improve its readability. Read a more technical version below or dig deeper via the tabs above!


Further details

Our Sun is an average-sized main sequence star that is steadily using its hydrogen fuel, situated some 150 million kilometres away from Earth. That distance was first determined (with a small error) by a time consuming and complex set of measurements in the late 1700s. It led to the first systemic considerations of Earth's climate by Joseph Fourier in the 1820s. Fourier's number-crunching led him to realise a planet of Earth's size situated that far from the Sun ought to be significantly colder than it was. He was thereby laying the foundation stone for the line of enquiry that led after a few decades to the discovery of what we now call the Greenhouse Effect – and the way that effect changes in intensity as a response to rising or falling levels of the various greenhouse gases.
TSI Solar cycles

Figure 1: Plot of the observational record (1979-2022) on the scale of the TSIS-1 instrument currently flying on the space station. In this plot, the different records are all cross calibrated to the TSIS-1 absolute scale (e.g., the TSIS1-absolute scale is 0.858 W/m^2 higher than the SORCE absolute scale) so the variability of TSI in this plot is considered to be its “true variability” (within cross calibration uncertainties). Image: Judith Lean.

The Sun has a strong magnetic field, but one that is constantly on the move, to the extent that around every 11 years or so, Solar polarity flips: north becomes south, until another 11 years has passed when it flips back again. These Solar Cycles affect what happens at the surface of the Sun, such as the sunspots caused by those magnetic fields. Each cycle starts at Solar Minimum with very few or no sunspots, then rises mid-cycle towards Solar Maximum, where sunspots are numerous, before falling back towards the end. The total radiation emitted by the Sun – total solar irradiance (TSI) is the technical term – essentially defined as the solar flux at the Earth's orbital radius, fluctuates through this 11-year cycle by up to 0.15% between maximum and minimum.

Such short term and small fluctuations in TSI do not have a strong long term influence on Earth's climate: they are not large enough and as it's a cycle, they essentially cancel one another out. Over the longer term, more sustained changes in TSI over centuries are more important. This is why such information is included, along with other natural and human-driven influences, when running climate models, to ask them, “what if?"

An examination of the past 1150 years found temperatures to have closely matched solar activity for much of that time (Usoskin et al. 2005). But also for much of that time, greenhouse gas concentrations hardly varied at all. This led the study to conclude, "...so that at least this most recent warming episode must have another source."
TSI vs. T
Figure 2: Annual global temperature change (thin light red) with 11 year moving average of temperature (thick dark red). Temperature from NASA GISS. Annual Total Solar Irradiance (thin light blue) with 11 year moving average of TSI (thick dark blue). TSI from 1880 to 1978 from Krivova et al. 2007. TSI from 1979 to 2015 from the World Radiation Center (see their PMOD index page for data updates). Plots of the most recent solar irradiance can be found at the Laboratory for Atmospheric and Space Physics LISIRD site.

The slight decline in Solar activity after 1975 was picked up through a number of independent measurements, so is definitely real. Over the last 45 years of global warming, Solar activity and global temperature have therefore been steadily diverging. In fact, an analysis of solar trends concluded that the sun has actually contributed a slight cooling influence into the mix that has driven global temperature through recent decades (Lockwood, 2008), but the massive increase in carbon-based greenhouse gases is the main forcing agent at present.

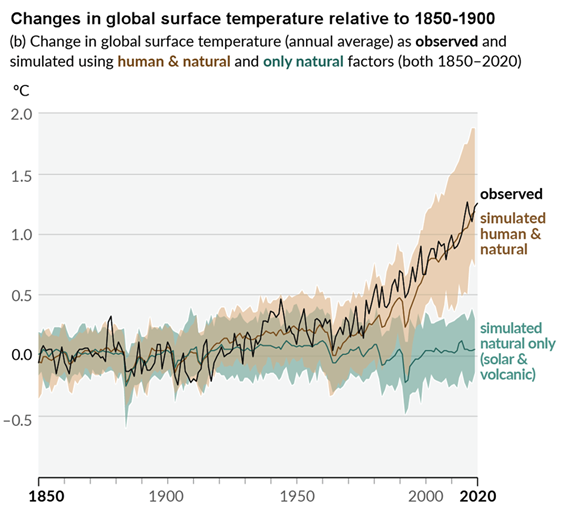
Other studies tend to agree. Foster & Rahmstorf (2011) used multiple linear regression to quantify and remove the effects of the El Niño Southern Oscillation (ENSO) and solar and volcanic activity from the surface and lower troposphere temperature data.  They found that from 1979 to 2010, solar activity had a very slight cooling effect of between -0.014 and -0.023°C per decade, depending on the data set. A more recent graphic, from the IPCC AR6, shows these trends to have continued.

AR6 WGI SPM Figure 1 Panel p

Figure 3: Figure SPM.1 (IPCC AR6 WGI SPM) - History of global temperature change and causes of recent warming panel (b). Changes in global surface temperature over the past 170 years (black line) relative to 1850–1900 and annually averaged, compared to Coupled Model Intercomparison Project Phase 6 (CMIP6) climate model simulations (see Box SPM.1) of the temperature response to both human and natural drivers (brown) and to only natural drivers (solar and volcanic activity, green). For the full image and caption please click here or on the image.

Like Foster & Rahmstorf, Lean & Rind (2008) performed a multiple linear regression on the temperature data, and found that while solar activity can account for about 11% of the global warming from 1889 to 2006, it can only account for 1.6% of the warming from 1955 to 2005, and had a slight cooling effect (-0.004°C per decade) from 1979 to 2005.

Finally, physics does not support the claim that changes in TSI drive current climate change. If that claim had any credence, we would not expect to see the current situation, in which Earth's lower atmosphere is warming strongly whereas the upper atmosphere is cooling. That is exactly the pattern predicted by physics, in our situation where we have overloaded Earth's atmosphere with greenhouse gases. If warming was solely down to the Sun, we would expect the opposite pattern. In fact, the only way to propagate this myth nowadays involves cherry-picking everything prior to 1975 and completely disregarding all the more recent data. That's simply not science.

Longer-term variations in TSI received by Earth

It's also important to mention variations in TSI driven not by Solar energy output but by variations in Earth's orbit, that are of course independent of Solar activity. Such variations, however, take place over very long periods, described by the Milankovitch orbital cycles operating over tens of thousands of years. Those cycles determine the distance between Earth and the Sun at perihelion and aphelion and in addition the tilt the planet's axis of rotation: both affect how much heat-radiation the planet receives at the top of its atmosphere through time. But such fluctuations are nothing like the rapid changes we see in the weather, such as the difference between a sunny day and a cloudy one. The long time-factor ensures that.

Another even more obscure approach used to claim, "it's the sun" was (and probably still is in some quarters) to talk about, "indirect effects". To wit, when studies can't find a sufficiently large direct effect, bring even lesser factors to the fore, such as cosmic rays. Fail.

In conclusion, the recent, post 1975 steep rise in global temperatures are not reflected in TSI changes that have in fact exerted a slight cooling influence. Milankovitch cycles that operate over vastly bigger time-scales simply don't work quickly enough to change climate drastically over a few decades. Instead, the enormous rise in greenhouse gas concentrations over the same period is the primary forcing-agent. The physics predicted what is now being observed.

Last updated on 27 May 2023 by John Mason. View Archives

Printable Version  |  Offline PDF Version  |  Link to this page

Argument Feedback

Please use this form to let us know about suggested updates to this rebuttal.

Related Arguments

Further viewing

Related video from Peter Sinclair's "Climate Denial Crock of the Week" series:

Further viewing

This video created by Andy Redwood in May 2020 is an interesting and creative interpretation of this rebuttal:

Myth Deconstruction

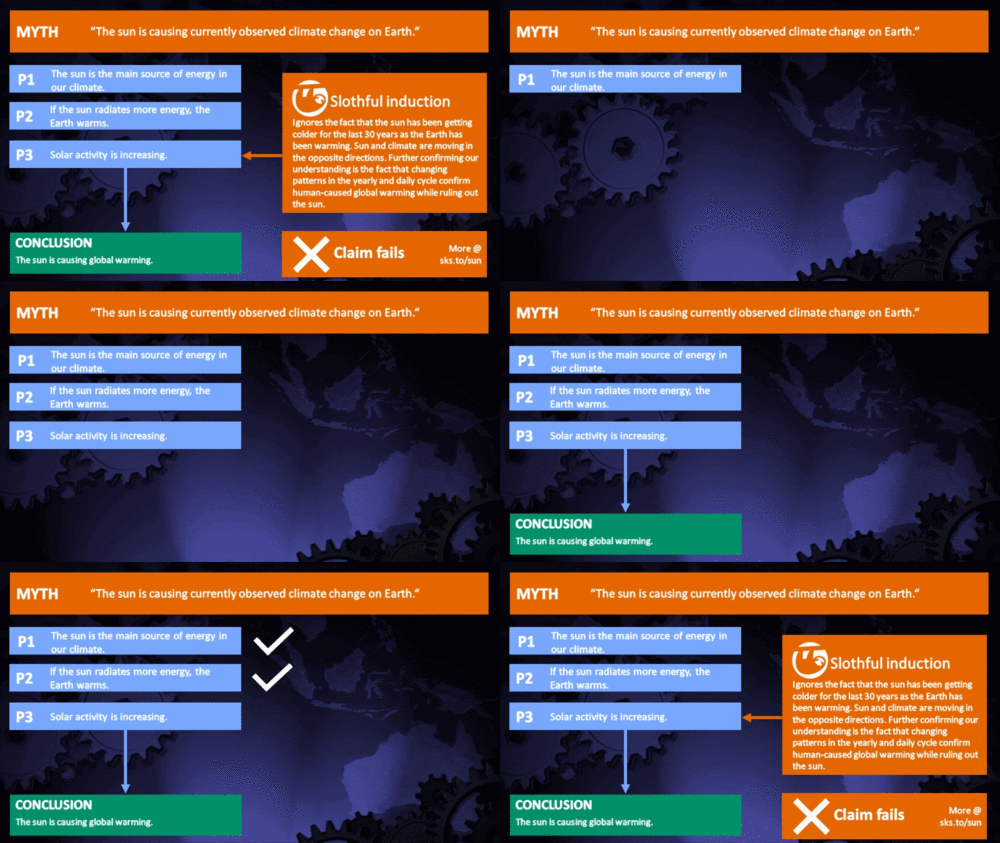
Related resource: Myth Deconstruction as animated GIF

MD Sun

Please check the related blog post for background information about this graphics resource.

Denial101x videos

Related lecture-videos from Denial101x - Making Sense of Climate Science Denial

and

Additional video from the MOOC

Expert interview with Mike Lockwood

Comments

Prev  1  2  3  4  5  6  7  8  9  10  11  12  13  14  15  16  17  18  19  20  Next

Comments 151 to 175 out of 578:

  1. PS In other words Camp & Tung demonstrate that the recent additional warming is not from TSI, with which I can agree.
  2. You all said that the begining of the year was cooler due to la nina, and that this coolness trend would end July - August. However, August was cooler than the last few years via NOAA. Check the link: http://www.ncdc.noaa.gov/img/climate/research/2008/aug/glob-aug-pg.gif What do you all have to say about this?
  3. Re #160 Wondering Aloud (and many others) This thread shows a breathtaking absence of skepticism! It's rather awesome the nonsense that some people are willing to swallow in pursuit of a conspiracy theory. Let's look at the "paleorecord" ("water vapour feedback" in following post) THE PALEORECORD for CO2: The scientific analysis of paleoCO2 measurements and paleotemperature measurements are highlighted in numerous reviews and articles that are appended at the bottom of the post. These show a rather strong coupling of paleoCO2 and paleotemperature. Some posters are exercised over historical records described by a German schoolteacher (Beck). They apparently show CO2 measurements that go up and down in an extraordinary manner. Mr Beck assures us of the precision of historical measures of CO2 during the last 180 years. Why might we be skeptical of this weird data with its absolutely massive rapid jumps and falls in CO2? Here's some pretty obvious reasons for skepticism: (i) Beck assures us that the measures were precise (1-3%). But we're really more interested in their ACCURACY with respect to global atmospheric CO2 concentrations. We know that a large proportion of the measurements were made in individual scientists laboratories in cities (Paris, Kew gardens London, Belfast, Clermont Ferrand, Copenhagen, Vienna, Frankfurt, Giessen, Bern, Poona India, Rostock in Denmark, Ames Iowa...etc. etc. etc.). We know that if one goes to a city today and makes CO2 measurements in the air in our city laboratories, large variations in CO2 levels will be recorded, with high values relative to the true atmospheric concentrations. Just as in the 19th and early 20th century, we’re surrounded in cities by CO2 sources (pretty much all transport and heat/cooling generation). See for example point (iii) below. Competent scientists understand the essential difference between PRECISION and ACCURACY. A local CO2 measure may be beautifully precise but wildly inaccurate with respect to the global atmospheric CO2 value. That's where Becks "analysis" is likely to fool the unskeptical. (ii) We can look at this problem of accuracy in more detail by focusing on the individual series of measurements highlighted by Beck. For example, Beck highlights W. Kreutz’s series of very high CO2 measures in 1939/40. These measurements were made just S of the city of Giessen not far from the railway station. Beck fails to point out that Kreutz’s values differ by an astonishing 40 ppm between morning and afternoon (in other words measured atmospheric CO2 values are 40 ppm higher in the afternoons compared to the mornings), that atmospheric CO2 is much lower on windy days compared to windless days and so on. This is all outlined in Kreutz’s paper on the subject (translation available here: http://www.biokurs.de/treibhaus/literatur/kreutz/Kreutz_english.pdf). Clearly atmospheric CO2 measurements in, or near, urban centres give massively high CO2 values however precisely they are measured, the CO2 levels will rise dramatically in the afternoons when everyone and their machines are active, and on windless days when generated CO2 isn’t dispersed, measured CO2 levels will be higher still. That’s all pretty obvious. A skeptic might be expected to notice these rather obvious facts…. It's fascinating that Kreutz identified and postulated that some of the high values and extreme variations in atmospheric CO2 levels in his measurements were due to soil sources and industrial sources...sadly, and rather typically, the data of the honest and comptetent Kreutz has been usurped to support a creepy agenda by the dishonest... (iii) It takes an effort to make truly accurate and unperturbed atmospheric CO2 measurements. Some early practitioners made this effort. Jules Reiset, for example, in the late 19th century, developed a methodology for CO2 measurements taken on the windy Atlantic coast, far from urban centres, and determined values rather similar to those measured in contemporaneous ice cores (around 190-200 ppm in the 1890’s). We can be rather more confident in the ACCURACY of Reiset’s measurements since he (unlike pretty much all other measurers of CO2 in the 19th and early 20th century) identified the clear signature of seasonal variation due to plant growth and decay dominated by the N. hemisphere flora. (iv) We have been observing atmospheric CO2 levels with extraordinary precision and accuracy since the late 1950’s from the Manua Loa observatory, as well as dozens of other locations around the world. Atmospheric CO2 levels simply do not undergo massive jumps of up to 100 ppm over a few years. It beggers belief that CO2 sources could release and reabsorb extraordinarily massive amounts of CO2 (see #4 just below) during a period when we weren’t actually monitoring CO2 levels very well, and yet just when we started to monitor levels with considerable ACCURACY and PRECISION, atmospheric levels immediately stopped jumping around wildly. A skeptic would be inclined to doubt the accuracy of early measurements from urban centres. (v) According to Beck atmospheric CO2 rose and fell with massive jumps/falls of around 100 ppm or more during the early and mid 19th century, and the 1930’s-40s’. Since the pre-industrial level of atmospheric CO2 (around 180 ppm) is rather similar to the entire repository of CO2 in terrestrial plantlife, the assumption is that these 100 ppm jumps/falls over a few years are associated with the rapid loss and regrowth of around half the entire plant biomass on earth? Did we really lose terrestrial plant matter equivalent to the entire Amazon and African rainforests and much of Asia during a few short years, and have these regrow again in a few years afterwards? No. We know this can’t have happened during the 1930’s and 40’s since we were monitoring the terrestrial biosphere already during these years. (vi) we have rather abundant ice core measures of atmospheric CO2. Since these measures of atmospheric CO2 locked within ice are in regions far from centres of CO2 sources (urban/plant growth) they are rather reliable measures of unperturbed and well-mixed atmospheric CO2. These show rather constant levels of atmospheric CO2 near 177 (+/- around 6 ppm) during the period from 1000 AD to the mid 19th century, and then slow gradual rises that merge in the late 1950’s with the directly measured Manua Loa and other modern CO2 measures. One can certainly argue that the ice core measures are averaged, since deposited snow in ice sheets doesn’t compact and trap ice for several years after deposition, such that there is exchange with the atmosphere for some time until the atmospheric sample becomes sealed within bubbles in solid ice. However one can’t really postulate massive rise of atmospheric CO2 apparently to value as high as 470 ppm during the late 1930’s and 1940’s, without some rising of ice core CO2 levels that match this time period. Even if the ice core CO2 values are averaged over several years, high CO2 values would have to appear for this period in the ice cores. They don’t. and so on…. ---------------------------------------------- Here's some of the abundant data that indicates a rather close coupling of paleoCO2 and paleotemperature measurements right through the last 500 million years. D.L. Royer (2006) "CO2-forced climate thresholds during the Phanerozoic" Geochim. Cosmochim. Acta 70, 5665-5675. (this is a review compiles much of the published data) Even more recent studies supplement the information in Royers compilation and cover additional periods with new data sets right through the past several hundreds of millions of years: R.E. Carne, J.M. Eiler, J. Veizer et al (2007) "Coupling of surface temperatures and atmospheric CO2 concentrations during the Palaeozoic era" Nature 449, 198-202 W. M. Kurschner et al (2008) “The impact of Miocene atmospheric carbon dioxide fluctuations on climate and the evolution of the terrestrial ecosystem” Proc. Natl. Acad. Sci. USA 105, 499-453. D. L. Royer (2008) “Linkages between CO2, climate, and evolution in deep time” Proc. Natl Acad. Sci. USA 105, 407-408 Zachos JC (2008) “An early Cenozoic perspective on greenhouse warming and carbon-cycle dynamics” Nature 451, 279-283. Doney SC et al (2007) “Carbon and climate system coupling on timescales from the Precambrian to the Anthropocene” Ann. Rev. Environ. Resources 32, 31-66. Horton DE et al (2007) “Orbital and CO2 forcing of late Paleozoic continental ice sheets” Geophys. Res. Lett. L19708 (Oct. 11 2007). B. J. Fletcher et al. (2008) “Atmospheric carbon dioxide linked with Mesozoic and early Cenozoic climate change” Nature Geoscience 1, 43-48.
  4. Re #160 Wondering Aloud You state rather cryptically that "The satellite data that was supposed to prove a positive feedback from CO2 causing increased water vapor in fact show the opposite." but that doesn't seem to accord with the facts. The expectation is that as the atmosphere warms, the air will support somewhat higher levels of water vapour (since warm air has a higher saturation point for water vapour than colder air). This results in a feedback warming due to the greenhouse properties of atmospheric water vapour. So has the water vapour concentration increased during the period of massive increase in atmospheric CO2, in response to CO2-driven warming? According to the science the answer seems to be yes (as opposed to your unattributed "no"): Soden BJ et al. (2005) "The radiative signature of upper tropospheric moistening" Science 310, 841-844. Abstract: "Climate models predict that the concentration of water vapor in the upper troposphere could double by the end of the century as a result of increases in greenhouse gases. Such moistening plays a key role in amplifying the rate at which the climate warms in response to anthropogenic activities, but has been difficult to detect because of deficiencies in conventional observing systems. We use satellite measurements to highlight a distinct radiative signature of upper tropospheric moistening over the period 1982 to 2004. The observed moistening is accurately captured by climate model simulations and lends further credence to model projections of future global warming." Santer BD et al (2007) "Identification of human-induced changes in atmospheric moisture content" Proc. Natl. Acad. Sci. USA 104 15248-15253. Abstract: "Data from the satellite-based Special Sensor Microwave Imager (SSM/I) show that the total atmospheric moisture content over oceans has increased by 0.41 kg/m(2) per decade since 1988. Results from current climate models indicate that water vapor increases of this magnitude cannot be explained by climate noise alone. In a formal detection and attribution analysis using the pooled results from 22 different climate models, the simulated "fingerprint" pattern of anthropogenically caused changes in water vapor is identifiable with high statistical confidence in the SSM/I data. Experiments in which forcing factors are varied individually suggest that this fingerprint "match" is primarily due to human caused increases in greenhouse gases and not to solar forcing or recovery from the eruption of Mount Pinatubo. Our findings provide preliminary evidence of an emerging anthropogenic signal in the moisture content of earth's atmosphere." Rind D et al (1991) "Positive Water-Vapor Feedback In Climate Models Confirmed By Satellite Data" Nature 349, 500-503. Abstract: "Chief among the mechanisms thought to amplify the global climate response to increased concentrations of trace gases is the atmospheric water vapour feedback. As the oceans and atmosphere warm, there is increased evaporation, and it has been generally thought that the additional moisture then adds to the greenhouse effect by trapping more infrared radiation. Recently, it has been suggested that general circulation models used for evaluating climate change overestimate this response, and that increased convection in a warmer climate would actually dry the middle and upper troposphere by means of associated compensatory subsidence1. We use some new satellite-generated water vapour data to investigate this question. From a comparison of summer and winter moisture values in regions of the middle and upper troposphere that have previously been difficult to observe with confidence, we find that, as the hemispheres warm, increased convection leads to increased water vapour above 500 mbar in approximate quantitative agreement with the results from current climate models. The same conclusion is reached by comparing the tropical western and eastern Pacific regions. Thus, we conclude that the water vapour feedback is not overestimated in models and should amplify the climate response to increased trace-gas concentrations." Allan RP and Soden BJ (2008) "Atmospheric warming and the amplification of precipitation extremes" Science 321, 1481-1484. Abstract: "Climate models suggest that extreme precipitation events will become more common in an anthropogenically warmed climate. However, observational limitations have hindered a direct evaluation of model- projected changes in extreme precipitation. We used satellite observations and model simulations to examine the response of tropical precipitation events to naturally driven changes in surface temperature and atmospheric moisture content. These observations reveal a distinct link between rainfall extremes and temperature, with heavy rain events increasing during warm periods and decreasing during cold periods. Furthermore, the observed amplification of rainfall extremes is found to be larger than that predicted by models, implying that projections of future changes in rainfall extremes in response to anthropogenic global warming may be underestimated." Note that this effect (atmospheric temperature-induced feedback in atmospheric water vapour concentrations) can also be observed as a result of atmospheric cooling, for example due to rapid volcanic eruption-induced cooling: Soden BJ et al. (2002) "Global cooling after the eruption of Mount Pinatubo: A test of climate feedback by water vapor" Science 296,727-730 Abstract: "The sensitivity of Earth's climate to an external radiative forcing depends critically on the response of water vapor. We use the global cooling and drying of the atmosphere that was observed after the eruption of Mount Pinatubo to test model predictions of the climate feedback from water vapor. Here, we first highlight the success of the model in reproducing the observed drying after the volcanic eruption. Then, by comparing model simulations with and without water vapor feedback, we demonstrate the importance of the atmospheric drying in amplifying the temperature change and show that, without the strong positive feedback from water vapor, the model is unable to reproduce the observed cooling. These results provide quantitative evidence of the reliability of water vapor feedback in current climate models, which is crucial to their use for global warming projections." and so on....
  5. For thoes of you who said that recent cooling was due to la Nina and that the trend would end in the second half of the year. Take a look at this NOAA data, it tends to prove you wrong. It looks like this August is the 6th coolest in the last 30 years. http://www.ncdc.noaa.gov/oa/climate/research/2008/aug/global.html#year-to-date
  6. Three problems wth that Truthseeker: (i) one can't presume trends by looking at data from single months! (ii) I doubt anyone would have stated that the La Nina was the sole cause of a period of relative cooling in a warming world. We're smack at the bottom of the solar cycle, so one doesn't expect record breaking temperatures for a while (the next major El Nino in a few years is likely to give us the new record). (iii) Your interpretation seems somewhat odd anyway. From the data you've linked to we can see that: a. August 2008 is the 10th warmest in the global surface record out of 129 years. Clearly therefore there can only be 9 Augusts warmer than it in the last 30 years (not 24 as you intimate). b. June to August 2008 is the 9th warmest summer in the global surface record of 129 years. Clearly therefore there can only be 8 summers warmer than it in the last 30 years. c. and so on (it's the 9th warmest Jan-August period on record)
  7. Re: "6th coolest in the last 30 years vs 10th warmest in the global surface record out of 129 years" Does this have any relevance whatsoever?
  8. Re #176 Quietman Truthseeker considered that it was relevant since he (she?)bothered to write a post about it. The data from the NOAA site just wasn't related very well (perhaps Truthseeker isn't really a truth seeker!). Of course (as I said in my post) one can't assess trends by examining single months. Perhaps the relevance relates to those drip drip efforts to downplay the effects of global warming! Or perhaps the relevance is that in a year that doesn't "seem" that warm, where we've had the effects of a strong La Nina at the start of the year, and we are additionally smack at the bottom of the solar cycle (remember that the Tung and Camp paper that you have been cheerleading supposedly gives us a 0.2 oC of cooling at the solar minimum compared to the maximum), we've had the 10th warmest Jan-August on record... ...that's pretty remarkable! ...or perhaps not.....
  9. ..sorry I meant the 9th warmest Jan-August on record. best to be accurate!
  10. chris As you are aware, I don't think the warming is from the sun alone, anymore than from GHGs. I made my arguments in the volcanos thread so I won't put an argument here.
  11. Re #179 Well yes, the large scale global warming of the last 30-odd years hasn't had a significant solar component. If anything the solar contribution has been a slight cooling one during the last several decades. Even those that push for solar contributions such as the cosmic ray flux concede that the solar contribution has been negligible at best. So solar contributions to warming in recent decades just isn't a viable proposition. The evidence is flat against it. Otherwise it's not obvious what else can have contributed significantly to warming other than the very well characterized massive enhancement of the Earth's greenhouse effect.
  12. chris Re: Otherwise it's not obvious - Greenhouse gases yes, to some large extent. But there is still more to it in my view. PS I put a link to yet another GHG in the volcano thread that might interest you.
  13. pps Sorry, I put it in the "CO2 measurements are suspect" thread since I could not find a more pertinant thread for it.
  14. It is becoming more apparent that we picked either a very bad time or a very good time to screw with mother nature because the earth itself is very active as well as the sun. This is not a coincidence.
  15. FYI: University of Almeria (Spain): A study by Pablo Campra (published in the Journal of Geophysical Research)on the effect of greenhouses in western Almeria province reports an 0.3C/decade drop in temp over the last 25 yrs....roughly the same as the rise in temp for the rest of the world during that time. Western Almeria has over 30,000 hectares of plastic covered greenhouses supplying produce to European supermarkets. The plastic sheeting increases the local albedo, reflecting sunlight back into space. The plants grown also act as a carbon 'sink' absorbing around 10 tonnes of carbon/hectare...an annual equivalent of 300,000 tonnes of carbon.
  16. Mizimi That is interesting. I am planning to build a greenhouse to counteract the cooling conditions here. Is the increased albedo because of the plastic? I was planning on using tempered glass and translucent fibreglass.
  17. QM: Yes, the plastic is modified polythene which is translucent. Part of the effect is due to albedo (colour) and part due to low incident angle reflection (shiny surface). Both effects diminish with age, (darkening of the colour and accumulation of dust) but the plastic only lasts about 3 years and then is replaced. Much of the plastic is recycled ( even the plastic string used for baling and tying plants!!) and turned into garden and playground equipment. Some is even re-inforced with steel bar and used as I beams for lightweight construction. True greenhouses hold temps up because they minimise losses thro' convection/windage rather than trapping heat by preventing re-transmission of IR ( although you can buy IR glass which acts just like a GG...a bit expensive tho'). Translucent fibreglass will do the same but I do not know the light transmission characteristics of this material...you might end up cutting the light frequencies the plants need. Why tempered glass? Ordinary 2 or 3mm plain window glass is perfectly OK and the cheapest. Don't forget to have vents to control the temp in summer....you don't want to cook the plants!
  18. Might the heating of the oceans (which cover 75% of the planet and are the largest heat reservoir on the planet) by a sun that has been more active over the past 60 years than anytime in the previous 1150 years have something to do with the continuing rising temps from the late 1970`s till 1998. You know common sense, err, storage radiators of the 60`s, heat them up at night get heat all through the next day. Are you dumb enough to expect all the accumulated heat in the oceans to disappear overnight just because the heaters been turned off, of course the correlation is still sound. Pity you did not show the graph ending at 2008.
  19. chris at 09:48 AM on 7 October, 2008. If CO2 is the driver why has the temperature declined since 1998 when CO2 is still increasing. It`s the sun you fool, sun warms the oceans, which warm the land mass, you know, the gulf stream, warm oceans release CO2, sun goes dormant, oceans cool, land temps decline, CO2 also begins to decline, simple.
  20. re #186/187 rob, the sun certainly keeps us snug, but it hasn't made any significant contribution to the marked warming of the last 30 odd years! (i) remember that the paper that indicates high solar activity "over the past 60 years" in the context of the previous 1150 years (Usoskin 205; link in John Cook's top post), only addresses the relationship between solar output and the Earth's surface temperature up 'til 1975. Since that time the solar output has been tending downwards a tad, while the Earth's surface temperature has gone up markedly. As the authors indicate, variations in solar outputs can't have made a significant contribution to the marked warming of the last 30-odd years. (ii) Storage heaters once warmed up and disconnected from their energy supply do continue to release heat through the next day (they're full of bricks!), but the maximum heat release after disconnecting from the mains occurs immediately, and then drifts downwards (an exponential decay of release of thermal energy as the heater tends towards a new equilibrium temperature equivalent to ambient temperature - it's slightly more complicated since the ambient temperature isn't constant and in any case is (hopefully!) responding to the hot bricks). So the oceans may release thermal energy stored following a period of high solar output, but the maximal rate of release of thermal energy should occur pretty soon following a downward drift in solar output, and this release of thermal energy will drift downwards much like your storage heater. However that's completely contrary to the temperature record. The solar output maxed around 1950, and since then has been pretty constant, drifting downwards a tad in the last 20-odd years [see, for example, Mike Lockwood and C. Fröhlich (2008) "Recent oppositely directed trends in solar climate forcings and the global mean surface air temperature. II. Different reconstructions of the total solar irradiance variation and dependence on response time scale"; Proceedings of The Royal Society A 464, 1367–1385; as well as the long list of similar studies linked in John Cook's top post under "Other studies on solar influence on climate"]. A storage heater doesn't hold onto all of its heat for a long, long period before starting to release it. Neither does the ocean. (ii) Another difficulty with your argument relates to the "top of the atmosphere" radiation budget. I’m pretty sure that satellite monitoring of solar irradiation and that returning from space shows an imbalance (‘though need to hunt down the relevant papers). There's excess solar energy being retained in the climate system, consistent with greenhouse gas warming. If the warming was due to some magical delayed release of stored thermal energy in the oceans, one would expect a top of the atmosphere balance of solar and re-radiated energy, or even a slight excess dissipation of energy into space. I don't think the data supports that interpretation. (iv) Notice that the temperature hasn't declined since 1998. The temperature has been on a rising trend from the mid- 1970's, through the 1980's, 1990's and early 2000's. The surface temperature in 1998 was lifted by around 0.2 oC above the trend by the strongest El Nino of the 20th century [see, for example: http://data.giss.nasa.gov/gistemp/2005]. In such an event solar thermal energy absorbed by the ocean surface is anomalously spread over vast tracts of the Western Pacific and Indian ocean to the Eastern Pacific and the S. American coast, combined with the suppression of cold water upwelling along the Western S. American coast. This gives us a marked but transient upward jump in the Earth's surface temperaure. In 2005 we pretty much reached the 1998 surface temperature without the large temperature enhancement of a strong El Nino. So the temperature was still trending upwards through 2005... (v) Note also that the increased surface temperature resulting from enhanced greenhouse gas concentrations relates to the new equilibrium temperature corresponding to the Earth’s new “balance” in response to an enhanced forcing. But of course both at equilibrium, and during the “journey” towards the new equilibrium, stochastic (and non-stochastic) elements of the climate system introduces “noise”. So we don’t expect a perfect progressive increase in temperature as greenhouse gas concentrations rise. We only have to look at the temperature record to see that the marked warming of the last 30-odd years constitutes a rising trend “overlaid” with noise that takes the year on year temperature on short upwards and downwards excursions. (vi) Note also that while changing solar output or the very slow cyclic drift of the Earth's orbital properties that underlie the ice age cycles does cause CO2 to re-equilibrate somewhat from the oceans to the atmosphere, this effect is very, very small in the context of current rising atmospheric CO2. So while atmospheric CO2 levels rose by around 90-100 ppm during the 5000 years of the last glacial to interglacial transition (in response to a temperature rise of around 6 oC), we've had a 70 ppm rise in atmospheric CO2 since the start of the 1960's. So atmospheric CO2 is rising more than 100 times faster now than during the ice age transitions that are the best example of your scenario of heat-induced release of CO2 from the ocean. And of course we known that CO2 isn't coming out of the oceans in response to warming. CO2 is being forced INTO the oceans in prodigious amounts.
  21. Mizimi I was thinking of safety, my grandchildren are 6, 4, 2 years and the latest 3 weeks old. I don't want to see them fall into a plain glass pane. I had in mind green translucent fibreglass for the roof and clear double pane 3'x 5' anderson casements mounted sideways for the walls. The andersons wont cost anything as they are currently on the house and I am replacing them with something easier to maintain. It's the roof panels that I am not sure about. Any thoughts?
  22. rob Your comment 188 had me laughing. Not at you however. It's the way you worded your statement. I do appreciate a good jab on occasion.
  23. chris On CO2 entering or exiting the water. That is an assumption. There is no way to know if that is a fact. You like to say lets not pretend to not know what we do know. In this case lets not pretend to know what we dont know. Given the current state of tectonic activity under the surface of the oceans there is no way in hell you can know what direction CO2 is travelling. Did you actually read any of the articles that I gave links to? In this same argument at Live Science I was challanged to provide just 20 papers by scientists refuting AGW. When I provided links to 20 papers (not articles) I got the response that over half were not peer reviewed. They were not peer reviewed because of fear. This buddy review system means that if you don't agree you must be wrong. Rhodes Fairbridge was wrong because he was not peer reviewed. Here's a news flash for you, he was not peer reviewed because he had no peers. The man was a genius. Spencer gets knocked for his religious beliefs. I don't share his belief but I don't call him crazy for it. That is what is known as grasping at straws.
  24. Re #192 That's quite incorrect Quietman. We know very well that our emissions are forcing up the oceanic CO2 concentration by prodigious amounts. We can measure this in a number of ways. We know quite well the scale of our emissions and can determine that around 40-50% of these have remained in the atmosphere. Much of the rest has gone into the oceans. We know that this has to occur from simple understanding of physical equilibria (Le Chatelier's principle). And we can measure this directly through analysis of inorganic carbon in the oceans, or via the reduction in ocean pH [see abstracts of Sabine et al (2004) and Feely et al (2004) below, for example]. There are many measures that demonstrate without question that we are pumping CO2 into the atmosphere in massive amounts and that this is disturbing the CO2 equilibrium between the atmosphere and the oceans well towards oceanic CO2 dissolution and dissociation into bicarbonate, and H+: CO2(air) <->CO2(aq)<-> H2CO <->HCO3- + H+ <-> CO3-- + H+ That's very well understood and characterised in the real world. We really shouldn't pretend not to know what we do know very well! Sabine CL et al (2004) The oceanic sink for anthropogenic CO2 Science 305, 367-371. Abstract: "Using inorganic carbon measurements from an international survey effort in the 1990s and a tracer-based separation technique, we estimate a global oceanic anthropogenic carbon dioxide (CO2) sink for the period from 1800 to 1994 of 118 +/- 19 petagrams of carbon. The oceanic sink accounts for similar to 48% of the total fossil-fuel and cement-manufacturing emissions, implying that the terrestrial biosphere was a net source of CO2 to the atmosphere of about 39 +/- 28 petagrams of carbon for this period. The current fraction of total anthropogenic CO2 emissions stored in the ocean appears to be about one-third of the long-term potential." R.A. Feely et al (2004) Impact of Anthropogenic CO2 on the CaCO3 System in the Oceans Science 305, 362-366. Abstract: "Rising atmospheric carbon dioxide (CO2) concentrations over the past two centuries have led to greater CO2 uptake by the oceans. This acidification process has changed the saturation state ofthe oceans with respect to calcium carbonate (CaCO3) particles. Here we estimate the in situ CaCO3 dissolution rates for the global oceans from total alkalinity and chlorofluorocarbon data, and we also discuss the future impacts of anthropogenic CO2 on CaCO3 shell–forming species. CaCO3 dissolution rates, ranging from 0.003 to 1.2 micromoles per kilogram per year, are observed beginning near the aragonite saturation horizon. The total water column CaCO3 dissolution rate for the global oceans is approximately 0.5 ± 0.2 petagrams of CaCO3-C per year, which is approximately 45 to 65% of the export production of CaCO3."
  25. Re #192 I'm don't understand the rest of your post. What articles are you referring to? As for your non-sciency assertions about Rhodes Fairbridge and "Spencer" (Spencer Tracy?!), I can't glean what you're referring to in the context of my post or this thread. Whatever you are referring to, we don't evaluate the assertions of others using hero-worship or personal preferences. Instead (if we are interested in the science), we look at the EVIDENCE that they might use to support their statements.. Your assertions about peer review and "fear" are not very intersting, since they're just conspiracy theory bluster and without any foundation whatsoever! Let's try to scientific and skeptical!

Prev  1  2  3  4  5  6  7  8  9  10  11  12  13  14  15  16  17  18  19  20  Next

Post a Comment

Political, off-topic or ad hominem comments will be deleted. Comments Policy...

You need to be logged in to post a comment. Login via the left margin or if you're new, register here.

Link to this page


The Consensus Project Website

THE ESCALATOR

(free to republish)


© Copyright 2024 John Cook
Home | Translations | About Us | Privacy | Contact Us