Climate Science Glossary

Term Lookup

Enter a term in the search box to find its definition.

Settings

Use the controls in the far right panel to increase or decrease the number of terms automatically displayed (or to completely turn that feature off).

Term Lookup

Settings


All IPCC definitions taken from Climate Change 2007: The Physical Science Basis. Working Group I Contribution to the Fourth Assessment Report of the Intergovernmental Panel on Climate Change, Annex I, Glossary, pp. 941-954. Cambridge University Press.

Home Arguments Software Resources Comments The Consensus Project Translations About Support

Bluesky Facebook LinkedIn Mastodon MeWe

Twitter YouTube RSS Posts RSS Comments Email Subscribe


Climate's changed before
It's the sun
It's not bad
There is no consensus
It's cooling
Models are unreliable
Temp record is unreliable
Animals and plants can adapt
It hasn't warmed since 1998
Antarctica is gaining ice
View All Arguments...


Username
Password
New? Register here
Forgot your password?

Latest Posts

Archives

Global cooling - Is global warming still happening?

What the science says...

Select a level... Basic Intermediate

All the indicators show that global warming is still happening.

Climate Myth...

It's cooling

"In fact global warming has stopped and a cooling is beginning. No climate model has predicted a cooling of the Earth – quite the contrary. And this means that the projections of future climate are unreliable." (source: Henrik Svensmark)

At a glance

Earth's surface, oceans and atmosphere are all warming due to our greenhouse gas emissions, but at different rates. Some places are also warming much faster than others: parts of the Arctic for example. That variability is partly because other phenomena act to offset or enhance warming at times. A good example are the effects of La Nina and El Nino, an irregular variation in winds and sea surface temperatures over the tropical eastern Pacific Ocean that can influence temperatures and rainfall patterns right around the world.

El Nino causes even warmer years whereas La Nina tends to peg temperatures back to an extent. Thus 2023 – an El Nino year - was the warmest year on record, according to the USA-based National Oceanic and Atmospheric Administration, but other recent years have not been far behind – 2016 and 2019 are in second and third place respectively. The worrying thing is that 2019 only saw a mild El Nino. And even with a La Nina featuring, 2021 and 2022 were, respectively, still the seventh and sixth hottest years on record.

The year 1998 featured a massive El Nino and consequent temperature spike that was a strong outlier, well above the steady upward trend. That spike and the subsequent return to a more “normal” warming pattern led to claims in the popular media that global warming had “paused” or had even stopped. This was a typical misinformation tactic that, as usual, time has proved wrong. As things currently stand, the top ten warmest years have all been since 2010 and 1998 is nowhere to be seen any more. By modern standards, it simply wasn't warm enough.

Please use this form to provide feedback about this new "At a glance" section. Read a more technical version below or dig deeper via the tabs above!


Further details

In the years following 1998, at the time the hottest year on record, there was a concerted misinformation campaign to convince the public that global warming had variously slowed down, stopped or even that we were entering a period of cooling. Of course, we now know that such claims were nowhere near correct. In today's top ten ranking of warmest years, the year 1998 is nowhere to be seen. It simply wasn't warm enough. So let's take a look at how the claims came about, because they reveal insights into the methodology of those who design and spread misinformation.

The entire planet continues to accumulate heat due to the energy imbalance created through our greenhouse gas emissions. Earth's atmosphere is warming. Oceans are accumulating energy. Land absorbs energy and ice absorbs heat to melt. Year to year ups and downs in these things are simply noise, reflecting variations in how that heat is moved around the planet and what other influences are at work, such as the irregular El Nino Southern Oscillation (ENSO) that can nudge the global temperature one way or another by up to 0.3C. That's why 1998 was such a warm outlier: it coincided with a very strong El Nino. El Nino conditions always warm things up whereas La Nina conditions cool things down (figure 1).
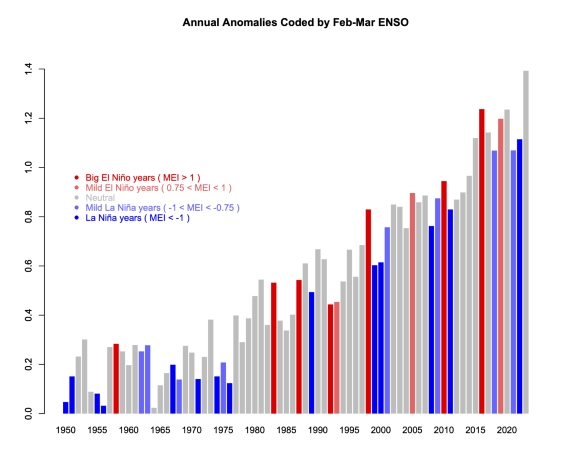
GISTEMP-ENSO-coded-plot from RealClimate

Figure 1: GISTEMP anomalies to end-2023 (with respect to late 19th Century), coded for ENSO state in the early spring - red is El Nino, blue La Nina. 2023 is in grey because that El Nino did not develop until later in the year. Graphic courtesy of Realclimate.

Climatologists routinely use multi-decadal blocks of time when presenting temperature trends for a very good reason. Such blocks allow you to stand back and look at the bigger picture. Due to the noise, taking a much shorter time-span – say just five or ten years – allows you to say anything you like about trends, depending on the particular block you pick.

For example, if you picked a short run of 5-10 years ending in 1998, you could have – if you were so inclined – said, “look how fast it's warming!” Likewise, taking a number of years starting with 1998, you could have made the equally invalid claim that global warming had stopped. And of course, that claim was made, vociferously, in the early-mid 2000s. It was a classic example of cherry-picking: the manifestly unscientific practice of choosing the data that supports the argument one is paid to make on behalf of those who sponsor misinformation campaigns. Once you know about such tricks, you can challenge them yourself. You can ask someone why they showed such a short temperature record when showing a much longer one is the normal practice.

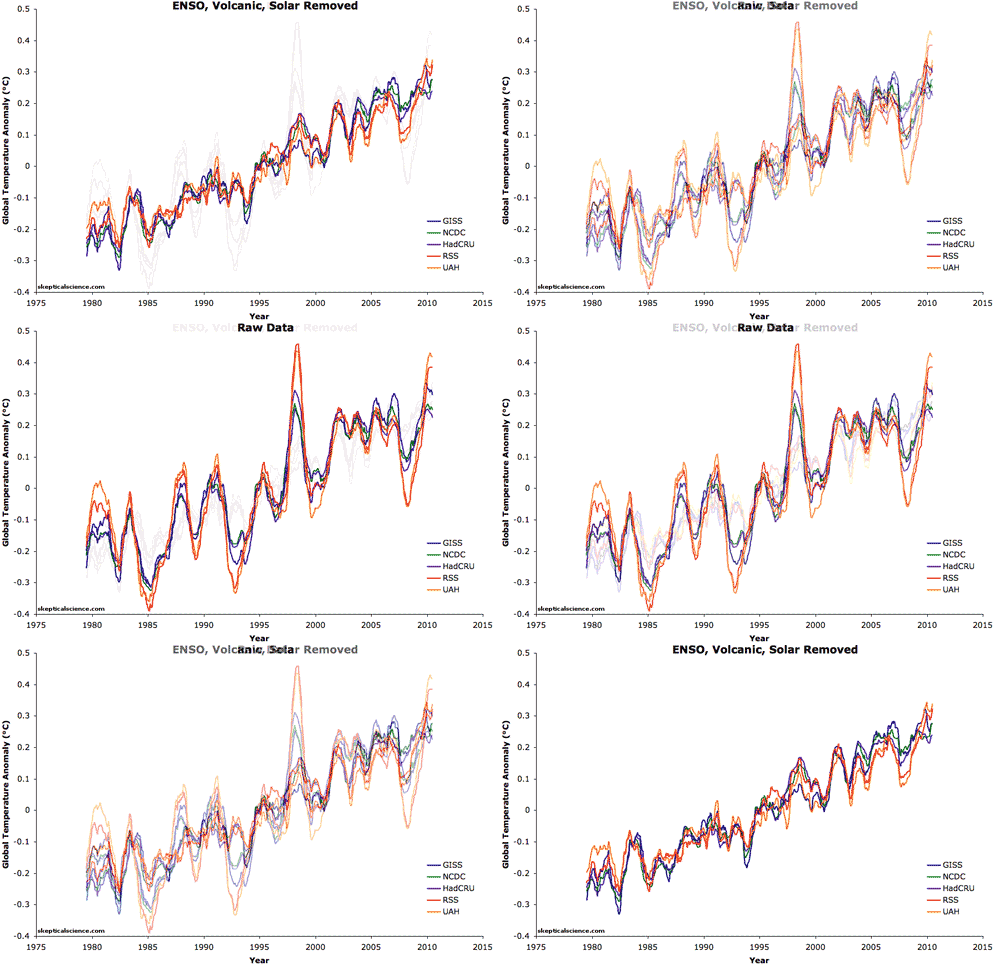
It is difficult but technically possible to filter out the noise described above from temperature datasets. In the paper Foster and Rahmstorf (2011) the authors used the statistical technique of multiple linear regression to filter out the effects of ENSO, solar and volcanic activity (Figure 2). They found that the underlying global surface and lower atmosphere warming trends have in fact remained steady in recent years. There's still noise in there but nowhere near as much. We were still warming all along.

before/after filtering

Figure 2: Five datasets of global surface temperature and lower troposphere temperature are shown before and after removing the short-term effects of the El Niño Southern Oscillation (ENSO), solar variability, and volcanic aerosols.  A 12-month running average was applied to each dataset.

Last updated on 4 June 2024 by John Mason. View Archives

Printable Version  |  Offline PDF Version  |  Link to this page

Argument Feedback

Please use this form to let us know about suggested updates to this rebuttal.

Related Arguments

Further reading

Update

On 21 January 2012, 'the skeptic argument' was revised to correct a minor formatting error.

Denial101x video

Here is a related video lecture from Denial101x - Making sense of climate science denial

Comments

Prev  1  2  3  4  5  6  7  8  9  10  11  12  13  Next

Comments 151 to 175 out of 323:

  1. muoncounter at 02:39 AM, most animals are very sensitive to subtle changes occurring in their natural environment. This is almost always reflected in their reproductive process where breeding rates adjust according to the coming seasonal conditions. For those animals that produce multiple offspring, the "choice" as to how many there will be is made at the beginning of the breeding cycle well before the conditions that will support the increased numbers that eventuate are evident, to man at least. It is not a case of always producing multiple births and the excess perish, animals that normal carry one offspring, or at times miss breeding altogether, will suddenly carry multiple embryo's. Another example that is often observed is water birds building nests at elevations that seem to account for the coming seasonal water level. I don't see this as strange, as whilst most people are becoming even more oblivious to coming change, (how many people need to be told by the TV news that it's going to rain whilst others sense it days, even weeks ahead), the change when it eventuates is not a spontaneous happening, but the culmination of a long process where subtle indicators begin to appear well before the eventual outcome. This is witnessed by our increasing ability to produce more accurate short and long range forecasts, the difference between those who have limited ability, and those who seem to have an uncanny ability, is that the latter have discovered what the most relevant indicators are, that combined produce an accurate prediction. Whist man must rely on formulas and theories in order to bring it all together, and this is the important bit, it is all based on measurements that are taken from the physical world. Now taking the forecasting of SST's as an example, some researchers believe they now have the ability to accurately forecast perhaps two years ahead. That means that the indicators they are tracking this very day are changing in such a way, that they indicate the beginning of a process leading to an eventual outcome in two years time. It may well be that that process is already well advanced, but man's ability to sense it, and thus measure it is still very limited. Thus if we accept that what occurs at any point in time is not a spontaneous event, (even though some people always seem to get soaked because they didn't have a clue it was going to rain), but instead a result of a long ongoing process, don't you think that at least some of the animals that live in that physical world are also able to sense well ahead of time, those subtle changes that we are only finally learning to map and understand.
  2. johnd, and we must also acknowledge that, every single year, some birds fly off in the wrong direction for their escape from winter.
  3. johnd#151: "I don't see this as strange" Probably not. But what is strange is the ability of deniersphere bloggers to trumpet an event like this as if it means something. From the post, Small numbers of juvenile harp seals are typically found each winter stranded along the coast of the northeastern United States. But this year, well over 100 adult harp seals – not juveniles – have been spotted … In some areas they’re reporting three times the normal number of sightings ... WUWT omits the part of the article where we learn that “the number of harp seals found in the northwest Atlantic” is “9 million.” So a hundred lost seals are news for Watt$ and co. But the 8,999,900 who know where they are don't get a mention. Now that's a cherrypick!
  4. I am suprised no-one has mentioned that Harp Seals in the North Atlantic breed on the sea ice in Canada. There was little or no sea ice in this area of Canada this winter. The Harp seals had no where to breed on the ice so some wandered off. The appearance of Harp seals in the USA is more likely due to loss of habitat in Canada, due to the ice melting from AGW, than because they are physic and think it is getting colder.This article from the Humane society of Canada claims that the seals were forced to give birth on shore in 2010 (I could not find a scientific reference for harp seals birthing on shore, there has not been enough time for it to be published). Lack of suitable habitat would account for seals wandering more than usual.
  5. michael sweet, the other reason more harp seals show up farther away is that there are more of them. See figure 7 here: http://www.dfo-mpo.gc.ca/fm-gp/seal-phoque/seal_harp_%202009-eng.pdf Their biggest problem by far is hunting, not ice.
  6. Eric, We can agree that Harp seals appearing in small numbers in the Northern USA are not an indication of global cooling.
  7. We seem to have a new so-called skeptic argument : "Don't trust any of those elitist scientists and their modern, new-fangled, hoity-toity instruments and measurements - nature knows the truth and we will trust them to reveal their secret knowledge to those who we want to believe can understand what they are trying to say to us. Until anyone can actually speak to nature and interpret it, we can never be disproved and can believe what our internet gurus and blog scientists tell us !"
  8. Johnd #151...So should I use a crystal ball or tea leaves? What do you recommend? We are talking about science here man. Can you propose a mechanism by which these sensory-special organisms actually predict changes in climate? Weather maybe, and of course seasonal changes, but climate?
  9. Following Phil Jones' update yesterday (10th June 2011), this subject has become a hot potato in the comments over at Carbon Brief. Anyone fancy offering expert support?
  10. A casual review of daily averages of high-arctic (80-90 N) air temperatures over the 50-year record suggests that summer temperatures in this particular region of the Earth have decreased a smidgen over time, according to archived data at DMI’s Centre for Ocean and Ice . A discussion on Neven’s Arctic Sea Ice Blog has brought forward a couple of possible explanations for this which sound quite plausible to me, but I have no expertise in this area. Do you know of any published discernment on this?
  11. The gulf stream might be changed because of the salt concentration decreasing due to ice melting in poles. This stream is supposed to bring heat from tropics. I wonder `how strong this effect will be for the European coasts...
  12. Perhaps someone can give me information. There has been no warming of the atmosphere since 2001. http://www.woodfortrees.org/plot/hadcrut3vgl/from:2001/plot/hadcrut3vgl/from:2001/trend Since there has been millions of tons of CO2 emitted why is that ? The models say that there is a warming offset by aerosols causing no overall warming. To get the warming desired the aerosols are projected to disappear and the temperature climb. [Does that about cover it ?] Does anyone have a link to a graph of aerosol emissions ? Does anyone have a way of determining how much a ton of aerosols affects the temperature of earth ? [Or does each modeler tweak the values to suit his model sensitivity ?] Or has the argument shifted to "the heat is being radiated out to space" or hidden in the oceans below the top 700 M ? [anywhere that it isn't causing much if any warming ?]
    Response:

    [DB] Please separate these questions into individual comments placed on more appropriate threads; as constructed this comment amounts to a Gish Gallop & thus needs no refuting.  Thanks!

  13. NETDR, yes we've seen cherry picking before. Let's look at this a bit more broadly, shall we? Start year Trend 1850 - 2000 Positive 2001 - 2005 Negative 2006 - 2008 Positive 2009 - 2010 Negative So... you can find a negative trend from seven of the past 161 years to present. None of which shows a statistically significant trend, because they were all within the past decade. There have been much more pronounced 'cooling' trends in past decades despite rising CO2 levels. There is nothing at all surprising about that or the current downturn... because CO2 is not the only thing which impacts atmospheric temperatures.
  14. CB (-Snip-)! The reason that we have failed to warm since 2001 is that the ocean currents [PDO] have turned negative and we will have more La Nina's than El Nino's for 20 to 30 more years. http://www.cpc.ncep.noaa.gov/products/analysis_monitoring/ensostuff/ensoyears.shtml Notice that since 2000 the El Nino's have about balanced the La Nina's and it has warmed in the former and cooled in the latter. 2011 is a la Nina year and 2012 is predicted to be one too so it will be cooler probably for many years. The slow warming is of interest only to climatologists and in no way is a problem for mankind. (-Snip-).
    Response:

    [DB] "The slow warming is of interest only to climatologists and in no way is  a problem for mankind."

    Unsupported, and off-topic, handwaving.  See the "It's not Bad" thread.

    Moderation complaints snipped.

  15. NETDR wrote : "There has been no warming of the atmosphere since 2001. http://www.woodfortrees.org/plot/hadcrut3vgl/from:2001/plot/hadcrut3vgl/from:2001/trend" Why not use all four temperature data sources ? There, you will find that the two smallest trends (which are negative) are HadCrut and RSS, while the larger (positive) trends are GISS and UAH. Why do you prefer the HadCrut figures ?
  16. 164, NETDR,
    There is a 1/2 ° C warming trend superimposed on a 60 year sine wave from ocean currents...
    Citation of peer reviewed evidence of this, please.
    The reason that we have failed to warm since 2001 is that...
    Citation of peer reviewed evidence of this, please. And not just that we're going to have more La Nina's, but rather evidence that this is going to affect the long term global mean temperature.
    ... the El Nino's have about balanced the La Nina's and it has warmed in the former and cooled in the latter.
    Yes, pretty much as they always have. Is there a point in this, other than to imply without evidence or logic that ENSO itself causes warming or cooling?
    ...it will be cooler probably for many years.
    Citation of peer reviewed evidence of this, please.
    The slow warming is ... in no way is a problem for mankind.
    You don't understand the science. Please read Spencer Weart's The Discovery of Global Warming. Then come back here and go step by step through this site, like a true skeptic, trying to refute your own beliefs/arguments, and see what you discover. Hint: The globe has not been cooling. You might try actually reading the post on which you are commenting.
  17. Netdr: "we have failed to warm since 2001" No the wookie doesn't win because the wookie's base premise is incorrect: 2010 tied for Warmest Year on Record. Although since you like to cherry pick, here's 2011's hottest summer on record.
  18. CB I entirely agree. There is a 1/2 ° C warming trend superimposed on a 60 year sine wave from ocean currents, but we cannot discuss this on this thread it is contrary to the "let the wookie appear to win policy"! The reason that we have failed to warm since 2001 is that the ocean currents [PDO] have turned negative and we will have more La Nina's than El Nino's for 20 to 30 more years. http://www.cpc.ncep.noaa.gov/products/analysis_monitoring/ensostuff/ensoyears.shtml Notice that since 2000 the El Nino's have about balanced the La Nina's and it has warmed in the former and cooled in the latter. 2011 is a la Nina year and 2012 is predicted to be one too so it will be cooler probably for many years. The slow warming is of interest only to climatologists and in no way is a problem for mankind. (-Snip-).
    Response:

    [DB]  Your sudden, laser focus on short, statistically insignificant timescales is rather puzzling, given your earlier comment:


    Quibbling about whether it warmed or cooled during the last 12 years is pointless.


    Repetitive complaints about moderation snipped. 

    Unsupported summary musings (i.e., handwavings) struck out.  Please stick to the science, please.

  19. 164, NETDR, Nicely cherry-picked year. Well done. And naturally ending in a La Nina. Also well done. Here's the raw data, with your trends (for all data sources).
  20. NETDR wrote : "The reason that we have failed to warm since 2001 is that the ocean currents [PDO] have turned negative and we will have more La Nina's than El Nino's for 20 to 30 more years." Trying to ignore your cherry-pick of HadCrut data (and noting that two out of the four datasets show positive trends, i.e. warming), what do you base your prediction of "20 to 30 more years" on ? By the way, although I haven't analysed the data, the Japanese Meteorological Agency's dataset seems to show a positive trend since 2001 too. Any thoughts ?
  21. And WoodForTree's own Temperature Index ("...the mean of HADCRUT3VGL, GISTEMP, RSS and UAH, offset by their baseline differences...") also seems to show a positive trend. Any thoughts, NETDR ?
  22. Tamino answer's part of #160 Tor B's comment at with a recent post on Arctic temperatures using NCAR data. He has a number of interesting graphs for the 80-90N region, and they appear to show significant warming in that region. I'm unsure as to the mechanisms discussed at Neven's blog however as the link is to his homepage.
  23. DB) Your sudden, laser focus on short, statistically insignificant timescales is rather puzzling, given your earlier comment: ************* Since my point is that the sine wave has turned negative and that we have entered a time of cooling because of more La Nina's than El Nino's the short term cooling is entirely germane. http://www.woodfortrees.org/plot/hadcrut3vgl/from:2005/plot/hadcrut3vgl/from:2005/trend http://www.cpc.ncep.noaa.gov/products/analysis_monitoring/ensostuff/ensoyears.shtml A negative PDO doesn't guarantee all La Nina's it just means the dice are loaded. The El Nino of 2010 caused a blip of warming. Since 2011 is a La Nina year and predictions seem to predict that 2012 will be too. http://www.cpc.noaa.gov/products/analysis_monitoring/lanina/images3/nino34SSTMon.gif It doesn't make much sense to focus on the 1978 to 1998 warming since conditions have changed since then. The sea level has gone down by 1/4 inch in the last year or so as you might expect if it were cooling. [short term] http://sealevel.colorado.edu/ I contend that we are at the start of a 20 to 30 year cooling cycle.
  24. Netdr#173: "we are at the start of a 20 to 30 year cooling cycle." Yet just here, you posited that it has failed to warm since 2001. So we are ... 10 years into your 20-30 year cooling? And we just had the hottest year on record. Funny kind of cooling, that.
  25. NETDR - right. And if climate science turns about to be correct (ie it keeps warming as predicted), will you graciously return here to agree and then move on to work for GHG reduction? Or it will it be try to find another excuse for inaction?

Prev  1  2  3  4  5  6  7  8  9  10  11  12  13  Next

Post a Comment

Political, off-topic or ad hominem comments will be deleted. Comments Policy...

You need to be logged in to post a comment. Login via the left margin or if you're new, register here.

Link to this page


The Consensus Project Website

THE ESCALATOR

(free to republish)


© Copyright 2024 John Cook
Home | Translations | About Us | Privacy | Contact Us