


 Arguments


How much is sea level rising?
What the science says...
| Select a level... |
 Basic
Basic
|
 Intermediate
| |||
|
A variety of different measurements find steadily rising sea levels over the past century. |
|||||
Climate Myth...
Sea level rise is exaggerated
"We are told sea level is rising and will soon swamp all of our cities. Everybody knows that the Pacific island of Tuvalu is sinking. ...
Around 1990 it became obvious the local tide-gauge did not agree - there was no evidence of 'sinking.' So scientists at Flinders University, Adelaide, set up new, modern, tide-gauges in 12 Pacific islands.
Recently, the whole project was abandoned as there was no sign of a change in sea level at any of the 12 islands for the past 16 years." Vincent Gray).
At a glance
You'd think it would be obvious, wouldn't you? If ice (or snow) melts, you get water. Water flows downhill through gravity and collects wherever it can be retained. In areas that see regular winter snowfalls, the processes involved are familiar. Snow-capped mountains look photogenic but along comes the eventual thaw and the river levels rise sharply with all the meltwater.
Now apply the same basic principles to glaciers and ice-caps. It should not come as a surprise that exactly the same thing happens and where that meltwater collects is ultimately the oceans. Note here that we're talking about land-based ice, not sea-ice: sea-ice is already part of the ocean so does not affect sea levels as it forms and melts every year. But melt enough land-ice and you get very significant change indeed.
What do we mean by very significant? Well, let's look at the transition out of the last ice-age that dominated the last 20,000 years. It began with ice-caps over parts of Europe and North America and ended not so long ago with much of that ice gone but with sea levels having risen by more than 120 metres. If that's not significant, what is?
There's not enough ice left on Earth to raise sea levels by that whopping amount now, but there is enough to raise the oceans by more than 60 metres. Over what sort of time-frame? Well, we know that the current rate of sea level rise is some 3.7 mm a year, or nearly an inch and a half per decade. A lot of that is due to the expansion of the oceans - as things are warmed up they expand. But the rate is accelerating. How fast do we think it can get?
We do have the past to consider: during the glacial meltdown of the past 20,000 years, there was a period ominously named Meltwater Pulse 1A that began some 14,700 years ago. During this enhanced period of melting, sea levels rose by between 16 and 25 metres in about 400–500 years. That's roughly 40–60 mm per year or 16-23 inches a decade.
Could such drastic rates of sea level rise happen again? Probably not but nevertheless it shows what is possible as ice-sheets collapse in a warming world. But even if sea level rise stays at its current rate (it won't), that's getting on for a two-metre increase over the coming 300 years and a one-half to one-metre increase over the next 100 years. Now go anywhere affected by tides and think about all the communities of people that live and work along the shore. Pick the biggest spring tides, take a look at where they reach at high water, maybe watch the waves and surge when a storm occurs, then imagine an extra two metres of water on top of that.
And try to imagine being the decision-makers in the coming decades and centuries, who will have to work out what best to do. What would you think of the people all those years ago, who went around pretending this was not happening? Not favourably, for sure - because of such behaviour, that is how history will remember them.
Please use this form to provide feedback about this new "At a glance" section. Read a more technical version below or dig deeper via the tabs above!
Further details
The climate myth set out in the coloured box above gives an insight into the minds of climate change deniers. Why? Because it's entirely made-up. It annoyed the Realclimate blog's Gavin Schmidt sufficiently for him to write an eloquent debunking in 2012 that is well worth reading because it demonstrates so clearly what we, the scientific community, are up against.
The claim that tide gauges on islands in the Pacific Ocean show no sea level rise is nonsense: the data presented in the Realclimate link above show a variably rising sea level trend at each station. But what about global sea level rise?
Sea level rises as ice on land melts and as warming ocean waters expand. As well as being an existential threat to coastal habitation and environments (think about many of the world's capital cities here), sea level rise corroborates other evidence of global warming
The black line in the graph below (fig. 1) clearly shows sea level is rising; its upward curve shows how sea level is rising faster as time goes on. The upward curve agrees with global temperature trends and with the accelerating melting of ice in Greenland and other places.
Because sea level behaviour is such an important signal for tracking climate change, the misinformers seized on the sea level record in an effort to cast doubt on this evidence. As fig. 1 clearly demonstrates, sea level bounces up and down slightly from year to year so it's possible to cherry-pick data and falsely suggest the overall trend is flat, falling or linear. You can try this yourself. Starting with two closely spaced data points on the graph below, lay a straight-edge between them and notice how for a short period of time you can create almost any slope you prefer, simply by being selective about what data points you use. Now choose data points farther apart. Notice that as your selected data points cover more time, the more your mini-graph reflects the big picture. The lesson? Always look at all the data rather than being fooled by selective presentations.
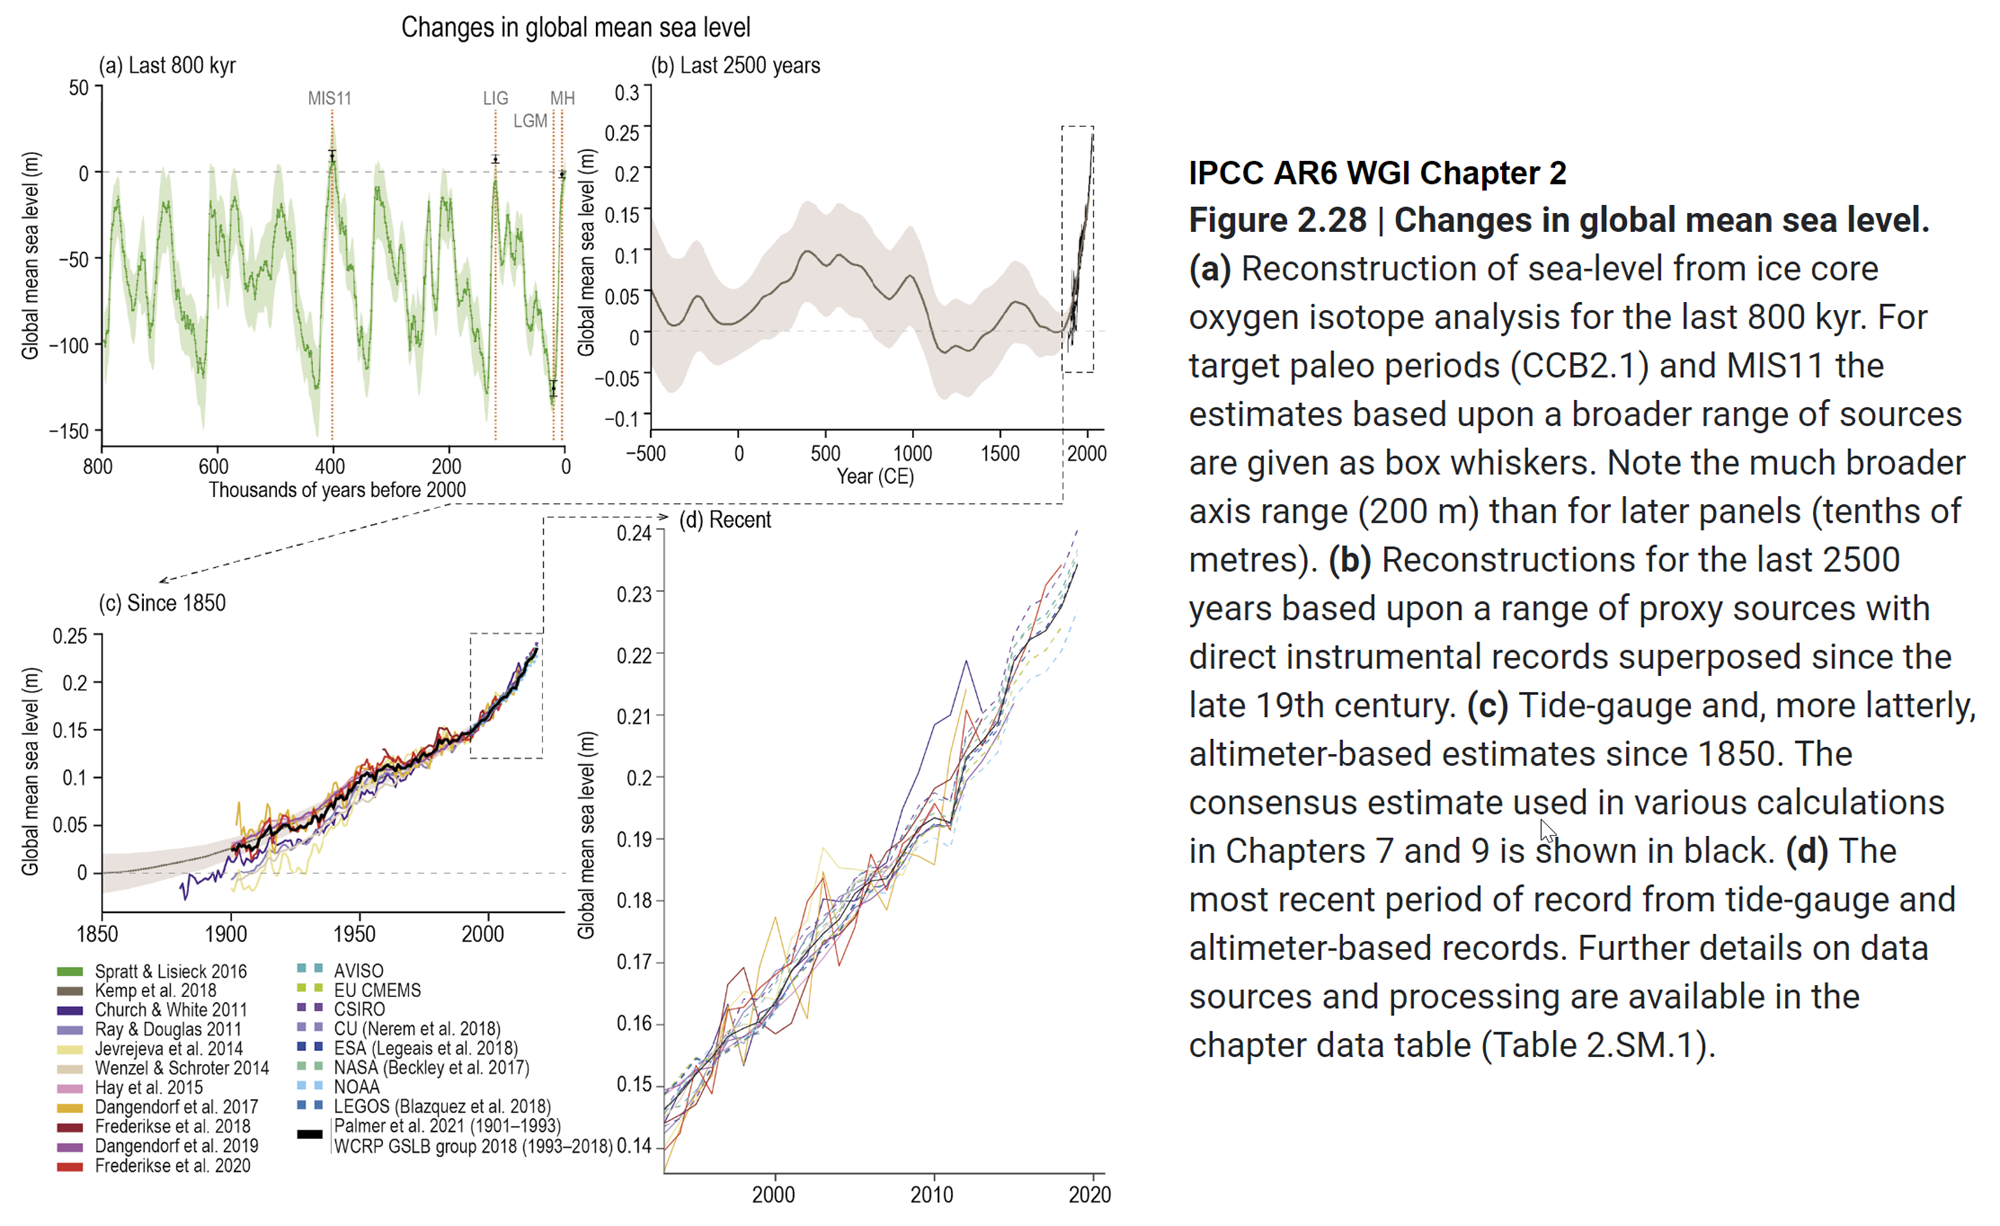
Fig. 1: sea level change, from IPCC AR6 WGI Chapter 2 section Climate Change 2021: The Physical Science Basis. Tide-gauge and, more latterly, altimeter-based estimates since 1850. The full image with all four panels and IPCC caption is available here.
Other denialist arguments about sea level concern the validity of observations, obtained via tide gauges and more recently satellite altimeter observations.
Tide gauges must take into account changes in the height of land itself caused by local geological processes, a favourite distraction for deniers to highlight. It will come as no surprise to learn that scientists measuring sea level with tide gauges are aware of - and compensate for - these factors. Confounding influences are accounted for in measurements and while they leave some noise in the record they cannot account for the observed long-term upward trend.
Various technical criticisms are mounted against satellite altimeter measurements by deniers. Indeed, deriving millimetre-level accuracy from orbit is a stunning technical feat so it's not hard to understand why some people find such an accomplishment unbelievable. It's astonishing that in another breath they are happy to jump aboard an airliner, parts of which are engineered to a similar tolerance!
In reality, researchers demonstrate this height measurement technique's accuracy to be within 1 mm/year. Most importantly there is no form of residual error that could falsely produce the upward trend in observations.
As can be seen in an inset of the graph in fig. 1, tide gauge and satellite altimeter measurements track each other with remarkable similarity. These two independent systems mutually support the observed trend in sea level. If an argument depends on skipping certain observations or emphasises uncertainty while ignoring an obvious trend, that's a clue you're being steered as opposed to informed. Don't be misled by only a carefully-selected portion of the available evidence being disclosed. Look at it all.
Current sea level rise is not exaggerated, in fact the opposite case is more plausible. For one, sea level rise is not the same everywhere. Many areas around the world already experience much faster rates of sea level rise than the average global rate shown in Fig 1. As well, observational data and changing conditions in such places as Greenland suggest if there's a real problem here it's underestimation of future sea level rise. Past IPCC synthesis reports offered rather conservative projections of sea level increase based on assumptions about future behaviour of ice sheets and glaciers, leading to estimates of sea level roughly following a linear upward trend mimicking that of recent decades. In point of fact, observed sea level rise is already above older IPCC projections - and accelerating - while at the same time it appears the mass balance of continental ice once envisioned by the IPCC was overly optimistic (Rahmstorf 2010; Otosaka et al. 2023).
Fast-forward to 2023 and the recent IPCC AR6 Synthesis Report is a bit less nuanced:
Limiting global surface temperature does not prevent continued changes in climate system components that have multi-decadal or longer timescales of response (high confidence). Sea level rise is unavoidable for centuries to millennia due to continuing deep ocean warming and ice sheet melt, and sea levels will remain elevated for thousands of years (high confidence). However, deep, rapid and sustained GHG emissions reductions would limit further sea level rise acceleration and projected long-term sea level rise commitment. Relative to 1995–2014, the likely global mean sea level rise under the SSP1-1.9 GHG emissions scenario is 0.15–0.23 m by 2050 and 0.28–0.55 m by 2100; while for the SSP5-8.5 GHG emissions scenario it is 0.20–0.29 m by 2050 and 0.63–1.01 m by 2100 (medium confidence).
The report goes on to state, however:
The probability of low-likelihood outcomes associated with potentially very large impacts increases with higher global warming levels (high confidence). Due to deep uncertainty linked to ice-sheet processes, global mean sea level rise above the likely range – approaching 2 m by 2100 and in excess of 15 m by 2300 under the very high GHG emissions scenario (SSP5-8.5) (low confidence) – cannot be excluded.
If they cannot exclude such risks - and they know what they are talking about - can you?
Last updated on 20 August 2023 by John Mason. View Archives


It is sad to see Koonin's ideas spiralling down into crankdom.
Koonin is only 65, and yet for some years now there has been increasing evidence of that widely-known but poorly-understood phenomenon: "Going Emeritus". Considering his previous prominent administrative/advisory governmental jobs, it is possible that there may also be a touch of LDS motivating him [ LDS = Limelight Deprivation Syndrome ].
While LDS is probably a minor part of the affliction suffered by the average professor who retires, it is neverthless clearly not at the heart of the "Emeritus" condition. But I fear it will be a very long time until the physiologists & neuro-psychologists come to a good understanding of the mechanisms producing the science-denier mind-set of such "Gone Emeritus" cases.
In the meantime, we (including NorrisM) will just have to ponder the mystery of how an intelligent science-literate guy like Koonin is able to get it so terribly wrong about such basic scientific thinking. And while he is lecturing climate scientists about them "not looking at the bigger context" . . . he himself is blithely turning a blind eye to the necessity of seeking causations for physical events (and he is losing himself in a mess of cherrypicking & statistical abstractions, rather than looking at the real world).
More than sad, it is tragic.
Norrism:
I recommended to you that you should read Tamino's posts on sea level rise. You wasted your time at Curry's blog.
If you had gone to Tamino you would have seen this graph of the speed of sea level rise calculated from Church and White:
This graph indicates that currently sea level is rising at approximately double the maximum rate during the 20th century. Please present data to support your wild claim that the current rate is similar to the rate in 1950. The acceleration was similar in 1930 but it did not last as long and started from a much lower base. Koonin does not discuss acceleration.
From a brief examination of this graph and the post of Koonin at Curry's blog it appears that most of the similarity in speed of sea level rise Koonin claims is due to Koonin cherry picking the time period that was analized.
Koonin's graph under "what the literature says" ends in 1995. I note that in 1995 Tamino's graph indicates the sea level rise was approximately the same as the peak in 1950. Unfortunately, my calendar says it is 2017. Koonin's graph is an 18 year running average. Becasue sea level rose so fast after 2000, the running average is much lower than the yearly (smoothed) average.
Keep in mind that the IPCC data is all at least 6 years old and Tamino's graph shows rapid acceleration over the last six years. I reviewed the sea level section of the CSSR and they do not have a comparable graph.
I do not know why you point out that Koonin posted his remark just before the report was released. The release date was set several years ago and it was the Fifth draft of the report. Koonin knew what was going to be in the report before it was released.
Denier's who rely on obviously cherry picked data to make their points are dishonest. It is this attitude of the "denier side" which drives scientists crazy. If the facts were honestly stated on both sides then you would not get this kind of dismissive reaction from scientists.
This information was not included in the Executive Summary because it is false.
You consistently pick minimums and claim deniers arguments that are cherry picked are equal to data anlysis by scientists. This is a false argument. You need to raise your game. By continously bringing up false claims you make people think you are just a troll and are not interested in learning about the causes and problems of AGW.
You asked: "Is there a scientific explanation for why sea level rises during the period 1920-1950 were close to the same as the present rates?"
The answer is: current rates are double the rates from 1920-1950. You fell for a cherry picked argument by deniers.
If you refer to Koonin as a reliable authority on AGW again I will refer to this post and point out that Koonin is a cherry picker whose primary purpose is to mislead. It makes you look bad to refer to him so much.
Norrism:
Your post is a perfect example of why scientists do not want to engage in a "Red-Blue" team discussion with Koonin as moderator, as you have suggested.
When one team deliberately falsifies the data the public thinks that scientists have not reached consensus. In this example of sea level rise, everyone who has looked at the data agrees that sea level rise is twice as much now as it was in 1950.
Koonan is not an acceptable person to moderate such a debate since he has demonstated that he in completely uninformed of the data and deliberatly misinforms his audience. There is no excuse for Noonan's use of data that is 12 years out of date to make claims of current sea level rise. If Noonan wants to make public criticism of scienitsts he is required to use the current data that was in the report he criticized.
The analysis from Dr. Nerem, linked at 216, gives enough data to realize Koonin's claim is false on its face. I linked the article containing Tamino's graph there also. You have been given the actual data. Every time you use Curries' blog as a reference everyone here knows that you are misleading them. Why have you not learned Curry is not a credible source from your previous postings of false information using her as the source? Do lawyers always continue to use references after they have been shown to be incorrect several times?
Koonin cites the IPCC to support his lie that sea level rise is approximately the same now as in 1950. The intent of the CSSR is to update data in the IPCC report. The scientists who wrote the CSSR are required to use the most up to date data. In addition, the data in the IPCC report was 7 years old when that report was written 6 years ago. Do we really need to reargue data that is 13 years old when current data is available?
Do you lawyers sit around and endlessly argue if it is fair to count blacks as only 3/5 of a vote and whether separate but equal facilities are acceptable??? Why do you ask scientists to reargue current sea level rise based on 13 year old data?
As I paraphrased from your post: " It is this attitude of the "denier side" which drives scientists crazy. If the facts were honestly stated on both sides then you would not get this kind of dismissive reaction from scientists."
Raise your game. You have been posting here at SkS for a long time and you still post these obviously false claims from sources you have been repeatedly shown are spouting lies. It is time consuming to find the actual data to respond to these lies.
This Koonin blather raised by NorrisM includes a WSJ opinion piece by Koonin (paywalled) entitled "A Deceptive New Report on Climate", this concerning the draft of a Climate Science Special Report (CSSR). Blog Mom Judy Curry has a post suppling some excerpts from the WSJ item and from the Koonin memo to the authors of the CSSR, the memo itself being also posted at Judy's site (where NorrisM linked to it @221).
The Koonin criticism sets out to fudge the inevitability of serious SLR by branding SLR rates since 1993 as "not statistically different from those during the first half of the 20th Century," this description being required so as to "not misleadingly alarm the non‐expert reader into believing that recent rates of rise are unprecedented." And he also wants mention of 2m SLR by 2100 setting out that this would require a rate of 24mm/yr so as to "help illustrate for the non‐expert reader just how dramatic the projected changes are." Or should that be 'how unbelievable'?
So here we have somebody in denial over AGW-induced SLR.
And he is not the only one. In the same post, Judy links to a slide show of her own titled "Sea Level Rise: Past, Present & Future" which also shows signs of denial. And Judy's prediction of global SLR 2017-50 is presented on Slide 35 as 3" to 8" which works out as an average SLR over the period of 4.2mm/yr(+/-2mm).
michael sweet @ 218, Bob Loblaw @ 219 and MA Rodger and John Hartz
I have read the references in the above citations and I am still confused as to the statement by the IPCC in the 2013 Assessment which, again, has the following summary:
"It is very likely that the global mean rate was 1.7 [1.5 to 1.9] mm yr–1 between 1901 and 2010 for a total sea level rise of 0.19 [0.17 to 0.21] m. Between 1993 and 2010, the rate was very likely higher at 3.2 [2.8 to 3.6] mm yr–1; similarly high rates likely occurred between 1920 and 1950. {3.7.2, 3.7.4, 5.6.3, 13.2.1, 13.2.2, Figure 13.3}"
The graph of Church & White presented in Tamino and reproduced in michael sweet's post at 227 seem to be inconsistent with a statement of fact in the 2013 IPPC statement. The rate shown in the Church & White graph (is this fully Church & White or an extension added to a Church & White graph that ended earlier?) does not show a similar rate in 1920 to 1950 at approximately 3.2 mm/yr. Surely this is what "similar high rates" has to mean.
Responding to Bob Loblaw, of course new information on sea level rises since 2013 are relevant but it does not explain this statement by the IPCC made in 2013. At that time it was either right or wrong. From what I can gather, the new CCSR report effectively repeats this analysis in the main report but does not reference this in the Executive Summary which is Koonin's complaint.
Moderator @ 224
I have not fully read the Mooney discussion nor have I got through this entire thread which I intend to do as part of my understanding on this issue.
But I thought I should respond to what seems to be an inconsistency between the Church & White graph and what the IPCC (and I believe the CCSR) have said about this period 1920- 1950.
I thought I was going to get an explanation of why the rate during 1920-1950 was close to the same but the answer comes back that the rate was no where near 3.2 mm/yr at all during this latter period. If all the IPCC was referencing was a short term acceleration during this period at the same rate for a much shorter time than the 30 years, then that could have been made a lot clearer because that is not what was stated. But that is not even supported by the Church & White graph.
I certainly agree that Koonin's most recent statements would suggest that he is not looking to becoming the Chair of any Red Team Blue Team panel unless Pruitt intends to have Co-Chairs, one from each side of this issue.
NorrisM:
In the Tamino link provided above, he states:
In the figure just after that statement, he shows the smooth fit he produced:
Note that Tamino's curve does not follow every "ubiquitous wiggle". Less smoothing will give greater variation in rate over shorter time intervals. The IPCC report does not state (that I can see from a quick glance) how short a time interval they used to get "similar" rates. Section 13.2.2.1 does, however, state:
and
If you make the time span short enough, you'll get twice-daily tides with very high rates of change. Not "sea level rise", though. The IPCC is probably looking at shorter time scales than Tamino.
With respect to acceleration, and whether it will continue, the figure I included in comment 222 shows that Greenland and Antarctica are having an increasingly large contribution. Ice sheets like these are slow to react, and they are just getting going in response to recent warming. The major question on what will happen by 2100 is "what will happen with Greenland and Antarctica?"
NorrisM @230.
Yous seem to be asking two things. Firstly, why do we not see "similarly high rates" to 3,2mm/yr(+/-0.4mm/yr) in the Tamino graph? Secondly, what caused the rate of SLR 1920-50 to be higher than periods before and after?
The methods used to create the Tamino graph have been explained @231/232 but this is probably not enough for you.
To address your first question concerning the IPCC quote, be aware that the quote originates in the Executive Summary of AR5 Chapter 13 so is not what I would call definitive, and indeed the quote you give cites references elsewhere within AR5. (You call this quote "fact" which is seriously wrong.)
If you refer to Section 3.7.4 you will see that it is not just Church & White that are being cited and that in Fig 3.14 Church & White data yields the lowest SLR through this 1920-50 period, hitting a momentary peak of just 2.3mm/yr from 18-year lnear trend calculations. (It is not clear from AR5 but this is certainly Church & White (2011) not C&W(2006) which would yield significantly higher levels of SLR through these years. Note C&W(2011) plot 16-year linear trends which also peak at 2.3mm/yr.) The Tamino graph uses differing methods and yields a peak of 2.1mm/yr through these year.
Your second question has no definite answer. Note that C&W(2011) speculate that the ice-melt contribution in 1920-50 could have been greater than is usually estimated. And if you look at zonal temperature records (ie GISTemp below), the place with the big temperature during the early 20th century was the high northern latutudes that do conveniently have ample ice to melt.
Norrism:
Bob Loblaw and M.A. Rodger have address some of the data analysis. If you read Tamino's post you will get a more detailed account. The IPCC does not state how their data was calculated. The method is undoubtedly somewhere in the references. It looks to me like they used a short analysis period, but it may be due to the data sources they used.
It appears that the IPCC graph that Koonan used was graphed with the 18 year data point at the start of the 18 year period (Noonan did not copy the caption so I could not tell from his graph). That means the data reached to 2011 and was up to date when it was written. My last post incorrectly dated the graph.
We know that sea level rise has increased rapidly for the last 6 years. That means the sea level now is about 20% greater than it was in 2011 when the IPCC data was written. Comparing to 1950 it is less likely that 1950 was as fast as today than in 2011 since sea lefel rise is greater.
In addition, papers have evaluated all the data sets graphed in the IPCC reports and some of those data sets have been updated. That would change the data (I am not sure what those changes are). In order to make a valid comparison today you need to use the updated data sets.
The writers of the CSSR reports used the updated data sets to reach their conclusions. They reached a valid scientific conclusion. Koonan cherry picked old data because he thought it supported his preconceived notions. His claims are not scientificly valid. The CSSR report supersedes the IPCC report because it is a more recent in depth review.
Ancillary to Bob Loblaw's fine comment at 232, previous research has shown that ice sheet mass contributions from land-based ice sheets have exceeded thermal expansion as the biggest contributor to global sea level rise. Recent research just submitted now has isolated the individual ice sheet contributions to global sea level rise.
Per Hsu and Velicogna 2017, between April 2002 and October 2014 global mean sea level grew by about 1.8 millimeters per year, with 43 percent of the increased water mass coming from Greenland, 16 percent from Antarctica, and 30 percent from mountain glaciers.
Hsu and Velicogna 2017 - Detection of Sea Level Fingerprints derived from GRACE gravity data
Embiggened
Just published in December 2017 issue of “Earth Systems and Environment” the most authoritative and objective analysis yet of sea-level rise globally.
Should finally put this issue to bed. The next time you hear about sea-levels rising several feet this century remember there’s no evidence of this rate to date despite the explosion of CO2 since early in the 20th century.
https://link.springer.com/article/10.1007/s41748-017-0019-5
As this is your first post, Skeptical Science respectfully reminds you to please follow our comments policy. Thank You!
yppo: "the most authoritative and objective analysis yet of sea-level rise globally."
Sorry, I'm skeptical. Your citation is to the second of two issues of a brand new journal. From the 'Preface' to the first issue, published three months ago:
With all due respect to King Abdulaziz and his namesake University, its new house organ has yet to establish how 'authoritative' it is. As for whether Short-Term Tide Gauge Records from One Location are Inadequate to Infer Global Sea-Level Acceleration will "finally put this issue to bed", that's up to post-publication peer review to decide.
As an armachair climate scientist, I'm hardly a 'peer' of any working SLR specialist, but I'll offer my two cents. I noted this in the article's Introduction:
Candidly, citing the likes of Mörner and Scafetta to support a claim of "loud divergence between sea-level reality and climate change theory" won't help to "establish very high standards for the journal."
yppo: "Albert Parker" or "Alberto Boretti", the nome de plume that he sometimes writes under, is well known to make up his data on sea level rise. Please suggest a reason we should listen to his prattle now? (for those new to science, writing under two names in considered dishonest in science. "Alberto Borelli" has written positive comments about "Albert Parker's" work.)
michael sweet @239,
I think it is more correct to state that "Albert Parker" was known as "Alberto Boretti" and that at some point prior to September 2012, as confirmed by the University of Ballarat on October 1st 2012, "Alberto Boretti ... changed his name to Albert Parker." Of course, this allows Parker to say nice things about Boretti. But is there actually evidence of Boretti returning to say nice things about Parker?
And let us not forget Parker's co-author in this allegedly "most authoritative and objective analysis yet of sea-level rise globally" who is an octogenarian with a bit of a problem accepting there is significant ice loss from the Greenland & Antarctic ice caps.
MA Rodger:
In addition to the link michael sweet gave to a Tamino article, there are several other blog posts that Tamino has done on Parker/Boretti's work. A search at Tamino's provides a list.
One of those posts (also linked to in the Tamino post michael points us to) has more details on the paper that Boretti/Parker sent in two comments on (both published). Although I haven't read the comments to see if Boretti said anything about Parker, it is clear that Parker did not stop using the Boretti name just because it wasn't his legal name any more.
Perhaps he just forgot some of the tnings he wanted to comment on when he sent in the first comment, and then forgot he'd already sent in a comment using his other name when he sent in the second comment.
As Mal Adapted points out, the journal this recent paper came out in is quite new.
I noticed that issue #2 has a correction in it, for a paper from issue #1. Although it is to the credit of the authors and journal to correct errors, I hope that this is not the start of a pattern of error-riddled papers.
Bob Loblaw @241,
Further to this Boretti/Parker issue, my understanding as per @240 was that there was one odd date (likely explainable), and all else pointed to a simple name-change. In the Tamino discussion you refer to dated 26Sept2012, there is mention of 3 published comments, one of these from Boretti and one from Parker. The Parker comment is published 6Sept2012 and cites the Boretti comment as being "In Press". The authorship of the Parker comment must then post-date the Boretti comment. And they both must have been published prior to the Tamino post of 26Sept2012.
So here is the one odd date, the Boretti comment publication is dated 11Oct2012. I can but assume this for some reason was written, and published in some form prior to both the Parker comment and the Tamino post but has for some reason acquired a later date of publication in the form linked above. Beyond this, I initially saw no Boretti literature on this subject that post-dates the arrival of Parker.
That did suggest a name change (as per the commenting here on a different paper) and that Parker was not acting as a sock-puppet for Boretti. However....
...Boretti has acted as a sock-puppet for Parker (hat-tip DeSmogBlog who got no sense from Parker when they asked him abot the two names). And Parker also continues to use the name Alberto Boretti when publishing in his day job so Parker continues to be a nom de plume, perhaps used to build a firewall between the responses he gets to his purile writings on climatology (which "would be unacceptable in an undergraduate lab report") from his more serious Mechanical Engineering work (eg here).
Which ever way you see it, Parker/Boretti's use of different names within scientific publications is unacceptable.
The following comment was deleted by mistake. My bad.
JohnSeers
@236 @yypo
"Short-Term Tide Gauge Records from One Location ..."
I am no expert on sea level rise but the title says it all and says nothing. I hardly need a scientific paper to tell me that short time scales and one location are not enough. Indeed, the first point made in this Skeptical Science article is "A variety of different measurements find steadily rising sea levels over the past century.".
What is the reputation of “Earth Systems and Environment"? And what is your justification for saying "the most authoritative and objective analysis yet of sea-level rise globally"? Just asserting it does not make it so.
MA Rodger, Bob Loblaw and Michael Sweet,
After more carefully looking at Figure 3.14 in the IPCC Fifth Assessment, I think the real answer to my question is that the IPCC is not relying on Church & White but rather on Jevrejeva el al and Ray and Douglas estimates to come to the conclusion that "similar rates" (ie 3.2 mm/yr) were found in the period of 1920-1950.
So then, just when some papers are coming out with projected 4 mm/yr rates, here we have Daniel Bailey at 235, in the course of discussing that there is a larger contribution to SLR from ice sheets rather than thermal expansion he states as follows:
"Per Hsu and Velicogna 2017, between April 2002 and October 2014 global mean sea level grew by about 1.8 millimeters per year"
What gives?
It would seem that there is a lot of disagreement on one of these basic issues, namely, how much SLR are we experiencing?
[DB] No disagreement. As this, per NASA, makes clear:
Just not this:
Daniel Bailey @ 235 is clearly talking about ice sheet contribution to SLR, NOT total SLR.
"Ancillary to Bob Loblaw's fine comment at 232, previous research has shown that ice sheet mass contributions from land-based ice sheets have exceeded thermal expansion as the biggest contributor to global sea level rise. Recent research just submitted now has isolated the individual ice sheet contributions to global sea level rise.
Per Hsu and Velicogna 2017, between April 2002 and October 2014 global mean sea level grew by about 1.8 millimeters per year, with 43 percent of the increased water mass coming from Greenland, 16 percent from Antarctica, and 30 percent from mountain glaciers.
Hsu and Velicogna 2017 - Detection of Sea Level Fingerprints derived from GRACE gravity data"
Yes, indeed. And that the ongoing mass losses from our dwindling, land-based ice sheets are now the dominant contributor to SLR...and will continue to be so, for longer than any now alive shall live.
Norris M: As I stated updthread, sea level rise is a very complex subject matter.
One of the major complexities of sea level rise is that it is not uniform throughout the global ocean system. The following article dramtically illustrates this key fact:
Scientists may have solved mystery of rapidly rising Indian Ocean sea level by Olivia Trani, GeoSpace, AGU Blogosphere, Nov 7, 2017
John Hartz @ 248 and squishy
I think I will get back to reading the balance of this thread. Indian Ocean discussion interesting but seems to suggest that talking about an average SLR over all oceans is challenging.
DB could have been clearer but I see that he was clearly referring only to the contribution from ice sheets.
Do you agree that the IPCC reference to the 1920-1950 period had to be referencing the two studies other than Church & White shown in the 3.14 graph?
NorrisM @249.
As you become interested in IPCC AR5 Fig 3.14, do note that the three data sets presented are derived from tidal gauges using two significantly different approaches. The first used by Jevrejeva et al (2008) attempts to reconstruct a global coastal SLR and the second used by Church & White (2011) and Ray & Douglas (2011) attempts to reconstruct a global ocean SLR. The full set of approaches employed across all the various studies is listed out in AR5 Section 3.7.2.