


 Arguments


How much is sea level rising?
What the science says...
| Select a level... |
 Basic
Basic
|
 Intermediate
| |||
|
A variety of different measurements find steadily rising sea levels over the past century. |
|||||
Climate Myth...
Sea level rise is exaggerated
"We are told sea level is rising and will soon swamp all of our cities. Everybody knows that the Pacific island of Tuvalu is sinking. ...
Around 1990 it became obvious the local tide-gauge did not agree - there was no evidence of 'sinking.' So scientists at Flinders University, Adelaide, set up new, modern, tide-gauges in 12 Pacific islands.
Recently, the whole project was abandoned as there was no sign of a change in sea level at any of the 12 islands for the past 16 years." Vincent Gray).
At a glance
You'd think it would be obvious, wouldn't you? If ice (or snow) melts, you get water. Water flows downhill through gravity and collects wherever it can be retained. In areas that see regular winter snowfalls, the processes involved are familiar. Snow-capped mountains look photogenic but along comes the eventual thaw and the river levels rise sharply with all the meltwater.
Now apply the same basic principles to glaciers and ice-caps. It should not come as a surprise that exactly the same thing happens and where that meltwater collects is ultimately the oceans. Note here that we're talking about land-based ice, not sea-ice: sea-ice is already part of the ocean so does not affect sea levels as it forms and melts every year. But melt enough land-ice and you get very significant change indeed.
What do we mean by very significant? Well, let's look at the transition out of the last ice-age that dominated the last 20,000 years. It began with ice-caps over parts of Europe and North America and ended not so long ago with much of that ice gone but with sea levels having risen by more than 120 metres. If that's not significant, what is?
There's not enough ice left on Earth to raise sea levels by that whopping amount now, but there is enough to raise the oceans by more than 60 metres. Over what sort of time-frame? Well, we know that the current rate of sea level rise is some 3.7 mm a year, or nearly an inch and a half per decade. A lot of that is due to the expansion of the oceans - as things are warmed up they expand. But the rate is accelerating. How fast do we think it can get?
We do have the past to consider: during the glacial meltdown of the past 20,000 years, there was a period ominously named Meltwater Pulse 1A that began some 14,700 years ago. During this enhanced period of melting, sea levels rose by between 16 and 25 metres in about 400–500 years. That's roughly 40–60 mm per year or 16-23 inches a decade.
Could such drastic rates of sea level rise happen again? Probably not but nevertheless it shows what is possible as ice-sheets collapse in a warming world. But even if sea level rise stays at its current rate (it won't), that's getting on for a two-metre increase over the coming 300 years and a one-half to one-metre increase over the next 100 years. Now go anywhere affected by tides and think about all the communities of people that live and work along the shore. Pick the biggest spring tides, take a look at where they reach at high water, maybe watch the waves and surge when a storm occurs, then imagine an extra two metres of water on top of that.
And try to imagine being the decision-makers in the coming decades and centuries, who will have to work out what best to do. What would you think of the people all those years ago, who went around pretending this was not happening? Not favourably, for sure - because of such behaviour, that is how history will remember them.
Please use this form to provide feedback about this new "At a glance" section. Read a more technical version below or dig deeper via the tabs above!
Further details
The climate myth set out in the coloured box above gives an insight into the minds of climate change deniers. Why? Because it's entirely made-up. It annoyed the Realclimate blog's Gavin Schmidt sufficiently for him to write an eloquent debunking in 2012 that is well worth reading because it demonstrates so clearly what we, the scientific community, are up against.
The claim that tide gauges on islands in the Pacific Ocean show no sea level rise is nonsense: the data presented in the Realclimate link above show a variably rising sea level trend at each station. But what about global sea level rise?
Sea level rises as ice on land melts and as warming ocean waters expand. As well as being an existential threat to coastal habitation and environments (think about many of the world's capital cities here), sea level rise corroborates other evidence of global warming
The black line in the graph below (fig. 1) clearly shows sea level is rising; its upward curve shows how sea level is rising faster as time goes on. The upward curve agrees with global temperature trends and with the accelerating melting of ice in Greenland and other places.
Because sea level behaviour is such an important signal for tracking climate change, the misinformers seized on the sea level record in an effort to cast doubt on this evidence. As fig. 1 clearly demonstrates, sea level bounces up and down slightly from year to year so it's possible to cherry-pick data and falsely suggest the overall trend is flat, falling or linear. You can try this yourself. Starting with two closely spaced data points on the graph below, lay a straight-edge between them and notice how for a short period of time you can create almost any slope you prefer, simply by being selective about what data points you use. Now choose data points farther apart. Notice that as your selected data points cover more time, the more your mini-graph reflects the big picture. The lesson? Always look at all the data rather than being fooled by selective presentations.
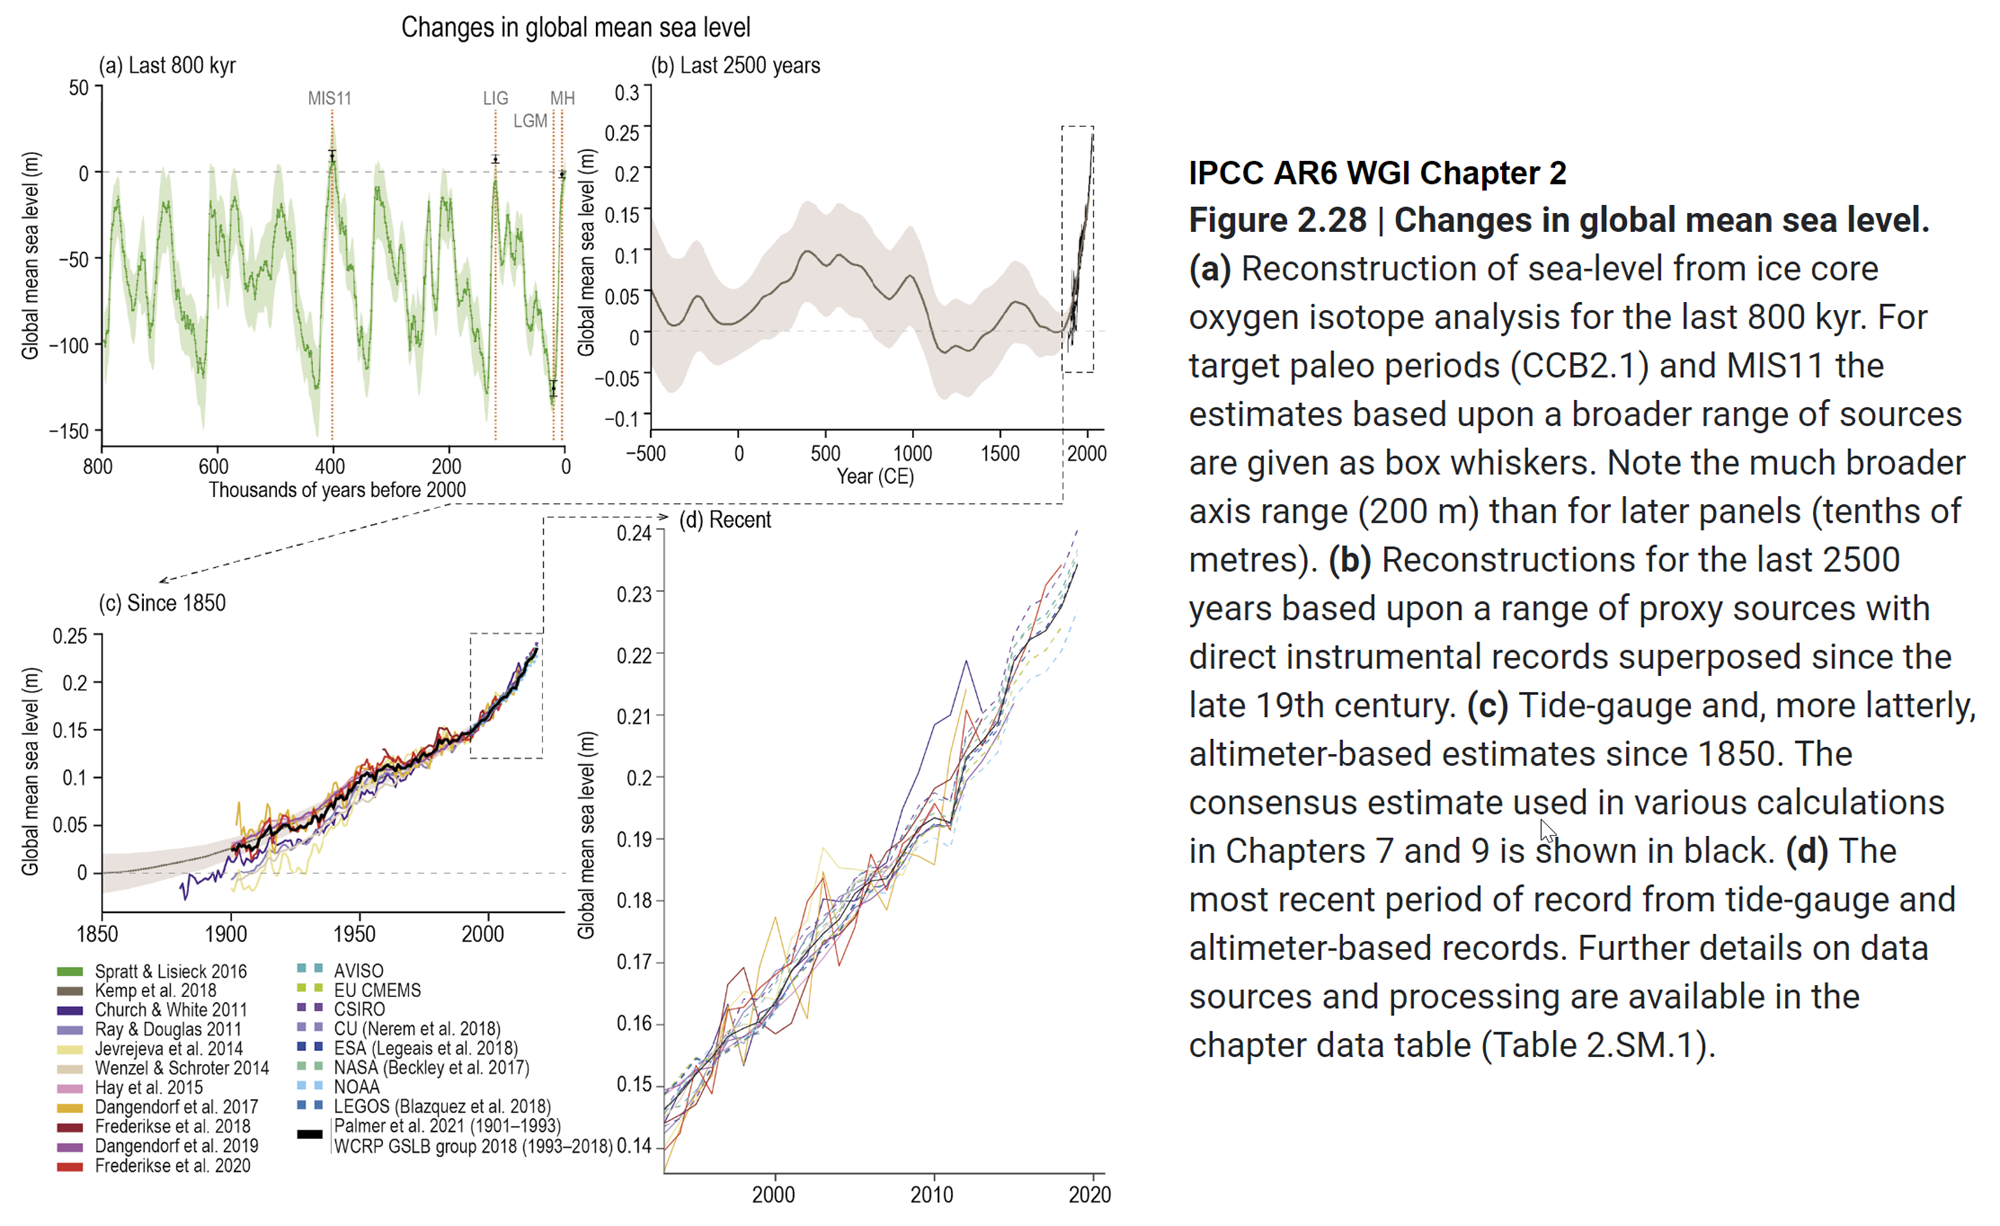
Fig. 1: sea level change, from IPCC AR6 WGI Chapter 2 section Climate Change 2021: The Physical Science Basis. Tide-gauge and, more latterly, altimeter-based estimates since 1850. The full image with all four panels and IPCC caption is available here.
Other denialist arguments about sea level concern the validity of observations, obtained via tide gauges and more recently satellite altimeter observations.
Tide gauges must take into account changes in the height of land itself caused by local geological processes, a favourite distraction for deniers to highlight. It will come as no surprise to learn that scientists measuring sea level with tide gauges are aware of - and compensate for - these factors. Confounding influences are accounted for in measurements and while they leave some noise in the record they cannot account for the observed long-term upward trend.
Various technical criticisms are mounted against satellite altimeter measurements by deniers. Indeed, deriving millimetre-level accuracy from orbit is a stunning technical feat so it's not hard to understand why some people find such an accomplishment unbelievable. It's astonishing that in another breath they are happy to jump aboard an airliner, parts of which are engineered to a similar tolerance!
In reality, researchers demonstrate this height measurement technique's accuracy to be within 1 mm/year. Most importantly there is no form of residual error that could falsely produce the upward trend in observations.
As can be seen in an inset of the graph in fig. 1, tide gauge and satellite altimeter measurements track each other with remarkable similarity. These two independent systems mutually support the observed trend in sea level. If an argument depends on skipping certain observations or emphasises uncertainty while ignoring an obvious trend, that's a clue you're being steered as opposed to informed. Don't be misled by only a carefully-selected portion of the available evidence being disclosed. Look at it all.
Current sea level rise is not exaggerated, in fact the opposite case is more plausible. For one, sea level rise is not the same everywhere. Many areas around the world already experience much faster rates of sea level rise than the average global rate shown in Fig 1. As well, observational data and changing conditions in such places as Greenland suggest if there's a real problem here it's underestimation of future sea level rise. Past IPCC synthesis reports offered rather conservative projections of sea level increase based on assumptions about future behaviour of ice sheets and glaciers, leading to estimates of sea level roughly following a linear upward trend mimicking that of recent decades. In point of fact, observed sea level rise is already above older IPCC projections - and accelerating - while at the same time it appears the mass balance of continental ice once envisioned by the IPCC was overly optimistic (Rahmstorf 2010; Otosaka et al. 2023).
Fast-forward to 2023 and the recent IPCC AR6 Synthesis Report is a bit less nuanced:
Limiting global surface temperature does not prevent continued changes in climate system components that have multi-decadal or longer timescales of response (high confidence). Sea level rise is unavoidable for centuries to millennia due to continuing deep ocean warming and ice sheet melt, and sea levels will remain elevated for thousands of years (high confidence). However, deep, rapid and sustained GHG emissions reductions would limit further sea level rise acceleration and projected long-term sea level rise commitment. Relative to 1995–2014, the likely global mean sea level rise under the SSP1-1.9 GHG emissions scenario is 0.15–0.23 m by 2050 and 0.28–0.55 m by 2100; while for the SSP5-8.5 GHG emissions scenario it is 0.20–0.29 m by 2050 and 0.63–1.01 m by 2100 (medium confidence).
The report goes on to state, however:
The probability of low-likelihood outcomes associated with potentially very large impacts increases with higher global warming levels (high confidence). Due to deep uncertainty linked to ice-sheet processes, global mean sea level rise above the likely range – approaching 2 m by 2100 and in excess of 15 m by 2300 under the very high GHG emissions scenario (SSP5-8.5) (low confidence) – cannot be excluded.
If they cannot exclude such risks - and they know what they are talking about - can you?
Last updated on 20 August 2023 by John Mason. View Archives


Here is better comparison of satellite and tide guage data from CSIRO.
Despite glacial retreat, shrinking polar ice caps and warming oceans, measured sea level rise is merely incremental. The eplanations of rising land masses now unburdened by the weight of melted ice, and other theories leave me skeptical. I would have imagined that Atmospheric Moisture Increase in a warmer atmosphere may possibly account for some of the extra water, but cannot find any documentation of a correlation. Is AMI a possible explanation for the merely small levels of sea rise?
Mat @302,
As Wikipedia shows, the atmosphere contains a tiny portion of our planet's H2O (12,900 cu km) while the oceans contain the vast majority of it (1.338 billion cu km). An increase in global temperature would raise atmospheric H2O by 7% or 9,000 cu km, and with oceans 351 million sq km in size, that would be enough to cause (or prevent) a sea level rise totalling 0.025mm.
I am not aware of there being a discrepancy between the evaluation of SLR drivers & observed SLR. For instance, IPCC AR5 Chapter 13 Table 13.1 shows the 'residual' to be well inside the confidence intervals.
Matt, see here for discussion of relative contributors to sealevel rise. Melting ice is only one source and contribution easily quantified - convert mass melted from GRACE to volume and spread over area of ocean. It is less important at the moment that steric rise from warming ocean. Isostatic adjustment is neglible and unaware of arguments claiming it to be important.
Hey, I recently came across a paper from 2014, "Global sea level trend during 1993–2012", by Chen (2014). (https://www.sciencedirect.com/science/article/pii/S0921818113002397)
It finds that since 2004, the sea level rise has been decelerating. I have a couple of questions about it since I am not very knowledgeable in this field.
I think this is the main conclusion of the paper: "GMSL started decelerated rising since 2004 with rising rate 1.8 ± 0.9 mm/yr in 2012."
However, it does make say the following things in the discussion:
"Comparison between the GMSL, the global mean steric sea level, and the global mean ocean mass indicates that the decreasing of the rising trend is mainly due to the stalled ocean heat content which started in the early 2000s, when the PDO switched from the warm polarity to cold polarity."
"Although the stalled upper ocean heat content during the last decade has reduced the rising trend of the GMSL, the global sea level kept rising because of the contribution of the accelerated melting of land ice in the warming climate. This means that if the land ice keeps melting at the same or faster pace due to anthropogenic warming, the world ocean will experience a significant accelerated total sea level rise when the steric sea level transitions to a stage similar to the period during 1993–2003."
In short, I am not sure what to think of this study. Is the increase in global sea level decelerating? Or is this part of a trend (perhaps the PDO? I don't understand that fully either), and irrelevant if one would look at long-term?
Thanks
Ossyrial @305,
You appear to have spotted some of the reasons Chen et al (20140 'Global sea level trend during 1993–2012' have given for their 'deceleration 2004-12' result. They do also see a significant level of uncertainty in their result although this is not so well handled when presenting their result.
In a broader context, Visser et al (2015) reviews various methods being used to derive acceleration/deceleration in SLR, methods which do yield contradictory results.
And the lead author X Chen has published since with Chen et al (2017) 'The increasing rate of global mean sea-level riseduring 1993–2014' which provides a result that supersedes the contradictory result of Chen et al (2014) in that it corrects satellite data and better accounts for other variable factors.
As MA sagely notes, Chen 2014 is dated and newer studies with later data show an acceleration in SLR and with the mass component also increasing.
Per Yi et al 2017 - Acceleration in the Global Mean Sea Level Rise: 2005–2015:
And
And
Other studies:
Cazenave et al 2018 - Global Sea Level Budget 1993–Present
Cazenave et al 2018 - Contemporary sea level changes from satellite altimetry: What have we learned? What are the new challenges?
SLR Components, p. 1645, Figure 3:
Other salient studies:
On 2018 sea level rise acceleration:
Also per Nerem et al 2018:
Very nice Daniel, thanks for doing that research legwork.
daniel! I have read all the comments and find on the internet something that I can't reconcile. The Australian Bureau of Meteorology page on
Pacific Sea Level and Geodetic Monitoring Project
http://www.bom.gov.au/oceanography/projects/spslcmp/data/monthly.shtml
studies a number of pacific islands from 1993 to 2019. Islands are:Cook Islands; Fiji; Kiribate; Marshall Islands; Nauru; Papua New Guinea; Solomon Islands; Samoa; Tonga; Tuvalu; Vanuatu; Federated States of Micronesia; Niue.
When I look at the graphs and tables for each island/islands, I find that the ghttp://www.bom.gov.au/oceanography/projects/spslcmp/data/monthly.shtmlraphs are uniformly even and NOT showing increases in sea level.
Could you please enlighten me
Not sure what your definition of "uniformly even" is. Did you expect them to be so?
Firstly, global sea level rise is a global average and the surface of the oceans are anything but level (the surface of the oceans follow the gravitic shape of the Earth and are also subject to solar, lunar, sloshing and siphoning effects and oceanic oscillations, etc, all of which need to be controlled for).
From the NCA4, global average sea level has risen by about 7–8 inches since 1900, with almost half (about 3 inches) of that rise occurring since 1993:
From NOAA STAR NESDIS:
Regional SLR graphics are also available from NOAA STAR NESDIS, here.
This is a screenshot of NOAA's tide gauge map for the Western Pacific (NOAA color-codes the relative changes in sea levels to make it easier to internalize):
Clicking on the Funafuti, Tuvalu tide gauge station we see that sea levels are rising by 3.74 mm/yr (above the global average) there, with a time series starting around 1978 and ending about 2011:
However, the time series used by your BOM link for Funafuti (1993-2019) is shorter and the BOM also does not apply a linear trend line to it like NOAA does:
Feel free to make further comparisons, but comparing a set of graphics with no trend lines vs those with trend lines is no comparison at all.
From the recent IPCC Special Report 2019 - Ocean and Cryosphere in a Changing Climate - Summary for Policy Makers, September 25, 2019 release (SROCC 2019), the portions on sea level rise:
To sum:
1. Global sea levels continue to rise, with the rise itself accelerating (due to an acceleration in land-based ice sheet mass losses). This will continue, for beyond the lifespans of any now alive.
2. Beware of the eyecrometer. It will deceive you, if you allow it to.
SLR Components, from Cazenave et al 2018
Jennifer Marohasy has posted a recent blog which claims large sea level falls around Australia over several thousand years. She appears to be also claiming that sea levels could be falling at the moment. I would be grateful for any insights the Skeptical Science team can provide about the validity of these arguments.
See the post at: https://jennifermarohasy.com/2019/12/what-can-you-see-indicating-sea-levels-are-rising/
Marohasy conflates local/regional sea levels with global, a fatal error.
"She appears to be also claiming that sea levels could be falling at the moment"
Not without the copious usage of mind-altering substances. SLR is accelerating as land-based ice sheet mass losses accelerate.
Read the previous dozen comments.
Dr Marohasy is also conflating modern times (the last 200 years) with the sea level changes of the mid & later Holocene (the last 10,000 years). She is confusing the picture, by using deceptive rhetoric to suggest (to the casual reader) that the observed global sea level fall of around 1 - 2 meters is part of the overall pattern of sea level fall and is a continuing fall today (despite all those incompetent mainstream scientists providing all that fake evidence of a 20+ cm rise during the past century).
Despite common sense indicating that current global warming & ice-melt must be causing a rise in mean sea level [as modern tide gauge & satellite measurements do indeed demonstrate] . . . Marohasy is trying to gloss over the reality of modern climate change.
Her comments are quite bizarre actually ~ this confusion of short- & long-term sea level changes. Yes, the MSL fell by 1 - 2 meters [ see Clark et al., 2016 ] in the roughly 10,000 years since the peak of the Holocene warm period (as the world continued to cool very slightly) . . . but nowadays the circumstances have produced rapid global warming, with resultant MSL rise. A rise which Marohasy seems to be trying to conceal with vague & confusing wording.
The more interesting question is :- Why is she undertaking such propaganda-style mendacity?
See also Tamino's demonstration of acceleration in global sea level rise.
Recommended supplemental reading:
Global data contradict claim of no acceleration in sea level rise, Edited by Scott Johnson, Climate Feedback, Apr 1, 2020
Recommended supplemental reading:
Rates of global sea level rise have accelerated since 1900, contrary to bloggers’ claims, Edited by Nikki Forrester, Claims Analysis, Climate Feedback, Jan 15, 2021
Peter Hadfield has a new video out on his potholer54 YouTube channel which is now also mentioned in the further viewing section above.
https://www.youtube.com/watch?v=WTRlSGKddJE
Thank you BaerbelW ~ and the same Peter Hadfield has brought out a new video on sea level rise, as of a day ago. This, number 58 in his YouTube climate series. Title is :- "Are prominent environmentalists buying beachside property?"
The one you mentioned (number 57) was excellent in debunking the usual strawman myths & faked/false "scientific predictions".
The new video also humorously looks at sea level and the ongoing Denialist cries about the hypocrisy of very prominent rich Lefties who are continually buying expensive beach properties which would surely be doomed to inundation in the immediate future.
Potholer54 provides a handy bunch of rebuttals. Amusing, too.
Over 20,000 views already.
Sea level rise is one of the most common topics among the environmental science community and it should be since this topic is a topic that everyone should acknowledge. Sea level rise is caused by global warming which leads to ice and glaciers melting in the polar regions. This caused water to run off to the ocean which causes the sea to be above land.
This is extremely dangerous, especially to people who live near the shore or anywhere in particular since we cannot predict when there will be flooding. According to the graph above, it is safe to say that the sea level has been rising a lot during the past decades which also shows that global warming is getting worse and worse every single day. For me, sea-level rise is an important topic because it affects human lives in a bad way.
For example, flooding can cause damage to our areas of living, and it can also harm our drinking water and the crops that we grow for food or the country to send out for trading or any other opportunities. We can help solve this problem by again raising awareness of people living near the shores to watch out for signs of flooding. We can also help each other lower global warming by burning fewer fossil fuels and using more organic stuff. Please help each other resolve this problem for your own safety.
Responding to Fixitsan @84 elsewhere.
The NTSLF provides tidal gauge data around UK. The UK shows on average 150mm of SLR You say "the tide guages around the UK show some decline in sea level rise. One guage measuring the Thames estuary shows a decline, several Scottish ones too."
The Sheerness gauge (the gauge in the Thames estury) shows positive SLR. As for Scotland, Kinlochbervie, Portpatrick & Aberdeen show none of this "decline" you talk of.
[BL] Note that the post by Fixitsan linked to here has had its contents deleted due to repeated off-topic posts by Fixitsan.
Thank you, MA Rodger. I had better follow your example, and transfer my reply to Fixitsan into this thread, from his (incorrect) thread "elsewhere".
To repeat :-
Curiouser and curiouser, Fixitsan. While I appreciate your desire to emulate the White Queen in believing six impossible climate things before breakfast ~ I do confess to being intrigued by your statement that "sea level rise is undeniably normal". Mr Milankovitch and his cycle would suggest (strongly) that the planet is in its natural cooling stage for about the last 4,000 years (minus the last couple of centuries of AGW, of course).
So why would the sea level be rising recently, without cause? Or do you define AGW as "normal" ? (With another five impossible things yet to be enumerated by you.)
Fixitsan,
Unfortunately, you are completely misinformed on the subject of long term sea level rise.
Fortunately, Skeptical Science has a post that describes the science and facts of long term sea level rise. Your claim that sea level has been rising for the psat 20,000 years is simply incorrect.
The fact is that sea level increased from about 24,000 years ago until about 4-5,000 years ago. Then the Earth started cooling (!!!). The sea level dropped slowly until about 200 years ago. Then global warming caused the decline to reverrse and sea level rise has been increasing since then.
I note that you have provided no linkis to support your wild claims. Wild, unsupported claims by anonymous internet persons do not haol much weight in scientific discussion. I look forward to your references that show sea level rise for the past 4,000 years ws increasing.
I have visited many of the islands described in the linked article at Skeptical Science. They are low islands formed when coral grew to the surface during the high stand 4,000 years ago. The decrease in sea level for the past 4,000 years made them islands. If you insist that sea level has consistently risen for the past 20,000 years, how did coral atolls form?
Please note: the basic version of this rebuttal has been updated on Aug 20, 2023 and now includes an "at a glance“ section at the top. To learn more about these updates and how you can help with evaluating their effectiveness, please check out the accompanying blog post @ https://sks.to/at-a-glance