


 Arguments


How much is sea level rising?
What the science says...
| Select a level... |
 Basic
Basic
|
 Intermediate
| |||
|
A variety of different measurements find steadily rising sea levels over the past century. |
|||||
Climate Myth...
Sea level rise is exaggerated
"We are told sea level is rising and will soon swamp all of our cities. Everybody knows that the Pacific island of Tuvalu is sinking. ...
Around 1990 it became obvious the local tide-gauge did not agree - there was no evidence of 'sinking.' So scientists at Flinders University, Adelaide, set up new, modern, tide-gauges in 12 Pacific islands.
Recently, the whole project was abandoned as there was no sign of a change in sea level at any of the 12 islands for the past 16 years." Vincent Gray).
At a glance
You'd think it would be obvious, wouldn't you? If ice (or snow) melts, you get water. Water flows downhill through gravity and collects wherever it can be retained. In areas that see regular winter snowfalls, the processes involved are familiar. Snow-capped mountains look photogenic but along comes the eventual thaw and the river levels rise sharply with all the meltwater.
Now apply the same basic principles to glaciers and ice-caps. It should not come as a surprise that exactly the same thing happens and where that meltwater collects is ultimately the oceans. Note here that we're talking about land-based ice, not sea-ice: sea-ice is already part of the ocean so does not affect sea levels as it forms and melts every year. But melt enough land-ice and you get very significant change indeed.
What do we mean by very significant? Well, let's look at the transition out of the last ice-age that dominated the last 20,000 years. It began with ice-caps over parts of Europe and North America and ended not so long ago with much of that ice gone but with sea levels having risen by more than 120 metres. If that's not significant, what is?
There's not enough ice left on Earth to raise sea levels by that whopping amount now, but there is enough to raise the oceans by more than 60 metres. Over what sort of time-frame? Well, we know that the current rate of sea level rise is some 3.7 mm a year, or nearly an inch and a half per decade. A lot of that is due to the expansion of the oceans - as things are warmed up they expand. But the rate is accelerating. How fast do we think it can get?
We do have the past to consider: during the glacial meltdown of the past 20,000 years, there was a period ominously named Meltwater Pulse 1A that began some 14,700 years ago. During this enhanced period of melting, sea levels rose by between 16 and 25 metres in about 400–500 years. That's roughly 40–60 mm per year or 16-23 inches a decade.
Could such drastic rates of sea level rise happen again? Probably not but nevertheless it shows what is possible as ice-sheets collapse in a warming world. But even if sea level rise stays at its current rate (it won't), that's getting on for a two-metre increase over the coming 300 years and a one-half to one-metre increase over the next 100 years. Now go anywhere affected by tides and think about all the communities of people that live and work along the shore. Pick the biggest spring tides, take a look at where they reach at high water, maybe watch the waves and surge when a storm occurs, then imagine an extra two metres of water on top of that.
And try to imagine being the decision-makers in the coming decades and centuries, who will have to work out what best to do. What would you think of the people all those years ago, who went around pretending this was not happening? Not favourably, for sure - because of such behaviour, that is how history will remember them.
Please use this form to provide feedback about this new "At a glance" section. Read a more technical version below or dig deeper via the tabs above!
Further details
The climate myth set out in the coloured box above gives an insight into the minds of climate change deniers. Why? Because it's entirely made-up. It annoyed the Realclimate blog's Gavin Schmidt sufficiently for him to write an eloquent debunking in 2012 that is well worth reading because it demonstrates so clearly what we, the scientific community, are up against.
The claim that tide gauges on islands in the Pacific Ocean show no sea level rise is nonsense: the data presented in the Realclimate link above show a variably rising sea level trend at each station. But what about global sea level rise?
Sea level rises as ice on land melts and as warming ocean waters expand. As well as being an existential threat to coastal habitation and environments (think about many of the world's capital cities here), sea level rise corroborates other evidence of global warming
The black line in the graph below (fig. 1) clearly shows sea level is rising; its upward curve shows how sea level is rising faster as time goes on. The upward curve agrees with global temperature trends and with the accelerating melting of ice in Greenland and other places.
Because sea level behaviour is such an important signal for tracking climate change, the misinformers seized on the sea level record in an effort to cast doubt on this evidence. As fig. 1 clearly demonstrates, sea level bounces up and down slightly from year to year so it's possible to cherry-pick data and falsely suggest the overall trend is flat, falling or linear. You can try this yourself. Starting with two closely spaced data points on the graph below, lay a straight-edge between them and notice how for a short period of time you can create almost any slope you prefer, simply by being selective about what data points you use. Now choose data points farther apart. Notice that as your selected data points cover more time, the more your mini-graph reflects the big picture. The lesson? Always look at all the data rather than being fooled by selective presentations.
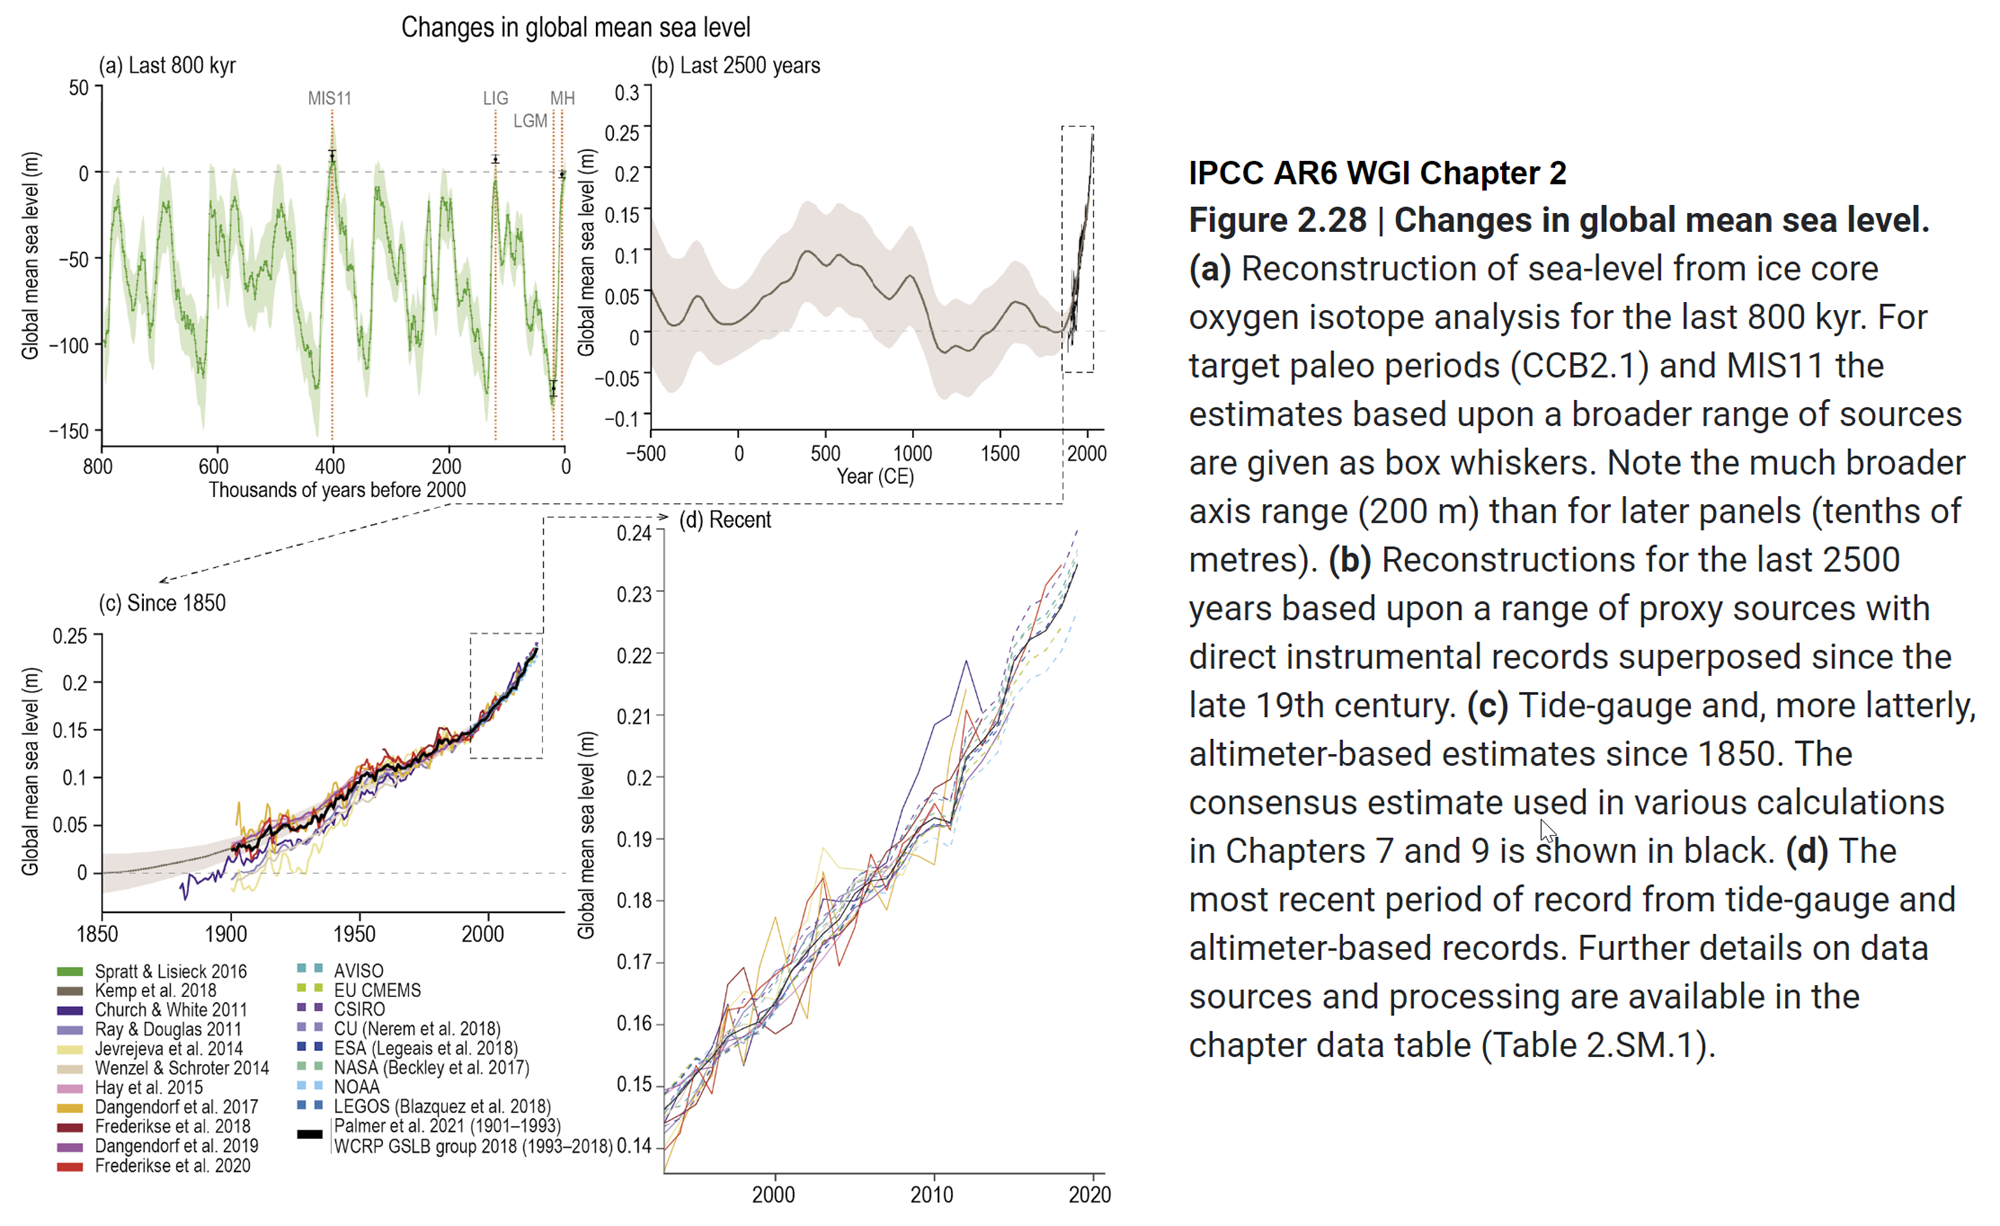
Fig. 1: sea level change, from IPCC AR6 WGI Chapter 2 section Climate Change 2021: The Physical Science Basis. Tide-gauge and, more latterly, altimeter-based estimates since 1850. The full image with all four panels and IPCC caption is available here.
Other denialist arguments about sea level concern the validity of observations, obtained via tide gauges and more recently satellite altimeter observations.
Tide gauges must take into account changes in the height of land itself caused by local geological processes, a favourite distraction for deniers to highlight. It will come as no surprise to learn that scientists measuring sea level with tide gauges are aware of - and compensate for - these factors. Confounding influences are accounted for in measurements and while they leave some noise in the record they cannot account for the observed long-term upward trend.
Various technical criticisms are mounted against satellite altimeter measurements by deniers. Indeed, deriving millimetre-level accuracy from orbit is a stunning technical feat so it's not hard to understand why some people find such an accomplishment unbelievable. It's astonishing that in another breath they are happy to jump aboard an airliner, parts of which are engineered to a similar tolerance!
In reality, researchers demonstrate this height measurement technique's accuracy to be within 1 mm/year. Most importantly there is no form of residual error that could falsely produce the upward trend in observations.
As can be seen in an inset of the graph in fig. 1, tide gauge and satellite altimeter measurements track each other with remarkable similarity. These two independent systems mutually support the observed trend in sea level. If an argument depends on skipping certain observations or emphasises uncertainty while ignoring an obvious trend, that's a clue you're being steered as opposed to informed. Don't be misled by only a carefully-selected portion of the available evidence being disclosed. Look at it all.
Current sea level rise is not exaggerated, in fact the opposite case is more plausible. For one, sea level rise is not the same everywhere. Many areas around the world already experience much faster rates of sea level rise than the average global rate shown in Fig 1. As well, observational data and changing conditions in such places as Greenland suggest if there's a real problem here it's underestimation of future sea level rise. Past IPCC synthesis reports offered rather conservative projections of sea level increase based on assumptions about future behaviour of ice sheets and glaciers, leading to estimates of sea level roughly following a linear upward trend mimicking that of recent decades. In point of fact, observed sea level rise is already above older IPCC projections - and accelerating - while at the same time it appears the mass balance of continental ice once envisioned by the IPCC was overly optimistic (Rahmstorf 2010; Otosaka et al. 2023).
Fast-forward to 2023 and the recent IPCC AR6 Synthesis Report is a bit less nuanced:
Limiting global surface temperature does not prevent continued changes in climate system components that have multi-decadal or longer timescales of response (high confidence). Sea level rise is unavoidable for centuries to millennia due to continuing deep ocean warming and ice sheet melt, and sea levels will remain elevated for thousands of years (high confidence). However, deep, rapid and sustained GHG emissions reductions would limit further sea level rise acceleration and projected long-term sea level rise commitment. Relative to 1995–2014, the likely global mean sea level rise under the SSP1-1.9 GHG emissions scenario is 0.15–0.23 m by 2050 and 0.28–0.55 m by 2100; while for the SSP5-8.5 GHG emissions scenario it is 0.20–0.29 m by 2050 and 0.63–1.01 m by 2100 (medium confidence).
The report goes on to state, however:
The probability of low-likelihood outcomes associated with potentially very large impacts increases with higher global warming levels (high confidence). Due to deep uncertainty linked to ice-sheet processes, global mean sea level rise above the likely range – approaching 2 m by 2100 and in excess of 15 m by 2300 under the very high GHG emissions scenario (SSP5-8.5) (low confidence) – cannot be excluded.
If they cannot exclude such risks - and they know what they are talking about - can you?
Last updated on 20 August 2023 by John Mason. View Archives


When will data about the first 4 months of 2014 be available? Particularly on volume of ice. I see comparisons of 2007 to 1979 used often. What about 1984 to today?
I just read the data on the rise of all the Great lakes back to about the 100 year normal. That had to take a lot of water out of the oceans. For example, the avg glacial loss of the entire Himalayas mountain range was 2 gigatonnes per yer in the early 2000's. Some would tout this as adding to the seal level rise. However, this year, 50 gigatonnes of ice was added just to lake Superior, Which rose 14 inches year over year, and is 32,700 square miles in area. It seems like climate reporters use the term gigatonne to describe loss of ice and the avg low info person thinks that it represents a very very large amount. So they report the Him. Mts. lost 2 gigatonnes of glacial ice in 2003 and that the rate of loss is increasing 10% over the rate from just 10 years earlier. When in fact, Lake Superior just gained 25 times as much ice as that this past winter. So I wonder since it is all quiet about this year's ice volumes that possibly the avg arctic ice volume has recovered most of the 5500 gigatonnes of avg loss since 1979. Even choosing 1979 as the baseline is rediculous. 1979 was the year that the great lakes ice coverage record was set that still stands and was not broken this year, but it came within 1-2 percent of being broken (~94%). Seems like 1979 was cherry picked. Just Lake Superior alone gained 50 gigatonnes of ice this past winter. The lake is still 67% ice covered on May 1. I calculated the 48 cu miles of that really bad year of ice loss from Greenland and spread it into the Earth's ocean surface area and multiplied it by 87 years and got 1.87 inches of sea level rise. What a sigh of relief it was.
It is curious this controversy on a scientific level. "They have a millimeter measurement" for 68 years ... every day ... well documented ... Panama Canal.
Repeat ... for 68 years
Without any pressure from powerful groups and only practical for the normal functioning of locks filing purposes.
The levels of the Pacific and the Atlantic, have been unchanged in the last 68 years.
Give a bit of a laugh to see how each to defend a theory and make specific studies in specific geographic areas and draw overall conclusions.
.
Governments need to collect more taxes, and for that... we have to blame something.
[TD] Please provide a citation for your claim. NOAA's Sea Level Trends page shows trend of increase since 1908/1909 on both ends of the canal. (Click the arrows on that page to see more info, and in the resulting dialog window click the "Linear Trend" link.)
TD inline @202
Cristobal JASL trend, 1907-2010: 1.5861 mm/yr. Note that there is a large dip in sea level around 2000, with a rapid recovery (nearby stations show trends of 13.788 and 13.707 mm per year in the period of recovery) such that by carefull enough chery picking you might find a period with near zero trend depite the rapid overall rise.
Balboa JASL 1907-2010: 1.5494 mm/year (previous link). In both cases extending the data beyond that held for the PSMSL stations increases the rate of sea level rise. That strongly suggests that any lack of sea level rise Maui claims is, at best, the result of cherry picking.
I think that a lot of you are missing the point, including the contributing author. Are sea levels rising? It would seem so. Is mankind in some way causing this phenomenon? Doubtful. The current period of climate change with accompanying measuements of atmospheric temperature and CO2 levels started approximately 18,000 years ago. There have been four periods where atmospheric temperatures and CO2 levels have been as high or higher than presently in the last 400,000 years (Source: http://www.grida.no/publications/vg/climate/page/3057.aspx) Mankind was obviously not the cause of any of these occurrences. The graph showing the rise in sea levels in the article posted here shows steadily rising sea levels since the 1870s. That should be expected when you consider that the "mini ice age" lasted from the 1300s to about 1850 and that is when the glaciers and sea ice reached their peaks. As that water becomes available again, sea levels rise. A way to look at it would be to look at Pevensey Castle, which was on England's South coast in 1066. Pevensey Castle is now a mile inland! (Source:http://wattsupwiththat.com/2013/12/02/history-falsifies-climate-alarmist-sea-level-claims/)
[Rob P] - Please note that WUWT is a spoof climate science site. For an understanding of the historical context of sea level rise since the last glacial maximum see these SkS posts:
1. Jerry Mitrovica: Current Sea Level Rise is Anomalous. We've Seen Nothing Like it for the Last 10,000 Years.
2. Sea Level Isn't Level: This Elastic Earth.
3. Sea Level Isn't Level: Ocean Siphoning, Levered Continents and the Holocene Sea Level Highstand.
Note that these SkS posts are based upon actual research by experts in the relevant scientific disciplines. I think that the main point is that non-expert expectations of sea level response are incredibly naive - you need to understand all the factors that affect relative sea level at any particular site. Why else do you think that specific site was chosen, and the 'big picture' blithely ignored?
Holdean... SLR is merely one piece of the larger picture related to man-made climate change and is fully consistent with all the other science on the issue. So, no, it's not "doubtful" in the least.
I don't know where you get the idea that "the current period of climate change [...] started approx 18k years ago." That's just not the case. The planet came out of a glacial into a new interglacial starting about 18k years ago. Since ~6000 years ago the planet had started into a neoglaciation that was abruptly ended with the start of the industrial revolution (See Miller 2010, Section 12.2).
No one rejects that there have been periods of higher temp and higher CO2 levels. That's not the problem. The issue is with the rate of change that natural systems, as well as human civilization, will be unlikely be able to adapt quickly enough to. Past rapid rapid climate change events are marked by mass extinctions such as the End Permian.
Holdean, Pevensey is an area that used to be a marsh, and the reason that the castle is now a mile inland is because the marsh silted up (c.f. the medieval shipyard at smallhythe that is also used to make similar arguments). There are numerous medieval (or older) villages and towns along the Sussex coast, which would have been underwater had sea levels been significantly higher prior to the little ice age. It doesn't take much basic fact checking to find that out. The plural of anecdote is not data.
Holdean wrote "There have been four periods where atmospheric temperatures and CO2 levels have been as high or higher than presently in the last 400,000 years (Source: http://www.grida.no/publications/vg/climate/page/3057.aspx) Mankind was obviously not the cause of any of these occurrences."
Yes, obviously, but that would be relevant to the current temperature increase only if we had no idea what controls temperature. In fact, we do know. See:
Holdean wrote "The 'mini ice age' lasted from the 1300s to about 1850 and that is when the glaciers and sea ice reached their peaks. As that water becomes available again, sea levels rise."
But the "mini ice age" (a.k.a. the Little Ice Age) was not in any way an "ice age" (we currently are in an ice age and have been for a long time), nor a glacial period within an ice age (currently we are in an interglacial period). Nor was the "mini ice age" global, and "it" was not even a single event. Instead, there were some isolated periods of strictly regional cooling separated by as much as hundreds of years. So the very existence of a global Little Ice Age is a myth. Those cooler periods loomed large in the minds of people who were living in those regions, and the cultural prominence of the opinions and writings of those people made those cooler periods seem singular, severe, and global.
See also "We're Coming Out of the Little Ice Age."
In all Skeptical Science posts, be sure to read not just the Basic tabbed pane, but the Intermediate and Advanced ones if they exist.
Holdean wrote "There have been four periods where atmospheric temperatures and CO2 levels have been as high or higher than presently in the last 400,000 years (Source: http://www.grida.no/publications/vg/climate/page/3057.aspx) Mankind was obviously not the cause of any of these occurrences."
This is incorrect. Present is 2014 with an atmospheric concentration of ~400ppm. In the ice core record, "present" is 1950. We are currently 100ppm higher than any point in that record.
Is there still "close agreement" that SLR is "steadily accelerating" as per the 2009 claim, or have some sensible adjustments been made since then?
[DB] Please provide your definition of "sensible adjustments".
Earthling - Yes, there is indeed continuing agreement that sea level rise continues, and over the longer term is accelerating, as per basic physics and observational data. Note that a five year period ("since 2009") is a _very_ short time given year to year variations.
What kind of "sensible adjustments" do you have in mind? And are they backed by any kind of data?
(DB) & KR - The meaning of sensible adjustments should be obvious, especially as SLR has slowed to around 2.54 mm/yr, as opposed to "accelerating."
ARGO + GRACE finds sea levels rising at 2.31 mm/yr.
Even the up adjusted from 1.59 mm/yr ENVISO rate is 2.96 mm/yr.
Earthling - Long term observations show continuing acceleration of SLR, with shorter term (including multidecadal) variation superimposed. For example, IPCC AR5 Chapter 13, which states from observations:
Even with variations the current rise rate is considerably higher than the numbers you posted:
[Source]
You seem to be emphasizing (or selecting) short term variations over longer term trends. That's of little use over longer periods, as variations will regress to the mean trend. And I'm still seeing no support for your "sensible adjustments".
If you would like a pictorial measure of sea level change, there are some great interactive photos taken in England and of the Normandy landings 70 years ago, and again last summer. Little has changed. http://www.theguardian.com/artanddesign/ng-interactive/2014/jun/01/d-day-landings-scenes-in-1944-and-now-interactive
There are other phots, not interactive, which show the same thing.
Of course, these photos were simply before and after photos, with NO agenda.
[Rob P] - You can't expect to be taken seriously unless you provide some background context for the photos. All readers here will be familiar with high and low tide.
whsmith @213, the IPCC stated:
I'll take the high end of that likely range, so 1.9 mm per year, or 95 mm over the 50 years from 1944 to 2014. So, you are claiming, by showing those photos that you can detect a difference of just under 4 inches in sea level between the Normandy landing photos, and the present day photos and conclude that it is not their. You can do this, moreover, without knowing the relative state of the tide, and despite obvious changes in the water front structures (in the first photo).
It is amazing the perceptive powers ideology grants ... (ROFLAO)
Whsmith,
Perhaps looking at pictures of beaches at low tide do not show the sea level rise much. As Tom states, it has only been 4 inches and they are used to meters of tidal range there. I note many pictures show beach erosion and cliff retreat, but I do not know if the cliffs were eroding before the war.
If you looked a little harder you might find a reference like this which documents the increase in sediment accretion of salt marshes in Normandy, France over the past 120 years. The marshes must accumulate sediment to keep ahead of sea level rise. These marshes are expanding since more area is salty now due to sea level rise.
Norrism:
The data that you have presented from the IPCC show a clear acceleration of sea level rise over the past 100 years. The data show that the rate of increase in increasing over the time period analyzed. The IPCC then did a linear fit to the data to get the rates you quote.
When you fit a line to an accelerating function you obtain approximatley the average of the rate of increase over the time period, not the instantaneous rate. Your claim of 3.2 mm/yr (increased from your previous rate of 3.0 mm/yr) is probably close to the rate during 2001. According to my calender, it is now 2017.
Deniers often use the IPCC rate from 1901-2010 of 1.7 mm/yr. Your choice is not as bad a cherry pick as that, but it still minimizes the current increase in sea level by averaging in old data. The 4.0 mm/yr rate I have cited is the current (2017) rate and is a conservative estimate since the data shows the rate is accelerating. This conservative rate with the current acceleration of the rate gives 95 cm as a conservative increase in sea level by 2100. You usually choose the minimum rates of whatever you are discussing.
Scientists are not generally allowed to cherry pick data in the fashion you do. We use the most up to date data possible, not data from years ago. Claiming that the sea level rise is only 3.2 mm/yr when up to date data show the rate is 4 mm/yr and accelerating is considered a cherry pick and is not a convincing argument.
It seems to me that lawers are trying to demponstrate that their argument is correct. They cherry pick information to make it appear their argument is correct even when it is incorrect. Scientists want to deduce the actual behaviour of nature. The most up to date data is used. At SkS we want to reveal what is actually happening in nature.
Here is a link to an analysis by Tamino. He discusses some of the techniques of analyzing data like this. His estimate of current sea level rise (data goes to 2013) is about 3.9 mm/yr. Dr. Nerem has data up to 2017. There are small differences between satalite data (Dr. Nerem) and tide guage data (Tamino). Tamino is a statistician who has published on climate change.
If you want you can use 3.2 mm/yr as the sea level rise but it is not an accurate number and it minimizses the problem of sea level rise. Note that the data in the OP here ends about 2010, it is not current.
michael sweet at 216
Thanks for the reply. When it comes to "what is happening" versus "what should be do about it", I think my attitude has settled on focussing on two observations and trying to understand them. They are temperature rise and sea level rise. This way I do not have to engage in areas of technical expertise such as the predictability of climate models where it would be hopeless for me to fully understand the complexities.
Obviously temperature increases and sea levels are intimately intertwined in that a large part of sea level rise is expansion.
I will look more carefully at your references and look at the most recent papers.
Can you explain from what date you are measuring the sea level rise?
I asked this question of someone else on the 1C temperature rise and found that there was not a clear agreement but I think we are dealing with ballpark 1850 to 1880. Is that the same for sea level rise?
On the "what should we do about it" question, is there a better place to discuss the 2010 Abbott paper which suggests we move to thermal solar for base load rather than wind or PV solar?
NorrisM:
I used 25 cm from somewhere up thread for the sea level rise from before 2017. If you go to Tamino's thread (previously linked) the next to last graph (easiest to read) shows sea level as -160 mm in 1880 and +70 mm in 2013. That is a total of 230 mm which is 23 cm. At 4 mm/yr for the past 4 years add 16 mm = 1.6 cm. Total = 25 cm. before 2017. I used d= vt + 1/2at2 to calculate 95 cm sea level rise using v= 4 mm/yr and 0.1 mm/yr2 = acceleration (83 years from 2017 to 2100).
This post from Zillow estimates damages from 6 feet of sea level rise in the USA as $882 billioon today. That is only the houses, not businesses, government, farms and infrastructure. It is a place to start. There are several problems I see with their analysis:
1: The sea level map they used shows inundation from sea level rise with 6 feet of sea level rise from mean higher high water (MHHW). Houses are never built at MHHW because then any storm surge would flood the house. (Storm surges of 1-2 feet are common). However, they used 6 feet which is closer to the upper end of sea level rise currently expected. I think the damage they estimate is about what 4 feet of sea level rise would cause because of the effect of storm surge.
2: They only count as damaged houses that are inundated. All of Miami that remained would be an island with 6 ft sea level rise. In addition, many houses are on small islands with several miles of the road leading to them inundated. How much is a house worth when the neighbors house is inundated and you have to drive through several miles of water to reach it?
3: Miami's water supply is located at 3 feet above sea level and is already having salt water intrusion problems. With only 3 feet of sea level rise they will be out of water. How much will Miami houses be worth when they have no water?
Read very carefully anything about damages caused by sea level rise. There are many ways to make a mistake. In general, scientific reports are written to be conservative. I recommend reading a lot of material before you make up your mind what you think. Tamino's work is always first class. This post from Real Climate (from 2013) is written by a sea level expert, take it very seriously. New data since then has raised expectations of sea level rise.
NorrisM:
RealClimate also has a search box. Put in "Sea level rise" and you will find several posts (including the one that michael sweet has pointed you to). Another good one is What Makes Sea Level Rise?.
In comment #217 you say '..."what is happening" versus "what should be do about it"...'. You have left out "what will happen". The whole aspect of acceleration in the next 80 years is not found by studying what has happened in the past 100 purely from the sea level data.
You need to understand why sea level has changed (both in the past century and the past 20,000 years). and apply that knowledge to what will happen by the year 2100. The physics of warming water already in the oceas, land ice melt, and transfers between ocean and land will play different roles - they are not expected to contribute in the same proportions as the planet warms. That's why simple extrapolation of past patterns is not enough. You need to know how oceans warm, and why ice sheets melt and decay (and that ice sheet melt will not be linear...)
As another analogy, consider paying off a home mortgage, amortized over 25 years with a monthly payment of $2000. In the first year, nearly all the payment goes to interest, and little of the principle is paid off. After one year, you still owe almost the full amount - much more than 24/25ths. Extrapolating that at a constant rate over 25 years would lead you to conclude that there is no way to pay off the mortgage. On the oher hand, understanding how interest and principle are calculated and paid off makes you realize you will eventually own your house free and clear.
Norrism:
I found this description on Climate Central of the map that was used by Zillow for their analysis:
"This analysis uses elevation data on a roughly 90-meter horizontal resolution grid derived from NASA’s Shuttle Radar Topography Mission (SRTM). SRTM provides surface elevations, not bare earth
elevations, causing it to commonly overestimate elevations, especially in areas with dense and tall buildings (Gamba et. al, 2002) or vegetation (Shortridge et. al, 2011) . Therefore, this analysis very likely underestimates, and Mapping Choices under-portrays, areas that could be submerged at each lockedin sea level, and so the following analysis and visualization should be seen as likely lower bounds" (my emphasis).
Source. (Zillo cites NASA but it is the same map that Climate Central uses). This is a serious problem with most sea level damage analysis. Many informed people are not aware of this problem. Obviously, people cannot live on top of trees and buildings when the land is covered with water. I had thought that Climate Central used actual land heights. Actual damages are certain to be much higher than estimated by Zillow. Scientists make conservative estimates.
michael sweet and Bob Loblaw
In an earlier post on another thread (which discussion has properly moved to this location) I posed the following question:
"It is interesting that in the above IPCC quote we had similar "high rates" during the period 1920-1950. Curious as to whether there is any explanation of that anomaly."
And Bob Loblaw @ 219 states:
"You need to understand why sea level has changed (both in the past century and the past 20,000 years) and apply that knowledge to what will happen by the year 2100."
It seems now that Steve Koonin has posed the very same question in a critique issued by him on October 10, 2017 prior to the release of the CSSR report which I understand just happened. You can read his criticique at https://curryja.files.wordpress.com/2017/11/cssr-on-slr.pdf
I am not saying that the recent sea level rise since 1993 is not more relevant than the average over the 20th century but does it not behoove scientists to either explain the 1920 to 1950 rise or admit that they do not know?
And I agree with Koonin that the CSSR, by not including this information in the Executive Summary (which is intended for the layman), shows that it is not just a scientific report but rather one which is intended to "move the agenda". It is this attitude of the "consensus side" which drives conservatives crazy. If the facts were honestly stated on both sides then you would not get this kind of dismissive reaction from Republicans who you have to convince ( a common theme in my posts).
Is there a scientific explanation for why sea level rises during the period 1920-1950 were close to the same as the present rates?
NorrisM:
I have no interest in what Steve Koonin has asked - he has no credibility as a scientific source on climate change, due to reasons already explained. Judith Curry is also of no interest to me. Most of what gets posted on her site is a waste of time.
In comment 219, I posted a link to RealClimate. It includes the following graph:
I assume that you have followed the links given to you, or have a reason not to. What is it about this figure that you question? What about it fails to answer the question you are posing about cause of changes in sea level rise in the past century?
[DB] Fixed image width.
Crap. That figure ended up being a lot wider than I expected. Moderators, can you please fix?
[JH] Fixed.
NorrisM @221
As evidenced in the new research summarized in the following article, sea level rise is a very complex subject matter. You would do well to focus your time and energy on peer-reviewed papers published in reputable scientific journals rather than on the pseudo-science poppycock posted on Judith Curry's website.
New science suggests the ocean could rise more — and faster — than we thought by Chris Mooney, Energy & Envronment, Oct 26, 2017
Thanks, gentlemen. I should know better.