


 Arguments


How sensitive is our climate?
What the science says...
| Select a level... |
 Basic
Basic
|
 Intermediate
|
 Advanced
| ||||
|
Net positive feedback is confirmed by many different lines of evidence. |
|||||||
Climate Myth...
Climate sensitivity is low
"His [Dr Spencer's] latest research demonstrates that – in the short term, at any rate – the temperature feedbacks that the IPCC imagines will greatly amplify any initial warming caused by CO2 are net-negative, attenuating the warming they are supposed to enhance. His best estimate is that the warming in response to a doubling of CO2 concentration, which may happen this century unless the usual suspects get away with shutting down the economies of the West, will be a harmless 1 Fahrenheit degree, not the 6 F predicted by the IPCC." (Christopher Monckton)
At-a-glance
Climate sensitivity is of the utmost importance. Why? Because it is the factor that determines how much the planet will warm up due to our greenhouse gas emissions. The first calculation of climate sensitivity was done by Swedish scientist Svante Arrhenius in 1896. He worked out that a doubling of the concentration of CO2 in air would cause a warming of 4-6oC. However, CO2 emissions at the time were miniscule compared to today's. Arrhenius could not have foreseen the 44,250,000,000 tons we emitted in 2019 alone, through energy/industry plus land use change, according to the IPCC Sixth Assessment Report (AR6) of 2022.
Our CO2 emissions build up in our atmosphere trapping more heat, but the effect is not instant. Temperatures take some time to fully respond. All natural systems always head towards physical equilibrium but that takes time. The absolute climate sensitivity value is therefore termed 'equilibrium climate sensitivity' to emphasise this.
Climate sensitivity has always been expressed as a range. The latest estimate, according to AR6, has a 'very likely' range of 2-5oC. Narrowing it down even further is difficult for a number of reasons. Let's look at some of them.
To understand the future, we need to look at what has already happened on Earth. For that, we have the observational data going back to just before Arrhenius' time and we also have the geological record, something we understand in ever more detail.
For the future, we also need to take feedbacks into account. Feedbacks are the responses of other parts of the climate system to rising temperatures. For example, as the world warms up. more water vapour enters the atmosphere due to enhanced evaporation. Since water vapour is a potent greenhouse gas, that pushes the system further in the warming direction. We know that happens, not only from basic physics but because we can see it happening. Some other feedbacks happen at a slower pace, such as CO2 and methane release as permafrost melts. We know that's happening, but we've yet to get a full handle on it.
Other factors serve to speed up or slow down the rate of warming from year to year. The El Nino-La Nina Southern Oscillation, an irregular cycle that raises or lowers global temperatures, is one well-known example. Significant volcanic activity occurs on an irregular basis but can sometimes have major impacts. A very large explosive eruption can load the atmosphere with aerosols such as tiny droplets of sulphuric acid and these have a cooling effect, albeit only for a few years.
These examples alone show why climate change is always discussed in multi-decadal terms. When you stand back from all that noise and look at the bigger picture, the trend-line is relentlessly heading upwards. Since 1880, global temperatures have already gone up by more than 1oC - almost 2oF, thus making a mockery of the 2010 Monckton quote in the orange box above.
That amount of temperature rise in just over a century suggests that the climate is highly sensitive to human CO2 emissions. So far, we have increased the atmospheric concentration of CO2 by 50%, from 280 to 420 ppm, since 1880. Furthermore, since 1981, temperature has risen by around 0.18oC per decade. So we're bearing down on the IPCC 'very likely' range of 2-5oC with a vengeance.
Please use this form to provide feedback about this new "At a glance" section. Read a more technical version below or dig deeper via the tabs above!
Further details
Climate sensitivity is the estimate of how much the earth's climate will warm in response to the increased greenhouse effect if we manage, against all the good advice, to double the amount of carbon dioxide in the atmosphere. This includes feedbacks that can either amplify or dampen the warming. If climate sensitivity is low, as some climate 'skeptics' claim (without evidence), then the planet will warm slowly and we will have more time to react and adapt. If sensitivity is high, then we could be in for a very bad time indeed. Feeling lucky? Let's explore.
Sensitivity is expressed as the range of temperature increases that we can expect to find ourselves within, once the system has come to equilibrium with that CO2 doubling: it is therefore often referred to as Equilibrium Climate Sensitivity, hereafter referred to as ECS.
There are two ways of working out the value of climate sensitivity, used in combination. One involves modelling, the other calculates the figure directly from physical evidence, by looking at climate changes in the distant past, as recorded for example in ice-cores, in marine sediments and numerous other data-sources.
The first modern estimates of climate sensitivity came from climate models. In the 1979 Charney report, available here, two models from Suki Manabe and Jim Hansen estimated a sensitivity range between 1.5 to 4.5°C. Not bad, as we will see. Since then further attempts at modelling this value have arrived at broadly similar figures, although the maximum values in some cases have been high outliers compared to modern estimates. For example Knutti et al. 2006 entered different sensitivities into their models and then compared the models with observed seasonal responses to get a climate sensitivity range of 1.5 to 6.5°C - with 3 to 3.5°C most likely.
Studies that calculate climate sensitivity directly from empirical observations, independent of models, began a little more recently. Lorius et al. 1990 examined Vostok ice core data and calculated a range of 3 to 4°C. Hansen et al. 1993 looked at the last 20,000 years when the last ice age ended and empirically calculated a climate sensitivity of 3 ± 1°C. Other studies have resulted in similar values although given the amount of recent warming, some of their lower bounds are probably too low. More recent studies have generated values that are more broadly consistent with modelling and indicative of a high level of understanding of the processes involved.
More recently, and based on multiple lines of evidence, according to the IPCC Sixth Assessment Report (2021), the "best estimate of ECS is 3°C, the likely range is 2.5°C to 4°C, and the very likely range is 2°C to 5°C. It is virtually certain that ECS is larger than 1.5°C". This is unsurprising since just a 50% rise in CO2 concentrations since 1880, mostly in the past few decades, has already produced over 1°C of warming. Substantial advances have been made since the Fifth Assessment Report in quantifying ECS, "based on feedback process understanding, the instrumental record, paleoclimates and emergent constraints". Although all the lines of evidence rule out ECS values below 1.5°C, it is not yet possible to rule out ECS values above 5°C. Therefore, in the strictly-defined IPCC terminology, the 5°C upper end of the very likely range is assessed to have medium confidence and the other bounds have high confidence.
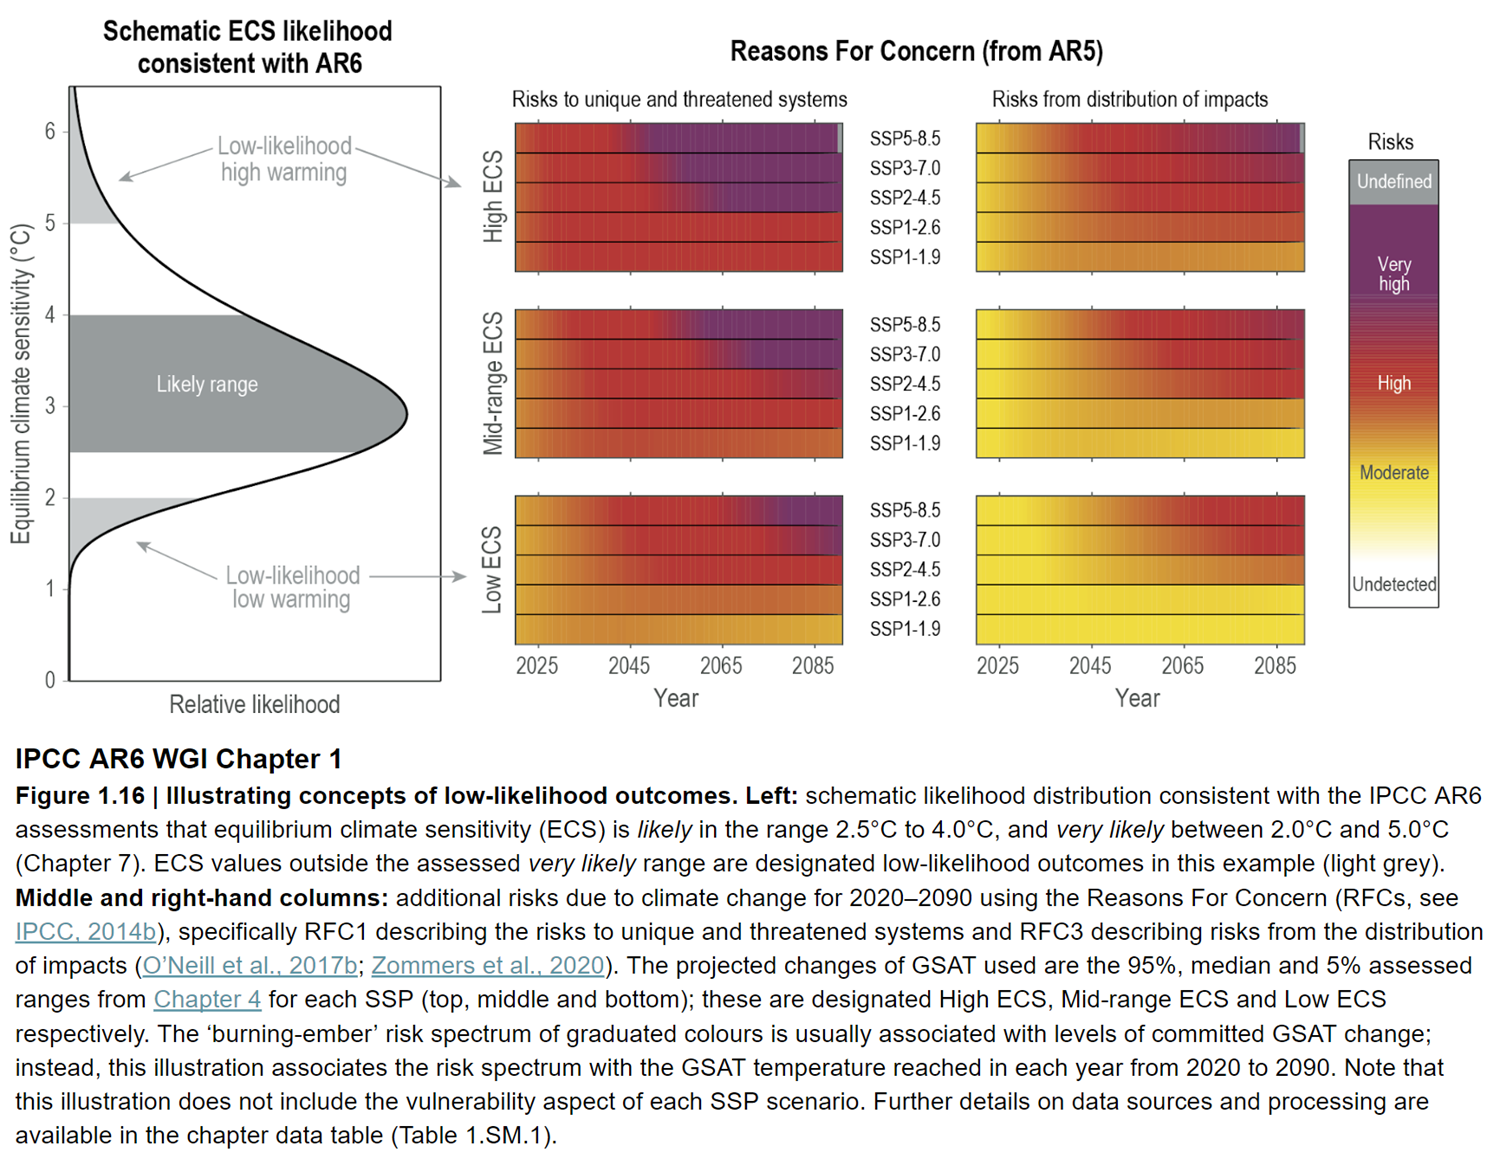
Fig. 1: Left: schematic likelihood distribution consistent with the IPCC AR6 assessments that equilibrium climate sensitivity (ECS) is likely in the range 2.5°C to 4.0°C, and very likely between 2.0°C and 5.0°C. ECS values outside the assessed very likely range are designated low-likelihood outcomes in this example (light grey). Middle and right-hand columns: additional risks due to climate change for 2020 to 2090. Source: IPCC AR6 WGI Chapter 6 Figure 1-16.
It’s all a matter of degree
All the models and evidence confirm a minimum warming close to 2°C for a doubling of atmospheric CO2 with a most likely value of 3°C and the potential to warm 4°C or even more. These are not small rises: they would signal many damaging and highly disruptive changes to the environment (fig. 1). In this light, the arguments against reducing greenhouse gas emissions because of "low" climate sensitivity are a form of gambling. A minority claim the climate is less sensitive than we think, the implication being that as a consequence, we don’t need to do anything much about it. Others suggest that because we can't tell for sure, we should wait and see. Both such stances are nothing short of stupid. Inaction or complacency in the face of the evidence outlined above severely heightens risk. It is gambling with the entire future ecology of the planet and the welfare of everyone on it, on the rapidly diminishing off-chance of being right.
Last updated on 12 November 2023 by John Mason. View Archives


@Tom Curtis #345:
"...the modelled TOA energy imbalance lies within error (actually, withing 1.2 SDs) of the observed value."
It generally always does for these model-observation discrepancies, but then again the models are always on the hot side aren't they?
@Tom Curtis #345:
"...the modelled TOA energy imbalance lies within error (actually, withing 1.2 SDs) of the observed value."
It generally always does for these model-observation discrepancies. However, if the model-observation discrepancies are always on the hot side that is more than an "emotive" argument don't you think?
Klapper - I've responded on the appropriate thread for this conversation.
Iff we were to cut CO2 emissions in half tomorrow would we still go past 580ppm by 2100 due to possible outgassing of the ocean?
Klapper @348:
First, you were comparing the difference between model TOA energy imbalance and observed 0-2000 meter OHC.
Second, absolutely right I was ignoring that. Just because you want to compare the model TOA energy imbalance with approximately 80% of the observed energy imbalance (ie, the 0-2000 meter rate of change in OHC) in no way makes that justified. Nor does it justify you comparing model 2000-2015 model TOA energy imbalance with 2005-2010 TOA energy imbalance as you did @325. You seem to have a penchant for strengthening your case by using inappropriate comparisons. However, as you insist that I not use the appropriate comparison because you originally used the inappropriate comparison, I will notice it and call it what it is - ie, fraudulent argument.
bozza @354, even emissions at 10% of current rates would be sufficient to keep on increaseing atmospheric CO2 concentrations, and ergo prevent net ocean outgassing of CO2. The rate of increase of atmospheric CO2 would, however, slow to a standstill in that case - and slow substantially if we only halve emissions. Having said that, the proportion of emissions retained in the atmosphere would not necessarilly remain at the current 55%, and would decrease over time with increasing SST (assuming constant emissions). It follows that while 2100 concentration would probably be below 580 ppmv, I cannot tell you how far. The nearest I can do is show you the RCP 4.5 figures (second graph) as the nearest approximation (first graph).
Apologies for this one folks. Bobl over at joannenova is adamant that he has been banned from sks for his truth-telling, and I told him I'd ask a question for him. A couple commentators now have a bee in their bonnet given I tried to address it myself, so here you have it:
In 1850 the temperature was about 0.75 deg C lower than now, the CO2 was supposed to have been about 270PPM. Now it’s 400 PPM.
We know from Arhennius that deltaT = k ln(CO2-2/CO2-1)
So, therefore 0.75 = k ln(400/270) and therefore k=0.75/ln(400/270)
k = 1.91
So lets then calculate the warming for a doubling
DeltaT = 1.91 × ln 2 = 1.34 degrees per doubling between 1850 and 2014
Now the IPCC says that 50% of warming is probably coming from humans and 50 % is natural variation so if we assume that 50% of all the warming from 1850 to now is CO2 induced (which it is not, the bit from 1850 to 1950 is unlikely to be CO2 related) at best we causing just 0.77 degrees of warming due to mans gasses, and the other 0.77 degrees must be something else which won’t necessarily accumulate.
0.77 degrees per doubling implies feedback was negative over the period from 1850 to 2014.
Given CO2 warming over the last 130 PPM was at best 0.37 to 0.75 degrees and the implied climate sensitivity from that is therefore 0.77 to 1.35 degrees per doubling, therefore the magic 2 degree figure (noting that the IPCC says up to 2 degrees of warming will be positive for the human race) is likely 500 – 1000 years away from happening, why are we even worried about it?
[DB] "Bobl over at joannenova is adamant that he has been banned from sks for his truth-telling"
There is only one SkS user with "bob" prefacing their user name that is banned from this venue and that is user "Bob Smith", who had his commenting privileges revoked for being a sock puppet of yet another SkS user.
Tristan,
If Bobl claims that his estimate is "truth telling" it is easy tp see why he has trouble at SkS.
Checking the GiSS temperature records I find that in 1880 the anamoly was -.38 degrees while 2014 was +.86 degrees (it is more accurate to do a least squares fit but Bobl did not say how he got his numbers). I find that to be 1.24 degrees since 1880. The records previous to that are incomplete and inacurate. Bobl is probably using HADCRU which is well known to underestimate warming since it does not cover the entire globe. Since this year is currently running .15 degrees above last year and there is an El Nino that will increase temperatures later this year it will not be surprising to see 1.4C globally this year. At .15/decade it will only be 40 years to the 2C disaster threshold.
Bobl knows that the current temperature is not in equilibrium with the forcing. He has left this amount out of his calculation. Estimates range around .7C in the pipeline. That makes 1.94 degrees for an estimated final temperature with current CO2 concentrations. Using 1.24 degrees I get 3.18 degrees per doubling and using 1.94 I get 4.97 degrees per doubling (!!). The IPCC estimates there is greater than 95% chance of 50% of warming being due to humans with 106% the best estimate (Bobl knows that too). The 3.18 must be multiplied by 1.06, not by .50. That rounds the estimates to about 3.2 degrees per doubling for observed warming and 5 degrees including the warming in the pipeline.
The agreement is that above 2C is a disaster, not that below 2C could be good. Warming is accelerating so I expect 2C to happen in my children's lifetime.
Tristan,
I used the Northern Hemishpere data instead of the global data (my link is to the correct data). 1880 was -.22 and 2014 was +.68. That gives .90 observed and 1.6 including warming in the pipeline. That is 2.3C per doubling or 4.1 incuding warming in the pipeline. Multiplying by 1.06 gives 2.4 observed warming and 4.3C at equilibrium.
Tristran @357.
I must say that JoannaNova comment thread is a classic. I think they could be sitting on a new direction for comedy. "Exactly Tristan, where are the published figures on jet stream friction, where are the published figures on kinetic energy of global rainfall…. though you can calculate that one, it’s about 0.05 Watts per square meter, comprising about 10% of the imbalance energy." Never one to shirk a challenge, if raindrops hit 20mph & average global rainfall 900mm, Bobl is only a triffling 5000% out!!
As for his question, if you use the forcings from AR5 AII Table 1.2 (which are a little higher than CO2 forcing alone), & the global numbers@359 (but assuming 0.86W/m2 imbalance) you get an ECS = 2.8ºC but most folk consider energy balance methods do underestimate ECS. The figure is also sensitive to negative forcing levels with their big error-bars.
Bobl writes, "Now the IPCC says that 50% of warming is probably coming from humans and 50 % is natural variation ...".
What the IPCC actually wrote was that:
where "very likely" means "90-100%" likelihood. In other words, what the IPCC claimed was that there is a less than 10% chance that only 50% or less of 1951-2010 warming was due to anthropogenic forcings. That is sufficiently different, indeed contradictory of what Bobl claimed the IPCC wrote that prima facie, he is a bald faced liar.
Indeed, it is worse than that. The IPCC also provided a figure with the mean and uncertainties of attribution. This allows you to generate the Probability Density Function (PDF) of the AR5 attribution, as was done by Real Climate:
From this, in turn, it can be determined that the actual likelihood of less than 50% anthropogenic causes of warming since 1951 is 0.06%. It follows that at best Bobl is calculating the lower bound of the 99.9% probability range of the "climate sensitivity". To perform the calculation correctly (ignoring other errors), he should have used an attribution of 107.7% (the mean value of the PDF). Correcting for this factor alone would more than double his "climate sensitivity" estimate.
It should be noted, of course, that the IPCC attribution statement only covers the period 1951-2010. It cannot be arbitrarilly extended to cover periods back to 1900, 1880 or 1850. Natural forcings were negative from 1850 to about 1910, strongly positive from then to 1940, and remained positive to about 1950, as they more than recouped the losses to 1910, and have been effectively neutral or slightly negative since then. The result is that 70% is a better estimate than 108% for the anthropogenic contribution since 1900 (or 1880), but 100% is probably more accurate for the anthropogenic contribution since 1850. These figures, of course, are highly uncertain and not particularly precise. Sufficiently so that I consider estimating climate sensitivity from temperature differences between two dates with the first date prior to 1950 to be essentially a waste of time. If you are going to make those estimates, you should greatly increase the data used to counter the uncertainties. You do this by fitting a Transient Climate Response (TCR) function to annual data as Kevin Cowtan has done. The result is a TCR around 2 C per doubling of CO2, with an Equilibrium Climate Sensitivity necessarilly greater than that.
@DB, thanks for checking, those arguments definitely sound like ones he'd make, though I dont know if that's him.
@michaelsweet, thanks, can't blame a layperson for using hadcrut in this instance, and I'm waiting for his response on the as-yet-unrealised warming.
@MARodger, the best moment I've had recently was when someone told me that you couldn't use EVs for continuous random variables, and when I pointed him to a description of how you could he claimed "Queen's Gambit" and that he just was proving that I could spot a cherry pick. Which, I dunno, means he can accuse me of dishonesty in the future if I fail to agree with him that something is a cherry pick? Guess he got me.
@TomC, thanks, I actually posted that very graph before coming here, to which Bobl responded: my math is pretty much indisputable. I expect if he did [post it at Sks] I’d not get one refutation, they’ll either pick an irrelevancy like Tristan did, or for example want to pick a higher figure for the warming from 1850.
Every few months I go back, thinking, "maybe there'll be some people who respond in a reasonable manner", but the content is 40% rhetorical games, 30% slurs, 20% crazy, and only 10% the sort of argument I'm looking for. And then you I moderated for...who knows. I was told narcissism. I guess for not showing enough deference.
Tristan @362, out of interest I just downloaded the forcing data from the IPCC AR5. From that I was able to determine the relative contributions of natural and anthropogenic components between certain dates and 2009 using five year running means:
1850 104.52%
1880 102.34%
1900 94.58%
1950 109.72%
Note that the ratio of difference in forcing is not the same as contribution to difference in temperature. That is because there is some internal variability in temperature, because volcanic temperature responses are not commensurate with instaneous volcanic forcings due to thermal inertia, and because earlier forcings will have more fully worked through the system than will have later forcings. With these caveats, however, the relative contribution to change in forcing is a good first approximation to the relative contribution to change in temperature.
Allowing for the caveats, I believe the 1880 and 1900 figures significantly overstate the anthropogenic contribution. In particular, the anthropogenic contribution to change in forcing falls to 57% in 1885 and to 76% in 1904. Given the extent and intensity of volcanism that cause those falls, it would be foolish to assume a simple five year mean of the forcings captures the temperature impacts of that volcanism. Further, there is good reason to believe there was a significant contribution from internal variability to the temperature increase from 1910-1940 which will be diluted but also relevant to the temperature increase to 2010.
Of course, Bobl is not entitled to these caveats. In his calculation he ignores internal variablity (which of necessity cuts both ways), and by assuming TCR = ECS, he also ignores thermal inertia. Given that, it would be inconsistent of him to not use the relative contribution to forcing increase as the relative contribution to temperatue gain.
Interesting, I would not have intuited that result at all!
bobl's difficulties in finding the sensisitivity to GHGs would be further compounded by the fact that you shouldn't be looking at the net antho effect anyway - as that ignores the negative anthro forcings.
It seems that you can't determine the ECS (or it's more relevant brother, TCR) from the recent temp record without first accepting the validity of quite a number of papers, something that bobl would never admit to doing in the first place. He's kinda stuck.
The wikipedia article on Climate Sensitivity states that the transient climate sensitivity is lower than equilibrium climate sensitivity which I do not quite understand. By definition, climate sensitivity is the change in surface temperature per unit change in radiative forcing. As I understand, climate sensitivity can be obtained both from models and observations. Lets talk about models' climate sensitivity. In models, the ocean heat uptake is not quite well represented in transient simulations while in long term simulations (assuming that model reaches equilibrium), ocean heat uptake may be well represented. So in long term model simulations, one would expect that the surface temperature change per unit change in radiative forcing would be lower because the heat would be well mixed in the ocean as compared to transient simulations. Am I missing something? Could anyone comment on this?
psagar @365, the IR flux from the top of the atmosphere is a function of Global Mean Surface Temperature (GMST), not of how much heat is stored at the Earth's surface. Therefore, as a forcing is an imbalance in the Top Of Atmosphere (TOA) energy flux, to restore equilibrium with a change of forcing requires a change of GMST. No amount of change in Ocean Heat Content (OHC) by itself will have any effect on that.
Of course, change in heat content is related to change in temperature by the heat capacity. Therefore, increasing the OHC will also increase GMST. That increase, however, will continue until the TOA imbalance is eliminated, which is to say, until the change in GMST causes a change in OLR sufficient to compensate for the original forcing and any consequent changes as a result of feedback. The difference the effective heat capacity of the system makes is that the larger the capacity, the more heat must be pumped into the ocean for the same rise in GMST.
So, turning to the relationship between Transient Climate Response (TCR) and Equilibrium Climate Sensitivity (ECS). Technically the TCR is the temperature after 70 years of increasing CO2 concentration by 1% per annum (ie, at the time the CO2 concentration reaches twice the initial value). The ECS is the temperature after the CO2 is doubled and the temperature stops changing (ignoring slow feedbacks). Typically that is about 200 years after the CO2 reaches 2 times its initial concentration, although it varies from model to model depending on the effective heat capacity of the Earth's surface in the model. The smaller the effective heat capacity, the more rapidly will the model reach equilibrium, and the closer TCR will be to ECS.
In the real world, the TCR is a close approximation to the immediate temperature response to a slow forcing change. Thus we can treat the TCR is the current mean decadal temperaure divided by the current forcing and multiplied by 3.7 W/m^2 (ie, the forcing for doubled CO2). However, as the TOA energy imbalance currently is about 0.8 W/m^2, we clearly are not yet at equilibrium even though we are, by the approximation above, at the TCR for the current forcing. As closing that imbalance requires increasing GMST, it follows that ECS > TCR in real life, and not just in the models. As an aside, ECS cannot be less than TCR by virtue of the definitions of the terms, and will only equal TCR if the effective heat capacity of the Earth's surface closely approximates to zero.
Tom Curtis @366, Thank you. "The smaller the effective heat capacity, the more rapidly will the model reach equilibrium, and the closer TCR will be to ECS." I agree that the the samller the effective heat capacity, the more rapidly will the model reach equilibrium, but I do not understand how that lead to conclude "and the closer TCR will be to ECS".
I like the definition of climate sensitivity as 'change in surface temperature per unit change in radiative forcing'. But the change in surface temperature would also cause a change in radiative forcing. So, we cannot say with certainty that ECS is higher or lower than TCS.
I clearly see that the change in surface temperature and TOA radiative forcing simulated by the model depends upon the model complexity, for example, how the ocean circulations are represented. Assuming a constant external forcing, different models would show different surface temperature change and so the climate sensitivity of different models would also be different. So I still have a thinking that ECS could be higher or lower than the TCS depending upon the complexity of the model.
Talking about real world or observations, we cannot still be certain that the TCS would be lower than ECS. For example, say we measured temperature change and radiative forcing for a decade and get a transient climate sensitivity. Now lets calculate the same for 100 years (assuming that we have the data). How can we say with certainty that one would be higher than another?
[JH] Please see the SkS Glossary for the comonly accepted scientific definitions of TCS and ECS.
psagar @367, first, Forcing (or Radiative Forcing) is given the following definition by the IPCC:
I have quoted the full entry in the glossary below, as it contains relevant technical information plus some comments on idiosyncracies of usage.
The important point for this discussion is that radiative forcings are only those changes in TOA energy flux due to external drivers, ie, those not effected by climate variables such as (particularly) temperture and (also) precipitation, wind velocity etc; at least not on the time scale of interest. So, while a change in CO2 concentration will cause a change in radiative forcing, and changes in temperature will cause changes in TOA energy flux, changes in temperature do not cause changes in radiative forcing (by definition of radiative forcing). While this is a just a matter of definition, in my experience those who ignore the clarity given by distinguishing between radiative forcings and changes in TOA energy flux in response to feedbacks always end up making mistakes when thinking about issues of climate change.
Looking at this in more detail, we have:
ΔQ = ΔF - α ΔT (1)
where ΔQ is the change in net downward TOA energy flux, ΔF is the change in forcing, ie, the change in net downward TOA energy flux that is independent of climate states, ΔT is the change in global means surface temperature, and α is the climate feedback parameter. The climate feedback parameter is also defined in the IPCC glossary, and equation (1) is just an algebraic transformation of the mathematical definition of the climate sensitivity parameter given there. (Note, however, that the IPCC uses ΔQ for forcing, and ΔF for energy flux. I use the opposite values as it is more intuitive, and also the common practise among some climate scientists.) The units for α is in Watts m-2 oC-1, and it is the converstion factor between GMST and change in net upward TOA energy flux.
From (1), simple algebra tells us that when the GMST is at equilibrium, ie, ΔQ = 0, then
ΔF = α ΔT (2)
Equation (2) just tells us that ΔF and α ΔT have opposite intrinsic directions, ie, while ΔF reffers to net downward flux, α ΔT refers to net upward flux (as emphasized above).
Now, by definition, if ΔT equals the Transient Response to a given forcing, ΔF, then ΔF - α ΔTCR does not equal zero. If it did, the TCR would be the also be the Equilibrium Climate Response. Nor can it be greater than the ECS, for (with a positive forcing) if it were ΔF - α ΔTCR would be negative. It would follow that at some lower temperature the TOA heat flux (ΔQ) would have been equal to zero, at which point the GMST would have stopped changing, thereby preventing the temperature rising to the greater value. It follows that TCR < ECS, more or less of necessity.
So, while it is possible to construct unrealistic scenarios where TCR is approximately equal to ECS, it is literally not possible to construct one where TCR > ECS. At least, not without a fantasy physics.
Glossary Entry
psagar
Some points to remember. Climate response (and thus climate sensitivity) isn't just about radiative balance, heat capacity etc. Another key factor is Albedo - how reflective the Earth is.
If the earth reflects the same percentage of sunlight then climate change is about radiation, heat capacity etc.
However if the Albedo is changed by climate change this in turn changes the energy balance and adds other climate change. There may be changes in cloud cover. Far more certainly there will be changes in surface reflectivity; changes in snow and ice cover, open water area, regions of desert, vegetation patterns etc. All these impact reflectivity. Warming certainly reduces snow & ice cover for example.
Importantly, many of these changes take long time periods to occur. Ice sheet changes particularly take centuries to unfold.
Tom Curtis @368, thanks for the illustration. Sorry for responding late but earlier I could not completely follow your comment. I am back again to this discussion as the semester is over.
I follow and agree until your statement "Nor can it be greater than the ECS, for (with a positive forcing) if it were ΔF - α ΔTCR would be negative." I do not understand what you are saying with this statement. I also do not understand the statements that follow. How does it then establish that TCR < ECS? Could you please rephrase these explanations a bit so that I can understand.
According to the following article, the Recent CO2 Climate Sensitivity Estimates Continue Trending Towards Zero
https://notrickszone.com/2017/10/16/recent-co2-climate-sensitivity-estimates-continue-trending-towards-zero/
What is your view on this article? Is it reliable? Do you share its findings?
I only spent a few minutes on this, but I found the following item to be sufficient to lead me to be very skeptical of any claim posted on NoTricksZone.
"NoTricksZone Review - Too Many Tricks in Denier Article"
Artmemidor,
The "no tricks zone" is a well known denier site. They only cite denier papers and not the much more numerous papers supporting the IPCC position. (There are more than 30 real papers for every denier paper published).
Scafetta, the lead author of the paper they cite, is a well known denier who has been debunked many times. The paper is published in the International Journal of Heat and Technology, a journal that is unrelated to climate change. One technique of deniers is to publish papers in unrelated journals where the editors are sympathetic to denier views or will publish anything that pays the fee. If it was a real paper then they would publish in a climate journal.
At Realclimate, a web site run by real climate scientists, the current lead article is a simulation of the past three million years of climate that estimates the climate sensitivity at 3C per doubling, the midrange of the IPCC report.
Carbon dioxide concentrations have risen from 280 ppm pre industrial to current levels of 410 ppm. Temperatures have risen by 1 degree C or more. About 0.5C is estimated to be unrealized heating or masked by aerosols.
Currently measured temperature increases are already too high for a climate sensitivity of less than 2C and are not well described by a sensitivity of less than 3C. If the arctic sea ice melts out that will increase the climate sensitivity since open water absorbs more heat that ice covered water.
The article you cite is intended to confuse the uninformed and not to help increase understanding of climate.
Could be interesting to gather up Scarfetta past prediction papers and see how well they have panned out compared to reality.
Notrickszone were so confident that many reader were willing to bet on cooling. You can see here how well that is panning out so far.
Doesnt pay to believe your own nonsense.
What's the response to this paper? Do we know what longer series or more recent data would show?
Thanks
No experimental evidence for the significant anthropogenic climate change
[JH] Please read:
Non-peer-reviewed manuscript falsely claims natural cloud changes can explain global warming, Claims Review Edited by Scott Johnson, Climate Feedback, July 12, 2019