


 Arguments


What has global warming done since 1998?
What the science says...
| Select a level... |
 Basic
Basic
|
 Intermediate
| |||
|
Every part of the Earth's climate system has continued warming since 1998, with the ten record temperature years all occurring since 2010. |
|||||
Climate Myth...
It hasn't warmed since 1998
For the years 1998-2005, temperature did not increase. This period coincides with society's continued pumping of more CO2 into the atmosphere. (Bob Carter)
At a glance
This date-specific talking-point is now something of a historical curiosity, but we'll leave it in the database for now because it's such a good illustration of the simplistic yet reckless mindset of the serial climate change misinformer. And indeed, we could (out of sheer mischief) have revised this myth by replacing "1998" with "2016". In fact, that's what we started to see in the climate change misinformation stream, © the Usual Suspects. But 2023's record temperatures put a stop to that.
Anyway, as first predicted over a century ago, Earth's surface, oceans and atmosphere are all heating up. That's due to our increasing greenhouse gas emissions, but over the years the warming has occurred at varying rates. This should in no way come as a surprise. Other physical phenomena periodically act either to suppress or enhance temperatures.
A prime example of such a phenomenon is the effects of La Nina and El Nino. This natural climatic oscillation features variations in winds and sea surface temperatures over the tropical eastern Pacific Ocean. The cycle can at times strongly influence temperature and rainfall patterns right around the world.
In a La Nina year, temperatures are suppressed, whereas an El Nino year sees them enhanced. This is noise on the long-term upward trend. That's why climatologists work with multiple decades, not just a few years in isolation, in order to get a grasp on what is going on.
The year 1998 featured a massive El Nino. The temperature spike it caused was a huge outlier, like a pinnacle towering over the landscape of the temperature record. In the following years there was a return to more typical conditions, with an erratic but upward warming pattern. That sequence of events gave deniers a brief opportunity to insist that global warming had “paused” or had even stopped.
You only need to remember one thing here. Those who create and spread misinformation about climate change don't care about reality. Public confusion is their aim. In this instance, the misinformation exercise involved deliberately selecting a limited block of years starting with the massive El Nino of 1998 and using that very warm starting-point to insist that global warming had stopped. They knew this would likely work for a few years and that the public would quickly forget why that was the case. Mother Nature had handed them a gift. It was an irresistible bunch of low-hanging fruit to exploit: little wonder the tactic is known as 'cherry-picking'.
Talking about reality, what actually happened? Well, as of 2024, a couple of decades down the line, the top ten warmest years have all been since 2010, whatever observation-based dataset you choose, with eight of them being in the 2015-2023 period. 1998 is nowhere to be seen any more. By modern standards, it simply wasn't warm enough.
Please use this form to provide feedback about this new "At a glance" section, which was updated on May 27, 2023 to improve its readability. Read a more technical version below or dig deeper via the tabs above!
Further details
Even if we ignore long term trends (something deniers often do in order to make a point) and just look at the record-breakers, as of early 2024 the top ten warmest years have all been since 2010, whatever dataset you choose, with eight of them being in the 2015-2023 period. In this top ten grouping, 1998 is nowhere to be seen any more. It was not warm enough.
The myth of no warming since 1998 was largely based on the satellite record estimates of the temperature of the atmosphere. However, as discussed in the video below by Peter Sinclair, even that argument is no longer accurate. The satellites show warming since 1998 too.
There's also a tendency for some people just to concentrate on atmospheric or surface air temperatures when there are other, more useful, indicators that can give us a better idea how rapidly the world is warming. More than 90% of global warming heat goes into warming the oceans, while less than 3% goes into increasing the atmospheric and surface air temperature. Records show that the Earth has been warming at a steady rate before and since 1998 and there is no sign of it slowing any time soon (Figure 1).
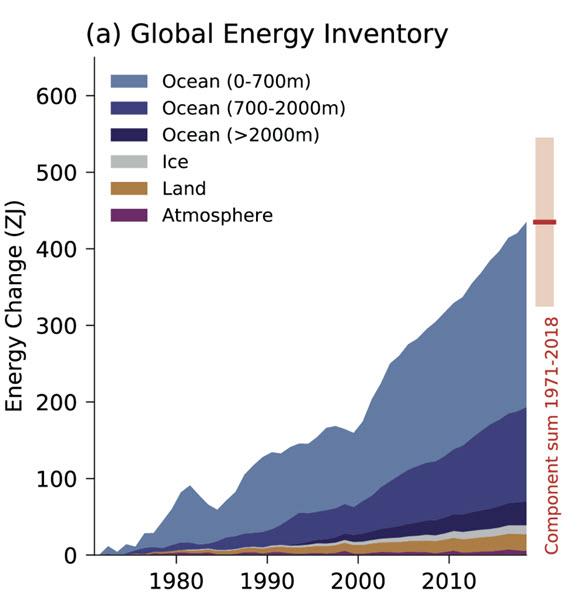
Figure 1: Global Energy Inventory: observed changes in the global energy inventory for 1971–2018 (shaded time series) with component contributions as indicated in the figure legend. Cross-Chapter Box 9.1 Figure 1 (part a) - From IPCC AR6 WGI Chapter 9.
Even if we focus exclusively on global surface temperatures, Cowtan & Way (2013) shows that when we account for temperatures across the entire globe (including the Arctic, which is the part of the planet warming fastest), the global surface warming trend for 1997–2015 is approximately 0.14°C per decade.
Ultimately, every part of the Earth's climate system is warming, and has continued warming since 1998.
Last updated on 8 March 2024 by John Mason. View Archives


Guym @400 , [and my apologies for the long post]
the "hiatus" still lives on — at least in the minds of the climate denialists. (The less-educated denialists often refer to it as "the Pause" . . . and seem to wish to genuflect at its mention.) Although the hiatus disappeared 4 years ago, many denialists feel that the recent record-hot years [2014/2015/2016/2017] are a transient aberration; and that within a very few years, planet Earth will return to another prolonged halt in warming (and thus all the scientists will conclusively be proven wrong). And moreover, the Earth will probably cool down, back to its rightful & divinely ordained un-warmed condition. That is their faith. But they have zero mechanism to point to, which could produce such a change (they sometimes point to the future possibility of a Grand Solar Minimum . . . but they refuse to acknowledge that such an event, if it would occur at all, could only produce a feeble/ineffectual counter to the ongoing rapid warming caused by the Greenhouse Effect — an Effect which many denialists still refuse to believe CO2 has any place in).
I am fairly sure I am not telling anything you aren't already aware of.
Denialists will only look at planetary surface temperatures: and even there, they have an extreme preference for the satellite record of temperatures limited to to the upper troposphere, rather than the actual planetary surface temperatures down here at ground level. They have a blind spot for other surface changes such as ice melting and sea levels rising — or at least, they will consider such changes only in isolation (and will quibble about those changes individually, rather than putting it all together in the big picture).
Where denialists do pay attention to real surface conditions, they usually restrict their mental focus to the region around Latitude 40 North and Longitude 80 West. Other regions receive attenuated or non-existent concern.
Denialists mentally refuse to look at the ongoing continuous warming of the ocean, and they have a massive blind spot for the 90+% of global warming energy which goes into the ocean. For them to acknowledge that fact, would mean acknowledging it is impossible for a genuine hiatus to exist (short of the Earth reaching thermal equilibrium as a new higher plateau of GH Effect).
Consequently, they still agonize over the so-called Hiatus/Pause; they discuss it as though it never terminated, and they still put enormous effort into statistical analysis "proving" that the Hiatus was/is real. They denounce the scientific view that there never was a real post-1998 hiatus . . . and they are still buoyed by the way that some real scientists were embarrassed (and insecure) enough to name a "hiatus" (as well devoting some discussion & research time to it. Surely there can be no smoke without fire !! Nor can there be any ocean warming, or even Greenhouse Effect !! The existence of an unpredicted Hiatus must mean that the scientists' models from the 80's and 90's . . . are false & invalid. Likewise all the rest of the Warmist/Alarmist blather & propaganda).
Guym, for my sins (and for my entertainment) I sometimes look at the WhatsUpWithThat website. The actual articles are a complete waste of time — being either crazy stuff, or semi-real stuff which has received ferocious "spin". But in the comments column under each article, you find a 100 or so "comments". 95% of them, you should slide straight past — they are the usual deluded/toxic/extremist nonsense spouted by angry denialists who are using the WUWT site as an echo-chamber to bolster their strange/bizarre beliefs. But there are a few gems.
Keep your eye alert for (A) posts by Nick Stokes — a real scientist, with saintly patience, who infuriates the denialists by his cool corrections of their nonsense (they just can't win a trick against him)
. . . and (B) a couple of denialists [I won't name them] who have enough science & math to produce umpteen paragraphs of equations & analyses — all of it ultimately fruitless in reality; yet they lack the insight to see that they are willing victims of severe Motivated Reasoning. If they were sane, then they could achieve a considerable amount if they turned their talents to actual real science, I'm sure. Ah, what a waste. One of them asserts that the CO2 / Greenhouse Effect does not exist, and that "AGW" is truly just a result of long-cycle ocean oscillations. Quite crazy.
The other [and here I finally address the main point of your post] goes in for lengthy statistical analyses to demonstrate that the recent "hiatus" must have been genuine because he can find "no statistically significant" upward trend in (surface) temperature. He does sometimes admit that there seems to be a very slight positive trend during the hiatus — but since it is statistically not significant in its difference from zero trend, then he concludes that there was no actual warming during that period (and therefore the scientific climate consensus is wrong in its entirety).
Not only does he ignore the ongoing melting and sea level rise, but he seemingly cannot conceive that the real purpose of statistical analysis is to reflect reality, rather than conceal it. He prefers to look at his figuring, rather than look at the reality of the physical processes affecting climate.
guym @400,
I have long pondered the "hiatus" nonsense from contrarians. My take on it is perhaps more clinical than Eclectic @401, and a smidgen shorter.
One of the difficulties we face addessing the "hiatus" is that contrarians define the "hiatus" to mean vastly different things, from silly nonsense from Rose of the Daily Rail (Temp(Jan1996)=Temp(Aug2012) => global warming stopped 16 years ago) to more allegedly-grown-up versions comparing modeled & measured temperatures. Which ever version is used, their take-away is "Global Warming has stopped" or "Models are badly wrong". And any attempt to sensibly address the issue like in the AR5 Box 9.2 or for instance Hansen et al discussing the 'Global Warming Standstill' in 2012 results in a contrarian 'we told you so!!' response which is then grafted onto nonsense by even the more respected of contrarians to beat the "Global Warming Has Stopped!!!" drum (eg ex-clomatologist Judith Curry).
So you really do have to be careful when addressing the issue of the "hiatus" and that means more than using a title that calls it the "Hiatus in Global Mean Surface Warming of the Past 15 Years" as per AR5 Box9.2.
I think the AR5 Box9.2 use of OLS analysis over the period 1998-2012 was poorly contrived. (For the record, the resulting SAT trend roughly doubles if you use 1999-2012, to +0.09ºC/decade, instead of 1975-1996.) What was poor was firstly comparison of 1998-2012 with 1951-2012. The start period should have been roughly 1975, the start of the recent strong AGW. Contrarians who exaggerate the significance of the "hiatus" would be surprised to hear that if you compare 1975-1996 with 1975-2012 you get almost identical trends. The reason for 1998-2012 being so different from the longer-term SAT trend is because the 1998-2012 SAT trend relies on one of those reality-busting steps as in the SKS Escalator. So a second criticism of AR5 Box9.2 is giving credance to the 1998-2012 reality-busting OLS analysis.
Simply-put, anybody who (a) supports a "hiatus" 16-years long or (b) uses the "flatness" in surface temperature record to create a 16-year long "hiatus" by for instance saying "I predict we will see continuation of the ‘standstill’ in global average temperature for the next decade" (and good old Judy Curry manages both a & b) show they have departed from truthful analysis of AGW.
I myself feel the way to take command of the "hiatus" is by setting its true length. This analysis of HadCRUT data (usually 2 clicks to 'download your attachment') finds it was just 32 months long. And a message that must always be included in "hiatus" talk - thoroughout these years, AGW did not show any signs of faltering as the Ocean Heat Content data surely demonstrates.
Correction to #402.
Para 3 should read "... instead of 1998-2012."
I am not a climate scientist and have no knowledge of the sophistication of the models. But is there a way to explain the 'Hiatus' when considering the melting of ice?
Doesn't the ice absorb a lot more heat going through the phase change to water? So once the world has warmed up enough to initiate a lot of ice melting, the large scale ice melting would then absorb a lot of heat energy and keep temperatures relatively stable, until a significant amount of ice has melted. Then everything would continue heating up more linearly.
Basically the world is acting like a big old glass of iced water with a lid on top, left out in the sun!?
The scary thing is what happens when the stabilising effect of melting is over and all those previously white, heat reflecting surfaces have gone to reveal plenty of dark rock and gravel...
andyred3D, there is really no "hiatus" to explain. Statistical analysis of the time series of global surface temperature anomalies does not show a significant departure from the trend; correcting for El-Nino/La Nina and volcanic activity makes it even more obvious. The so-called hiatus is entirely dependent on selecting 1998 as a start date, and as we all know, that year saw a massive El-Nino. What is remarkable is that it took only a few years for global temps to set a new normal at or above the extraordinary 1998 level. Moderate or non El-Nino years then beat 1998 and finally when a comparable El-Nino came, the 1998 record was shattered. There was no pause.
[DB] To illustrate the overall trend, here's the NASA GISS temperature record with a 132-month filter applied:
The overall long-term trend continues upward, inexorably, as Philippe notes.
andyred3D @404,
There are big amounts of energy required to melt Arctic Sea Ice each spring/summer, also the amount released with the winter freeze-up. Of course this cycle has been happening for millenia and involve lots of energy. So such energy fluxes are already part of global climate and even then they fall far short (perhaps just 10%) of that which would be released by global surface temperatures falling modestly behind the long-term upward trend. If you are interested, numbers can be presented but they are a mite too involved to pop into the thread without an audience.
to Philippe at 405:
Thank you so much for the updated temperature plot. It is the best "Hiatus Killer" I've seen.
For years I have been waiting to see the SKS escalator brought up to date, showing 2019.
I would have a methodological questions. As this text suggests:
„To claim global warming stopped in 1998 also overlooks a simple physical reality - the land and atmosphere are just a small fraction of the Earth's climate (albeit the part we inhabit). The entire planet is accumulating heat due to an energy imbalance. The atmosphere is warming. Oceans are accumulating energy. Land absorbs energy and ice absorbs heat to melt. To get the full picture on global warming, you need to view the Earth's entire heat content. More than 90% of global warming heat goes into warming the oceans, while less than 3% goes into increasing the atmospheric and surface air temperatures. Nuccitelli et al. (2012) showed that the Earth has continued to heat up since 1998.”
– global warming is not really about temperature, but about the amount of energy.
But this is often misunderstood. Throughout the media, global warming is portrayed as if it could be characterized by changes in temperature.
Q = c * m * ΔT, but here c is not an exact value, consider large pressure and temperature differences
E (pot) = m * g * h, E (kin) = (m * v ^ 2) / 2
And I would have more questions here.
1. What do we refer to the amount of energy? Atmosphere? The kinetic and potential energy of air? With or without hidden heat? (The equivalent potential temperature (theta-e) is the temperature a sample of air would have if all its moisture were condensed out by a pseudo-adiabatic process (i.e., with the latent heat of condensation being used to heat the air sample), and the sample then brought dry-adiabatically back to 1000 hPa.) Surface? How deep? One meter? More? Caves? Groundwater that has a connection to the surface? Top 200 meters of oceans? Or the whole ocean? Energy stored in salinity and depth? Ice? Melting or freezing energy? Potential energy?
1.conc. Average global temperature? Why? When misleading in light of the above: the amount of energy (no matter how we determine what we include in it) is not equal to temperature. Thus, a change in temperature cannot be equal to a change in the amount of energy! Not me saying that. The quoted text does this.
2. We determine what we want to measure. Can it succeed? Can we assign a global average to the temperature of the entire earth? When I buy myself a pair of pants, at least three metrics help me with that. And do we characterize the average temperature of the earth (or rather the total amount of energy) with a single data? Even if we do, what are we going to do with it? What usable speech data does this tell us? This is because exactly what spheres are included in the total energy calculation are closely related to this data. If we calculate this as accurately as we wanted, what can we say about how long this accuracy has been available to us in the past? 10 years ago? 100 years?
2.atm. Do we really measure the temperature and humidity and density of the entire atmosphere? Do we really know the temperature of the earth's surface all over the earth at a depth of one meter?
2.surf. Do we know how much energy is stored in that part of the earth’s surface that is involved in the processes detailed here, absorbs sunlight, and largely heats the atmosphere? Do we know its density? Do we know your specific heat? Do we know its water content? Maybe it's not just the top one that counts? Could it be several meters in some cases? Who can say that? How to calculate? If someone says something, what to expect from him? How do you justify his theory?
2.oce. Do we know the temperature and the amount of dissolved salt everywhere in the oceans? Of course, we don't have an instrument everywhere, we fill in the missing data with approximation calculations. What is the ratio of the total error rate caused by the approximate calculations to the percentage of change to be examined? I read in several places that only the top 200 meters of the oceans matter in terms of global warming. Others write 100 meters. Many people write that the deep ocean has only long-term effects, it doesn’t count in the heat balance in the short term. Why a hundred? Why two hundred? Why doesn't it matter? The limit drawn here seems very arbitrary to me, and in terms of the change in total energy ... it is important to decide and justify: whether or not to include the deep ocean in the energy balance when examining global warming!
2.conc. I see a lot of temperature charts pros and cons. This is how the temperature goes up or how the earth cools. But none of the camps really show how the total amount of energy on earth measured according to the principles detailed above has changed, at least in the last 10-20 years, where perhaps we already have evaluable data in this regard. How can we start a scientific debate without clarifying the framework? The concepts? Principles of repeatable measurements? How is the data processed? Both camps bombard the media with marketing texts that pick it up as raw material and distort it so that it will no longer be completely untraceable to the average person.
3. A degree of warming of the whole ocean is approx. on the order of 10 ^ 24 Joules. Melting the ice of Antarctica would absorb 10 ^ 24 Joules of energy. A degree of warming of the dry air is on the order of 10 ^ 21 Joules. The Sun kisses the Earth with 10 ^ 24 Joules of energy in one year.
Based on these, the scare that the entire Antarctic ice sheet will melt soon seems rather doubtful. This event would eliminate the amount of energy in a whole year of solar radiation (of the same order of magnitude). This needs to be justified! While land ice heats the air when it forms and cools the air when it melts, the formation of coastal ice hanging in the ocean heats both the surface of the ocean and the air, but its melting typically cools the deeper layers of the ocean. Interestingly, land ice can be coastal ice. I hope I use good concepts. The direction of energy as a whole: heat is transferred to the atmosphere from the deeper parts of the ocean. People with CO2 can't warm up the ocean as a whole, just the top few hundred meters. And that is my next question. Are we counting the incoming solar rays and the outgoing infrared rays in the total amount of energy on earth? For example, the city is 35 degrees Celsius in vain if objects are 50-70 degrees Celsius and radiate heat unbearably to humans, while the same 35 degrees in the forest is unpleasant but tolerable because here the temperature of the objects is not higher than the air temperature. Here, the air temperature alone is very misleading. And sorry for the analogy, do we count the energy on the ocean heat transfer road to the total amount of energy on earth? I would like to draw attention to a trap. When the ocean conveyor delivers less energy, the average temperature in the upper part of the ocean is lower, but in this case heat is trapped around the Equator and the poles cool. On the other hand, with higher energy transport, the surface temperature of the oceans increases, most of the excess heat arrives at the poles from around the Equator, so significant warming begins here, more significant than at the Equator. However, the excess heat at the poles also means that the earth's surface can radiate over a larger surface at a higher temperature (T ^ 4). Overall, more heat is dissipated compared to when the capacity of the oceanic strip was smaller, disregarding other factors. I am thinking in particular here that, as soon as the Arctic ice melts in the summer, this process must be taken into account, because the thermal insulating effect of the ice will disappear.
3.conc. Is it conceivable that a change in the latter will affect a change in the distribution of the total amount of energy on earth? Perhaps these and other relevant metrics can bring the understanding and explanation of global warming closer to both experts and the average person?
Vonyisz @408 :
You have gotten yourself all tangled up. Please step back and look at the overall picture ~ and at what has changed over the past (say) 150 years in our modern world.
The mean sea-level has risen, and continues to rise. The amount and distribution of planetary ice has reduced, and continues to reduce. The planet is warming ~ warming in ocean, topsoil, and lower troposphere. All the regions where plants & animals live.
You do not need to know worldwide soil temperature "all over the earth at a depth of one meter". Unnecessary detail !
But you do need to know the overall trend of warming ~ how large it is, what is causing it, and what we should do to counteract it. Over many decades, the climate scientists have discovered the trend, and its causations.
Vonyisz:
Interesting questions. Most of your questions are answered in other posts here on Skeptical Science.
First I would point out that the OP you are responding to was written in December 2007. Since then, as the OP correctly predicted, the temperatures have risen substantially and no-one seriously claims that the temperature is not increasing any more.
There are indeed many metrics that can be measured for heat content of the entire Earth. Most or all of them are measured. For a general audience, like here on Skeptical Science, the surface air temperature is easiest to explain and relates to peoples lives best. The total ocean heat content (all the way to the bottom) is probably a more scientific measurement but does not relate to people as well. Global warming warms the ocean all the way to the deepest depths. In general, the warming is slower the deeper you go.
I recently saw an article (sorry no cite) that said the surface ten meters or so of land has heated up more than scientists thought. As you point out measuring the heat content of soil is difficult, but scientists make the best estimates thay can. Scientists are contually improving heat measurements. Skilled scientists know these measurements and consider them but for the average man on the street (or woman) the surface air temperature means the most. The surface air temperature is noisier than ocean heat content but people relate to air temperatures better.
I have seen calculations similar to yours about melting the ice in the Antarctic (or Greenland). The point is that if all the ice in the Antarctic melted 65 meters of sea level rise would result!! So if only 0.1% of the Suns energy melted ice it would result in 6 centimeters of sea level rise per year! What a disaster that would be.
It turns out that scientists working full time on these difficult questions can reach fairly good approximations of all these measurements. Sometimes a new measurement changes the picture a little (like the land measurements mentioned above), but overall where the heat goes is well known. If you ask about a single one of the measurements you mentioned above perhaps someone can give you a citation. You have too many questions here to specifically answer them.
Voyisz @408,
You quote the OP which is making the point that Ocean Heat Content is the big recipient of the global energy imbalance caused by AGW (rather than the warming which results in surface temperature increases which is a minor recipient).
You follow that by the assertion that it is all about energy rather than temperature which is true but not greatly relevant as Ocean Heat Content is effectively a temperature thing.
And then you introduce the concepts of PE & KE.
Surely PE & KE are red herrings. Is there some part of the global system where mass is increasing in altitude? Are there parts of the global system where stuff is whizzing about faster? In energy terms, any such change globally (if at all) will be miniscule enough to be entirely irrelevant, thus the red herrings.
Thanks for your answers Eclectic michael sweet MA Rodger
I’m sorry if I was misunderstood when I called attention not to consider temperature as energy. I note that I consider this an important detail that cannot be ignored. I have quoted the sentences I have quoted in terms of method, of course I know, like everyone here, what has happened since then. I know that from a marketing point of view, it would sound pros and cons to describe global warming in ten powers and all this in Joules. It is easier to enter in degrees Celsius. But for that simplification, we are paying a high price. This is because we can easily liken an apple to an elephant. The temperature of the deep ocean is fundamentally determined by the amount of cold water: the largest "river" from the Arctic. „The total ocean heat content (all the way to the bottom) is probably a more scientific measurement but does not relate to people as well. Global warming warms the ocean all the way to the deepest depths. In general, the warming is slower the deeper you go.” – Sure?
„You follow that by the assertion that it is all about energy rather than temperature which is true but not greatly relevant as Ocean Heat Content is effectively a temperature thing.
And then you introduce the concepts of PE & KE.
Surely PE & KE are red herrings. Is there some part of the global system where mass is increasing in altitude? Are there parts of the global system where stuff is whizzing about faster? In energy terms, any such change globally (if at all) will be miniscule enough to be entirely irrelevant, thus the red herrings.” – E (pot) = m * g * h true or not? In terms of energy, it is important where (high and salinity) a 5 degree water in the ocean. In the same way, at different altitudes of the atmosphere, 5 degrees of air can be associated with different amounts of energy (the hidden energy of water vapor). This is not a joke, can we agree on that? Is the temperature almost energy? Are you serious? When tenth and hundredth of a degree Celsius changes are included in scientific articles, should we be generous and say that temperature is equal to energy? I understand that mathematical accuracy is different from physical accuracy. But this is an exaggeration. I think so. Although air temperature is significant in our daily lives, it is only one element of our sense of warmth. Other elements: wind, percentage of water vapor, temperature of surrounding objects, energy of current sunshine. It is not possible to snatch one of these five elements. On the other hand, in the energy balance of the earth’s surface (no matter how we determine what we include in it and what we omit), we can agree that the vast majority of energy is stored in the ocean. If we really want to study global warming, we need to look largely at the dynamics of the energy of the oceans. We don’t just need to be able to measure temperature changes. Not just the top 2000 meters. We need to explore the temperature profile of the entire ocean. We need to be able to examine the causality of the processes.
In any case, there is a need to justify why the temperature at the poles is rising much faster than around the Equator. If it is also about accelerating heat transfer, there is also a chance that the deep ocean will cool faster. Because water vapor at the poles does not interfere with radiation (in the atmosphere), and because the radiation is proportional to the fourth power of the temperature (in Kelvin), the radiation at the poles has multiplied into space due to global warming and other processes. Although some of the cold produced in this way also cools the air around the poles, here I find it important to mention here that some of the cold “disappears” for us into the depths of the oceans (especially the Atlantic Ocean). How much of this cooling cools the atmosphere and the upper ocean and how much of it deepens the deep ocean? This process will really "explode" when the Arctic ice disappears. I was looking for a scientific description of this (believe me), I haven't found it on the internet yet.
It’s a mystery to me how warmer water gets into the deep ocean, as you can read in many places. I know there are salt fingers, but they don’t affect the area below 3,000 feet. You wrote (and thank you) to ask only one question, only one. Here’s what we know about changes in energy across the ocean today? Not just the top 2000 or 3000 meters, but the whole ocean! What do we know about changes in the great ocean flow system? Thank you in advance for your answers.
Vonyisz @412,
The use of energy fluxes and energy anomalies to account for AGW is the useful approach. Mind the global surface temperature that results remains the main measure of the problem. You subsequently argue that there are other measures of importance (eg wind, humidity) but these effectively all lead on from temperature, as does the poleward energy fluxes (which will increase under AGW thus and this result in the boosted temperature rises seen in Arctic Amplification).
On the issue of PE. Yes the simplistic PE=mgh is correct (although it gets a little more complex when applied to a spinning planet). But from this point you entirely fail (and will fail) to present any significant increase in PE resulting from AGW. If the oceans were to warm by a single degree Celsius, the energy required to provide that temperature increase will be hundreds of times (using a very gererous Coefft of Thermal Expansion, 350-times) greater than the PE increase due to thermal expansion of the oceans. Similarly, the energy of Latent Heat required to evaporate a kg of water to add to the atmospheric mass would equal the PE required to raise such a mass 230km.
In general, such small factors involving PE are quite ignorable.
Vonyisz,
The answer to your question "what we know about changes in energy across the ocean today?". The ARGO floats measure most of the ocean to a depth of 2,000 meters. This part of the ocean is pretty well known. The areas under sea ice are harder to measure but not that extensive (and they are measured to some extent). Deeper than 2,000 meters is hard because there are not many old measurements. Fortunately, the change in temperature is small, hundredths to thousandths of a degree.
This article gives information on ocean temperatures to a depth of 4757 meters near Argentina. They were using equipment designed to measure currents and realized that they had sensitive temperature measurements also. Apparently these current measurements are done in many locations and scientists will use them to determine deep ocean changes for the past 10-15 years. These detailed measurements can be used to calibrate other older records.
The bottom line is that the deep ocean has not changed very much yet. Because it is so hard to measure the changes are not well characterized. Recent data will start to track deep ocean changes. Because the changes are small they do not affect the big picture of AGW.
A lot is known about ocean flow also. This article details changes in large eddies. Other currents are monitored regularly. Scientists often report that they are surprised by how fast everything is changing. They are optimistic at first.
Please note: the basic version of this rebuttal has been updated on Feb 14, 2023 and now includes an "at a glance“ section at the top. To learn more about these updates and how you can help with evaluating their effectiveness, please check out the accompanying blog post @ https://sks.to/at-a-glance
Thanks - the Skeptical Science Team.