


 Arguments


What does past climate change tell us about global warming?
What the science says...
| Select a level... |
 Basic
Basic
|
 Intermediate
| |||
|
Greenhouse gasses, principally CO2, have controlled most ancient climate changes. This time around humans are the cause, mainly by our CO2 emissions. |
|||||
Climate Myth...
Climate's changed before
Climate is always changing. We have had ice ages and warmer periods when alligators were found in Spitzbergen. Ice ages have occurred in a hundred thousand year cycle for the last 700 thousand years, and there have been previous periods that appear to have been warmer than the present despite CO2 levels being lower than they are now. More recently, we have had the medieval warm period and the little ice age. (Richard Lindzen)
At a glance
Just imagine for a moment. You fancy having a picnic tomorrow, or you're a farmer needing a dry day to harvest a ripe crop. So naturally, you tune in for a weather-forecast. But what you get is:
“Here is the weather forecast. There will be weather today and tomorrow. Good morning.”
That's a fat lot of use, isn't it? The same applies to, “the climate's changed before”. It's a useless statement. Why? Because it omits details. It doesn't tell you what happened.
Climate has indeed changed in the past with various impacts depending on the speed and type of that change. Such results have included everything from slow changes to ecosystems over millions of years - through to sudden mass-extinctions. Rapid climate change, of the type we're causing through our enormous carbon dioxide emissions, falls into the very dangerous camp. That's because the faster the change, the harder it is for nature to cope. We are part of nature so if it goes down, it takes us with it.
So anyone who dismissively tells you, “the climate has always changed”, either does not know what they are talking about or they are deliberately trying to mislead you.
Please use this form to provide feedback about this new "At a glance" section. Read a more technical version below or dig deeper via the tabs above!
Further Details
Past changes in climate, for which hard evidence is preserved throughout the geological record, have had a number of drivers usually acting in combination. Plate tectonics and volcanism, perturbations in Earth's slow carbon cycle and cyclic changes in Earth's orbit have all played their part. The orbital changes, described by the Milankovitch Cycles, are sufficient to initiate the flips from glacials (when ice-sheets spread over much of Northern Europe and the North American continent) to interglacials (conditions like the past few thousand years) and back – but only with assistance from other climate feedbacks.
The key driver that forces the climate from Hothouse to Icehouse and back is instead the slow carbon cycle. The slow carbon cycle can be regarded as Earth's thermostat. It involves the movement of carbon between vast geological reservoirs and Earth's atmosphere. Reservoirs include the fossil fuels (coal/oil/gas) and limestone (made up of calcium carbonate). They can store the carbon safely over tens of millions of years or more. But such storage systems can be disturbed.
Carbon can be released from such geological reservoirs by a variety of processes. If rocks are uplifted to form mountain ranges, erosion occurs and the rocks are broken down. Metamorphism – changes inflicted on rocks due to high temperatures and pressures – causes some minerals to chemically break down. New minerals are formed but the carbon may be released. Plate tectonic movements are also associated with volcanism that releases carbon from deep inside Earth's mantle. Today it is estimated by the U.S. Geological Survey that the world's volcanoes release between 180 and 440 million tonnes of carbon dioxide per year - as opposed to the ~35 billion tonnes we release.
Epic carbon releases in the geological past
An extreme carbon-releasing mechanism can occur when magma invades a sedimentary basin containing extensive deposits of fossil fuels. Fortunately, this is an infrequent phenomenon. But it has nevertheless happened at times, including an episode 250 million years ago at the end of the Permian Period. In what is now known as Siberia, a vast volcanic plumbing-system became established, within a large sedimentary basin. Strata spanning hundreds of millions of years filled that basin, including many large coal, oil, gas and salt deposits. The copious rising magma encountered these deposits and quite literally cooked them (fig. 1).
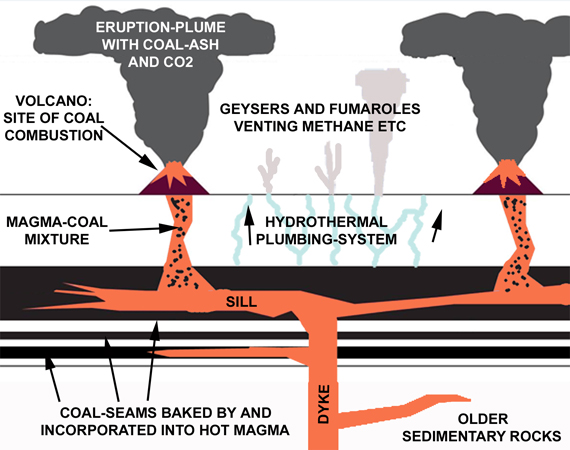
Fig. 1: schematic cross section though just a part of the Siberian Traps Large Igneous Province, showing what science has determined was going on back then, at the end of the Permian Period.
Now laden with a heavy payload of gases, boiled out of the fossil fuel deposits, some of the magma carried on up to the surface to be erupted on a massive scale. The eruptions – volcanism on a scale Mankind has never witnessed - produced lavas that cover an area hundreds of kilometres across. Known as the Siberian Traps, because of the distinctive stepped landforms produced by the multiple flows, it has been calculated that the eruptions produced at least three million cubic kilometres of volcanic products. Just for a moment think of Mount St Helens and its cataclysmic May 1980 eruption, captured on film. How many cubic kilometres with that one? Less than ten.
Recently, geologists working in this part of Siberia have found and documented numerous masses of part-combusted coal entrapped in the lavas (Elkins-Tanton et al. 2020; fig. 2). In the same district are abundant mineral deposits formed in large pipes of shattered rock as the boiling waters and gases were driven upwards by the heat from the magma.
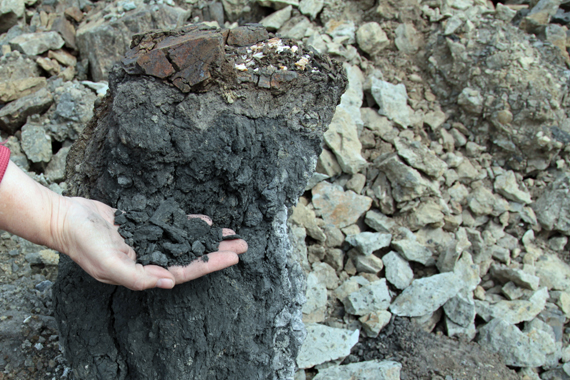
Fig. 2: an end-Permian smoking gun? One of countless masses of part-combusted coal enclosed by basalt of the Siberian Traps. Photo: Scott Simper, courtesy of Lindy Elkins-Tanton.
It has been calculated that as a consequence of the Siberian Traps eruptions, between ten trillion and one hundred trillion tons of carbon dioxide were released to the atmosphere over just a few tens of thousands of years. The estimated CO2 emission-rate ranges between 500 and 5000 billion tonnes per century. Pollution from the Siberian Traps eruptions caused rapid global warming and the greatest mass-extinction in the fossil record (Burgess et al, 2017). There are multiple lines of hard geological evidence to support that statement.
We simply break into those ancient carbon reservoirs via opencast or underground mines and oil/gas wells. Through such infrastructure, the ancient carbon is extracted and burned. At what rate? Our current carbon dioxide emissions are not dissimilar to the estimated range for the Siberian Traps eruptions, at more than 3,000 billion tons per century. The warning could not be more clear. Those telling you the climate's changed before are omitting the critical bit – the details. And when you look at the details, it's not always a pretty sight.
Last updated on 14 February 2023 by John Mason. View Archives


Bruce. Hard to know where to begin.
CO2 does not reflect sunlight - the gas is transparent to the frequencies of radiation coming from sun. However, the gas absorbs infrared radiation leaving the surface. So GHG lets energy in but slows energy going out.
A warming ocean will emit CO2 (melting permafrost and temperate wetlands are other sources of GHG as temperature rise), but the oceans will not become net emitters of CO2 for hundreds of years. Currently they are absorbing CO2 (and becoming less alkaline).
The situation at the end of an ice age is different - the changing distribution of sun energy (milankovitch cycles) result in summer melt in high northern latitudes reducing the albedo (and thus the amount of sunlight reflected directly back to space from ice). The warming releases GHG by the various mechamisms and as a result whole planet warms.
As this is your first post, Skeptical Science respectfully reminds you to please follow our comments policy. Thank You!
Has there been a gradual rise in atmospheric C0s during the last 10 millenia followed by a spike following the industrial revolution? Does the gradual rise correlate with human agiculture and pastoralism? Does the spike correlate with conversion of North American grasslands to agriculture and pastoralism with the aid of machinery powered by fossil fuels? This makes sense to me because grassland soils contain more carbon than soils of forestland or brushland.
Hal Kantrud,
Atmospheric CO2 levels reached about 265 ppm about 11,000 years ago, near the end of the last glacial phase and the start of the current Holocene interglacial. From then until just before preindustrial (1850), CO2 levels slowly increased to about 280 ppm, an increase of 15 or so ppm.
(bigger image here)
What this doesn't take into account is that human activities starting around the development of agriculture until preindustrial times added about 25 ppm to those atmospheric levels. This implies that, without the human impacts, atmospheric CO2 levels would have naturally dropped by some 10 ppm over the same interval.
In more depth, human activities have been modifying the climate system for far longer than most people realize. Evidence exists that humans have been doing so since the development of agriculture more than 10,000 years ago, contributing as much as 25 ppm to existing, preindustrial atmospheric CO2 levels. During periods of previous pandemics, reforestation of formerly cultivated lands have drawn down atmospheric carbon dioxide levels enough to measurably lower global temperatures.
"Scientists understand that the so-called Little Ice Age was caused by several factors - a drop in atmospheric carbon dioxide levels, a series of large volcanic eruptions, changes in land use and a temporary decline in solar activity.
This new study demonstrates that the drop in CO₂ is itself partly due the settlement of the Americas and resulting collapse of the indigenous population, allowing regrowth of natural vegetation. It demonstrates that human activities affected the climate well before the industrial revolution began."
Link1
Link2
Link3
Link4
Link5
Link6
Link7
Link8
Link9
Link10
Link11
Link12
"n more depth, human activities have been modifying the climate system for far longer than most people realize. Evidence exists that humans have been doing so since the development of agriculture more than 10,000 years ago, contributing as much as 25 ppm to existing, preindustrial atmospheric CO2 levels.'"
But even from the Antarctic ice data it looks like a gradual rise began about 7000 years ago. This could correlate with the increased use of the high-carbon content grassland soils for cultivation of annual crops such as small grains and also for pasturage.
"During periods of previous pandemics, reforestation of formerly cultivated lands have drawn down atmospheric carbon dioxide levels enough to measurably lower global temperatures."
I see no dips in atmospheric CO2 following any of the world's worst pandemics. "Reforestation" probably means abandonment of cropland where forests once stood, where weeds and annual grasses quickly become dominant. So this perhaps accounts for the lack of dips. I doubt if large scale abandonment of cropland occurred in fire-derived ecosystems like grasslands where forests did not originally exist as these areas would be the first to be returned to agiculture or for domestic livestock by the survivors. Unlike grasslands, forests are shallow rooted and store little carbon, other nutrients, or water underground, so I would think long-term effects of reforestation on atmospheric CO2 would be quite low.
"Scientists understand that the so-called Little Ice Age was caused by several factors - a drop in atmospheric carbon dioxide levels, a series of large volcanic eruptions, changes in land use and a temporary decline in solar activity."
Thought I read where regular changes in Earth's axis of rotation ("wobble") may also be involved here.
"This new study demonstrates that the drop in CO₂ is itself partly due the settlement of the Americas and resulting collapse of the indigenous population, allowing regrowth of natural vegetation."
Whew! Now you are saying that Amerindians had more land under cultivation and overgrazed more acreage than European man?
"it demonstrates that human activities affected the climate well before the industrial revolution began."
I agree with that, but believe the recent upward blip was caused as much by convesion of New World grasslands to cropland as it was by the industrial hydrocarbons used to accompish that task.
Hal Kantrud, you wrote that you thinks you read that changes in Earth's axis of rotation may be involved in the Little Ice Age. You might well have read that, because misunderstanding is widespread. But the "Little Ice Age" was not actually an ice age. Indeed, what popularly are called "ice ages" actually are glacial periods nested within actual "ice ages." Within each actual ice age there is a series of glacial periods and "interglacial periods." Currently we are in an interglacial period within an ice age. The Little Ice age in fact was merely a short period of regional cooling within the current interglacial period. See this relevant post--first the Basic, then the Intermediate, and finally the Advanced tabbed pane.
"Wobbles" in the Earth's axis are so slow that they operate on the time scale of triggering the glacial and interglacial periods. See this post about Milankovich cycles.
Thanks. So if the "wobble" that triggered the Pleistocene glaciation, and less extensive glaciations occur during the interglacial, I guess the proper name would be Interglacial Subglaciations. These must be what misinformed laypersons like myself have termed "Little Ice Ages". How many have there been during the last 12,000 years and could they have dampened atmospheric CO2 levels? Did the extent of polar ice increase during these lesser glaciations?
Hal Kantrud: The "Little Ice Age" (LIA) was not a glaciation in any sense. It was a brief period within which some particular regions got colder for a little while before getting warmer again, but not all of them at the same time. From the PAGES 2K study:
Hal Kantrud, the planetary "wobbles" are much too slow to cause any brief effect such as the Little Ice Age [LIA].
Have a look at the PAGES 2K study.
Many people hear the name "Little Ice Age" ~ and combine it in their mind with old illustrations of Dickensian snow and London "Ice Fairs" on the frozen Thames, and suchlike Christmassy freezes.
But in reality, the LIA was very minor. Less than 0.5 degreesC colder than the usual background for the Northern Hemisphere, and more like 0.3 degreesC cooler for the global whole.
Even the Medieval Warm Period [MWP] was only around 0.3 degreesC warmer than the global historic background. Despite some of the trumpet-blowing about the MWP and the LIA, they were both pretty minor events overall. Their names do greatly exaggerate their size. And they are insignificant compared with the level of warmth of the Holocene Maximum (about 8000 years ago) and the even higher temperature levels of recent decades (which are around 0.5 degreesC hotter than the Holocene Maximum).
Eclectic @834,
Do be aware that London's frozen River Thames was a very rare event and if anything provides evidence against the Little Ice Age being something exceptional with reported freeze-ups occurring even during the Medieval Warm Period. There were perhaps only a half dozen Frost Fairs listed in the records and they stopped appearing, not because of warmer winters but because the old London Bridge was demolished and the river embanked.
Given such reasons for the absence of Frost Fairs since 1813, perhaps a better river to look for evidence of a Little Ice Age (or lack ofevidence) is the Rhine which is recorded freezing 14 times since 1784, the last time in 1963. Of those 14 freezes, most occurred well after any Little Ice Age with seven during the 20th century.
I didn't say the 'wobbles' caused any LIA's. But the evidence seems to show "wobbles" are assoicated with Ice Ages. What threw me off was your statement that LIA's were glacial periods, hence my question about possible evidence of expanding ice caps during these periods.
It is interesting that the Holocene Macimum occurred about the same time as the dawn of agriculture and pastoralism, concentrated on the carbon- and nutrient-rich grasslands of the Old World. So perhaps the slow atmospheric CO2 buildup shown by the ice core studies could have been caused by such 'mining' of grassland soils, followed by the spike in CO2 during the Industrial Revolution as the grasslands of the New World suffered the same fate, aided by mechanical power rather than the draft animals of old?
Hal Kantrud, you wrote "What threw me off was your statement that LIA's were glacial periods." Who stated that, where?
"I see no dips in atmospheric CO2 following any of the world's worst pandemics"
Others disagree. See Ruddman and Carmichael 2006, vanHoof et al 2006.
Whether such short term effects like pandemics last long enough to affect climate is more debatable (Pongratz et al 2011)
Tom on the 19th. "Within each actual ice age there is a series of glacial periods and interglacial periods" Guess I took that to mean an ice age extends from one peak glaciation to the next. Perhaps you were referring to the 'surges' in glaciers during the peaks.
Hal Kantrud, by definition an ice age is any period with continental-scale ice sheets on land (like now). Within an ice age are warmer periods called interglacials and colder periods, called glacial periods (or glacial phases). The Little Ice Age nor any cool episode in the past 13,000 years do not rise to the standard of a glacial phase.
(bigger image here)
As can be seen below, glacial and interglacial periods are self-evident:
(bigger image here)
When it comes to the modern warming forcing from human activities, it's already comparable to the warming which lifted the world out of the last glacial maximum 24,000 years ago to the height of the Holocene Climate Optimum 8,000 years ago:
"About 2.3W/m2 (from CO2), a few tenths more from CH4 and N2O.
Anthropogenic GHG forcing is ~2 W/m2 (CO2) and ~0.5 W/m2 from CH4+N2O+CFCs.
So they are comparable - ice sheets were a bigger term in the deglaciation tho."
(source)
Humans are inducing a phase transition from an interglacial world to a no-glacial world. So we are ending the ice age itself.
MA Rodger @835,
Thanks. Yes, I had heard that the "frozen Thames" events had occurred even during the Medieval Warm Period (though those are never mentioned by Denialists).
I was interested in the "meme" of Thames freezings being held up as an example of the world-chilling severity of the Little Ice Age. And as I was saying to Hal Kantrud (who seems just starting out on learning about climate science) . . . the main point to remember is that the LIA and the MWP were pretty small beer compared with earlier climate changes.
As you yourself know very well, the LIA is greatly misrepresented by the climate-science Deniers :-
(a) Firstly, they exaggerate its severity ;
(b) Secondly, they falsely claim that our modern rapid warming is (somehow) "just a rebound from the LIA" .
(c) Thirdly - with amusingly unintended irony - they claim that the huge temperature excursions of MWP & LIA make the modern warming look insignificant . . . and yet at the same time they claim that the planet's Climate Sensitivity is so very low that we need not be concerned about the "slight" warming effect of anthropogenic CO2 emissions. Superb!
MA Rodger, you might not have seen it . . . but on one of the Denialist blogs recently, a particular Denier asserted that (by his calculation) Earth's Equilibrium Climate Sensitivity was around 0.4 degreesC. Improving on that, he then (based on the negligibly-small rise in CO2 which he attributed to humans) calculated that, of the modern warming, only 0.02 degreesC was human-caused. To repeat: 0.02 degreesC. Not a misprint. (Ah, who needs to pursue comedy, when so much is freely available on the Denier blogs! )
Thanks. So we are in a period of the current Ice Age where continent-size ice sheets cover land at the poles. While waiting for the next Ice Age, we experience cooling periods, (phases) but these are too small to significantly increase the size of the continental ice sheets. Does this imply that the warming periods or phases will not significantly reduce the size of the ice sheets?
Am I correct in reading the graphs that during the Holocene, Earth reached peak temperatures about 8000 YBP and has since cooled down to temperatures reached about 13,000 YBP, but during the last 200 years has spiked to levels far above those observed during the Holocene peak?
Can I also say that atmospheric CO2 levels followed an opposite pattern, slowly increasing during the last 8000 years, only to spike upwards during the last 200 years to unprecedented highs?
My main question concerns the latter. What portion of the recent spike in CO2 can be attricuted to the conversion of New World grasslands to agriculture and pasturage and what portion can be attriubted to the increased use of hydrocarbons worldwide?
Hal Kantrud @842,
To address your three requested points of clarification/confirmation.
(1) The only actual continent-sized ice sheet is Antarctica and that remains unaltered in size through an interglacial and through a glacial maimum. The glacial maximum see the growth of ice sheets across the northern half of N America, Greenland and N Europe. The Greenland ice sheet has survived the present interglacial but was melted out in the previous one.
The impact of small wobbles in global temperature is not significant within this process as the temperature change is small and it doesn't last very long. The ice melt is a slow process. Thus, while global temperatures stopped rising 10,000 years ago, the melt continued strongly for a further 2,500 years and less strongly for another 4,000 years, this shown by the sea level record.
(2) Your timings are a little off. After the Holocene peak temperture (best considered as a plateau 10,000y to 6,000y bp), global temperature has been dropping but only to the equivalent of 11,000y bp. 13,000y bp would have you back in the Younger Dryas event when it was very cold.
(3) The CO2 record from ice cores does show previous interglacials with CO2 (& CH4) levels falling quickly from the peak of the interglacial. This is not the case for the present interglacial when CO2 (& CH4) levels are shown to rise not fall. This has led to some interesting work setting out the idea that the activities of mankind are responsible for this early rise, for CO2 perhaps dating back to 8,000y bp (& 5,000y bp for CH4).
While this work remains speculative, the CO2 (& CH4) levels through this interglacial would act to slow the drop back into a glacial maximum.
The unprecedented CO2 levels likely now top the CO2 levels seen 3 million years ago (this was back when N America was joined S America at Panama and initiated the Arctic ice) and are thus uprecedented in 13 million years, thus back to a time when weathering of the newly-formed Himalayas caused reducing CO2 levels.
....
And addressing your main question which concerns the CO2 levels of the last few centuries rather than those of the late stone age because any increase pre-industrial cannot be the result of fossil fuel use.
According to the Global Carbon Project, the anthropogenic CO2 emissions since pre-industrial amount to some 650Gt(C) of which 450Gt(C) results from fossil fuel use and 200 Gt(C) due to Land Use Change, but note this is mainly cutting trees down not "the conversion of New World grasslands".
Hal Kantrud , I would like to add a few disparate points which may be of interest to you. (And you may already have come across some of them.) As always, I shall be grateful if MA Rodger (who is extremely well-informed on climate matters) sees fit to make any corrective comment!
1. The term "BP" / bp stands for Before Present, but does not mean "up until right now this year of [2020]". BP is a convention used by the paleo scientists to standardize the reference to past ages - whether centuries, millennia or mega-years [ma]. BP at point zero is taken as year 1950.AD
Some "contrarians" have not been aware of this convention (for instance the slightly-contrarian scientist Loehle has had to go back and correct some of his work, because he was initially unaware of the paleo convention).
Hal, this paleo convention is enormously important, since there has been a huge rise in global surface temperature since 1950. Even today, some Denialist blogsites are publishing graphs which misrepresent reality, and are showing a graph's final temperature as 2000.AD or 2010.AD . . . when the original graph only went up to 1950.AD . . . and worse, the denialists have sometimes doctored or airbrushed-out the most modern temperatures. Sometimes this deliberate deception is outright concealed - and sometimes the deception is camouflaged under the term "Adapted from [a certain scientific paper]" .
Another small point is that some of the ice-core temperatures are recorded up until around 1855.AD , since later/shallower levels of ice are unrepresentative of their ambient conditions.
[You will have noticed how almost all science-deniers are still falsely (and vehemently) asserting that both the Holocene Maximum and the MWP were hotter than 2000.AD and current years.]
2. The Holocene Optimum [sometimes called Holocene Maximum] was roughly 8000 years ago, but as MA Rodger rightly points out, the Maximum was more of a plateau of roughly 5 millennia. Over the succeeding 4 or 5 thousand years, the temperature has dropped roughly 0.7 degreesC as part of the background cooling which would eventually lead into the next glaciation. But AGW has intervened - with global temperature rising like a rocket in the past 100-200 years (dare I say like the end of a Hockey Stick?) Hockey Stick is yet another term which causes Denialists to choke on their cornflakes.
As a consequence of the natural cooling down from the Holocene Maximum, the global sea level has reduced by about 1 or 2 meters . . . and that fall should have continued onwards as we slide into the next glaciation. Except for the modern AGW-caused rise in sea level, a rise which is slow but accelerating.
3. Each glaciation cycle of the past 800,000 has been subtly different, owing to differences in the variations of the Milankovitch cyclings. That makes it difficult to predict when the next glaciation would have occurred in the absence of human influence. One figure I recall seeing, is the next chilly glaciation being due in roughly 16,000 years. So we humans have plenty of time to fine-tune our climatic effects before any threat of severe glaciation! (Some denialists maintain that the "New Ice Age" was due in a few centuries from now . . . and our anthropogenic CO2 has fortuitously been raised only in the nick of time... )
4. I won't comment on your point of interest about the New World grasslands. The changes there would be quite minor in the overall picture.
Thanks. To narrow down, the graphs show temperatures dropped during the last 6 millenia, while sea levels rose about 2m. One would think sea levels would rise, so is there a time lag working here?
CO2 increased during this period till the recent spike. There is no data on NH4 and SO2, but I thought this mix tended to prevent reflection of the sun's rays and thus increase temperatures.
I am not convinced that 'cutting trees' in the New World was as important a source of human CO2 emissions as the switch of grasslands from the production of perennial grasses to annual crop plants and domestic animals. Forest soils are notoriously poor in carbon and most is sequestered in the trees themselves, whereas perennial grasslands sequester most carbon deep underground while evolving in cycles of frequent fire and intense herbivory. Soils dominated by grasses have always been the first to be heavily exploited for food production ("the land of milk and honey") and were where our staple foods such as wheat, rice, barley, etc., were domesticated. So to seriously tackle the problem of high CO2 levels, it would be more efficient to seed perennial grasses, whose root systems remain the only viable net CO2 sink. Trouble is those areas are the source of most of our food!
Hal Kantrud @845 , your first paragraph is crossed-up.
As the planet cools 0.7 degreesC during the past 5-ish millennia, more land ice forms, and so the sea-level falls. MA Rodger's graph (above) is a broadbrush illustration of sea-level, yet data fuzziness does not illustrate the small fall (roughly in the region of 1 maybe 2 meters in the past few thousand years).
As far as I have gathered, the broad scientific opinion favors a return to atmospheric CO2 level around 350 ppm. Incorporating carbon into deeper soil is a worth goal, but probably will be too slow (and limited) to achieve a negation of all the recent & continuing fossil fuel usage.
Eclectic @844,
I'm not sure where you get the metre drop in late Holocene sea levels. There have been dropping sea levels in some locations through the late Holocene but that is due to isostatic rebound caused by the redistribiution of mass - melted ice sheet flowing into tropical seas. The accepted wisdom as I understand it is still as per IPCC AR5 Ch5 5.6:-
Hal Kantrud @845,
There is certainly a timelag between temperature rise and ice loss and with big ice sheets the lag can also be big (but not necessarily). The current level of AGW is put at 1ºC and the sea level rise so far at 20 or 30 cms. Yet the anticipated sea level rise per 1ºC AGW is put at 230cm over a period of a couple of millenia. But additional to that 230cm/1ºC is Greenland which maintains its ice sheet solely becuse its summit is high up surrounded by cold atmosphere. It is anticipated that somewhere between 1ºC and 2ºC of AGW, the summit of Greenland's ice will drop into an unstoppable melt-out as the summit decends into warmer atmospheres, this adding a further 600cm to sea level over perhaps ten millenia. I say "unstoppable" in that it would require a return to ice age conditions to stop the melt and build the summit back up into colder airs.
Regarding the chopping down of woodland, this is globally not New World.
MA Rodger @847 ,
thanks for that information. Re late Holocene MSL decline, I must confess I was relying on memory of seeing (several years ago) a graph of the Holocene highstand declining by 1-2m during the most recent 4-5000 years, as the global temperature reduced by around 0.7 degreesC. As you say, I might have been rather faultily recollecting something which lacked land "rebound" compensation.
On the other hand ~ a quick googling turns up SE Lewis et al. (2008) showing an eastern Australian fall in MSL of 1-1.5m over the period 7000-2000 BP. Eastern Australia (excluding Tasmania) had very little burden of ice sheet at the last glacial maximum (to rebound from) . . . and Australia has been tectonically relatively stable, as well ~ so it is a useful basis for Holocene MSL trends.
I think I may be misunderstanding your IPCC reference where: "Ocean volume between about 7 ka and 3 ka is likely to have increased by an equivalent sea level rise of 2 to 3 m." If the lagging effect of Holocene warming produced a likely 2-3m MSL rise over the period about 7000-3000 BP . . . is that inconsistent with a 1-1.5m MSL fall in the last 3000 years? [Assuming some fuzziness/uncertainty in the Lewis et al. dating]
As a matter of interest, I did a quick back-of-envelope calculation: indicating that for a 1m fall in MSL, the depth of ice on Greenland/Antarctica would need to increase by about 30m. This ignores oceanic thermal contraction and glacier expansion in non-polar regions.
Eclectic @849,
In the past, I do recall SLR free of significant tectonic movement being claimed as a good indicator of global SLR and that it usually concerns Australian data but I'm not sure such claims usually attach to late Holocene SLR. Lewis et al (2008) and indeed Lewis et al (2013) and Lewis et al (2015) are concerned with the late Holocene and more so the Australian record than establishing a global record. And their findings are not so clear cut although a significant drop in sea level post-7,500y bp has been established. The 2013 paper concludes:-
The work to unravel the late Holocene global SLR record is far from complete and I see no evidence of the Australia (Oceania) data providing a short-cut to providing a conclusion. Thus, the conclusion from, for instance, Khan et al (2015):-
And on the reasons:-