


 Arguments


What does past climate change tell us about global warming?
What the science says...
| Select a level... |
 Basic
Basic
|
 Intermediate
| |||
|
Greenhouse gasses, principally CO2, have controlled most ancient climate changes. This time around humans are the cause, mainly by our CO2 emissions. |
|||||
Climate Myth...
Climate's changed before
Climate is always changing. We have had ice ages and warmer periods when alligators were found in Spitzbergen. Ice ages have occurred in a hundred thousand year cycle for the last 700 thousand years, and there have been previous periods that appear to have been warmer than the present despite CO2 levels being lower than they are now. More recently, we have had the medieval warm period and the little ice age. (Richard Lindzen)
At a glance
Just imagine for a moment. You fancy having a picnic tomorrow, or you're a farmer needing a dry day to harvest a ripe crop. So naturally, you tune in for a weather-forecast. But what you get is:
“Here is the weather forecast. There will be weather today and tomorrow. Good morning.”
That's a fat lot of use, isn't it? The same applies to, “the climate's changed before”. It's a useless statement. Why? Because it omits details. It doesn't tell you what happened.
Climate has indeed changed in the past with various impacts depending on the speed and type of that change. Such results have included everything from slow changes to ecosystems over millions of years - through to sudden mass-extinctions. Rapid climate change, of the type we're causing through our enormous carbon dioxide emissions, falls into the very dangerous camp. That's because the faster the change, the harder it is for nature to cope. We are part of nature so if it goes down, it takes us with it.
So anyone who dismissively tells you, “the climate has always changed”, either does not know what they are talking about or they are deliberately trying to mislead you.
Please use this form to provide feedback about this new "At a glance" section. Read a more technical version below or dig deeper via the tabs above!
Further Details
Past changes in climate, for which hard evidence is preserved throughout the geological record, have had a number of drivers usually acting in combination. Plate tectonics and volcanism, perturbations in Earth's slow carbon cycle and cyclic changes in Earth's orbit have all played their part. The orbital changes, described by the Milankovitch Cycles, are sufficient to initiate the flips from glacials (when ice-sheets spread over much of Northern Europe and the North American continent) to interglacials (conditions like the past few thousand years) and back – but only with assistance from other climate feedbacks.
The key driver that forces the climate from Hothouse to Icehouse and back is instead the slow carbon cycle. The slow carbon cycle can be regarded as Earth's thermostat. It involves the movement of carbon between vast geological reservoirs and Earth's atmosphere. Reservoirs include the fossil fuels (coal/oil/gas) and limestone (made up of calcium carbonate). They can store the carbon safely over tens of millions of years or more. But such storage systems can be disturbed.
Carbon can be released from such geological reservoirs by a variety of processes. If rocks are uplifted to form mountain ranges, erosion occurs and the rocks are broken down. Metamorphism – changes inflicted on rocks due to high temperatures and pressures – causes some minerals to chemically break down. New minerals are formed but the carbon may be released. Plate tectonic movements are also associated with volcanism that releases carbon from deep inside Earth's mantle. Today it is estimated by the U.S. Geological Survey that the world's volcanoes release between 180 and 440 million tonnes of carbon dioxide per year - as opposed to the ~35 billion tonnes we release.
Epic carbon releases in the geological past
An extreme carbon-releasing mechanism can occur when magma invades a sedimentary basin containing extensive deposits of fossil fuels. Fortunately, this is an infrequent phenomenon. But it has nevertheless happened at times, including an episode 250 million years ago at the end of the Permian Period. In what is now known as Siberia, a vast volcanic plumbing-system became established, within a large sedimentary basin. Strata spanning hundreds of millions of years filled that basin, including many large coal, oil, gas and salt deposits. The copious rising magma encountered these deposits and quite literally cooked them (fig. 1).
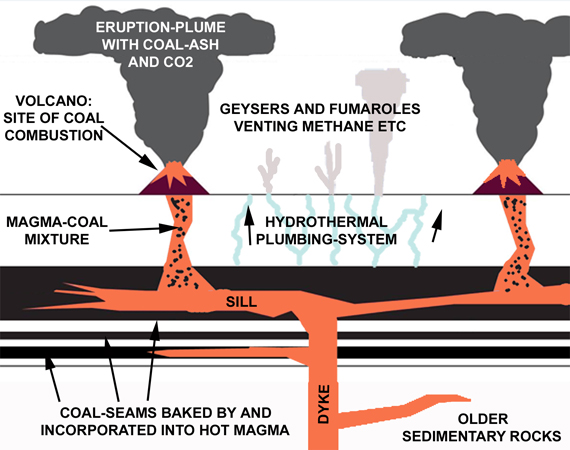
Fig. 1: schematic cross section though just a part of the Siberian Traps Large Igneous Province, showing what science has determined was going on back then, at the end of the Permian Period.
Now laden with a heavy payload of gases, boiled out of the fossil fuel deposits, some of the magma carried on up to the surface to be erupted on a massive scale. The eruptions – volcanism on a scale Mankind has never witnessed - produced lavas that cover an area hundreds of kilometres across. Known as the Siberian Traps, because of the distinctive stepped landforms produced by the multiple flows, it has been calculated that the eruptions produced at least three million cubic kilometres of volcanic products. Just for a moment think of Mount St Helens and its cataclysmic May 1980 eruption, captured on film. How many cubic kilometres with that one? Less than ten.
Recently, geologists working in this part of Siberia have found and documented numerous masses of part-combusted coal entrapped in the lavas (Elkins-Tanton et al. 2020; fig. 2). In the same district are abundant mineral deposits formed in large pipes of shattered rock as the boiling waters and gases were driven upwards by the heat from the magma.
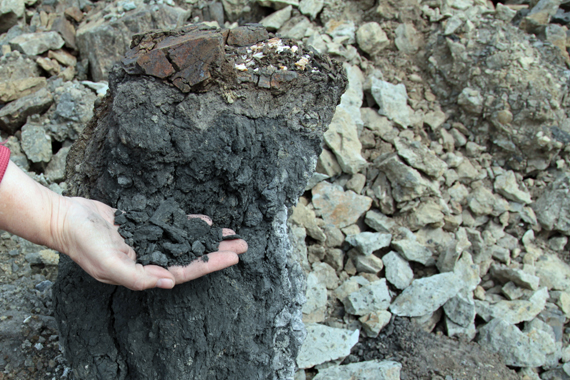
Fig. 2: an end-Permian smoking gun? One of countless masses of part-combusted coal enclosed by basalt of the Siberian Traps. Photo: Scott Simper, courtesy of Lindy Elkins-Tanton.
It has been calculated that as a consequence of the Siberian Traps eruptions, between ten trillion and one hundred trillion tons of carbon dioxide were released to the atmosphere over just a few tens of thousands of years. The estimated CO2 emission-rate ranges between 500 and 5000 billion tonnes per century. Pollution from the Siberian Traps eruptions caused rapid global warming and the greatest mass-extinction in the fossil record (Burgess et al, 2017). There are multiple lines of hard geological evidence to support that statement.
We simply break into those ancient carbon reservoirs via opencast or underground mines and oil/gas wells. Through such infrastructure, the ancient carbon is extracted and burned. At what rate? Our current carbon dioxide emissions are not dissimilar to the estimated range for the Siberian Traps eruptions, at more than 3,000 billion tons per century. The warning could not be more clear. Those telling you the climate's changed before are omitting the critical bit – the details. And when you look at the details, it's not always a pretty sight.
Last updated on 14 February 2023 by John Mason. View Archives


MA Rodger @850 ,
sorry, but your diagram [relative sea level map] is not loading for me. (And yes, Nigelj, I have tried 3 computers!! ) I will take a stab, and presume the diagram is from Peltier (2002) .
If I understand you correctly, then relative sea level (disregarding the "short term" alterations from thermal volume effect and total mass change) during the Holocene interglacial . . . ought to receive a major influence from isostatic rebound of subpolar land regions, as well as from the more general land "rebound" secondary to oceanic siphoning. And both of these rebounds should produce a late-Holocene fall in relative sea level (i.e. measured at shore-lines). Perhaps excepting special cases like southern Britain.
To all of which, we can add in some extra fall secondary to late-Holocene cooling that reduced ocean temperatures and also deposited more ice on land ~ an amount of ice presumably rather less than the 30-meter deposit I mentioned in last paragraph of #849 . . . (a deposit too marginal to really decrease the land rebound).
I guess the whole question comes back to the nett result on "Mean Sea Level", from all these various factors. In view of all the difficulties in local measurement of millennial changes, I am not surprised by the scatter of results from different studies on this topic.
Almost - but not quite - it is enough to feel some sympathy for that remarkable outlier, the (recently) late Dr Moerner.
Correction :- not Peltier (2002) , but Khan et al. (2015) as per link in #850
Eclectic:
A direct link to MA Rodger's figure is:
https://media.springernature.com/lw685/springer-static/image/art%3A10.1007%2Fs40641-015-0029-z/MediaObjects/40641_2015_29_Fig1_HTML.gif?as=webp
I notice that it is formatted to display is as a webp object, which might be breaking things for you if that format is not supported in your browser. It seems to be a Google format. YOu might try dropping the "as=webp" part.
As for isostatic rebound: keep in mind that it is a local effect. The crust is depressed where ice weighs on it, and rebounds when ice is removed. Areas around the ice do the opposite - they flex upwards when the ice pushes downwards, and move back down when the ice is removed. Think of what happens when someone places an object on a waterbed.
Interpreting sea level changes due to glaciation is rather complex, and evidence is difficult to find.
A long time ago someone at SkS suggested that sea level in the Pacific ocean peaked about 3-5,000 years ago and then went down about 1.5-2 meters. This explained how atolls formed and why they have coral rock above current sea level.
I do not see this change in MARodgers graph at post 843 but it seems consistant with his post at 850. Is sea level change the current understanding of how atolls came to be above current sea level? (Most atolls in the Pacific have 1-2 meters of coral stone at their core which cannot form above sea level. Sea level could have changed more than that.)
Michael - see here perhaps. This is hydro-isotasy at work as opposed to rebound from weight of ice. Extra weight of water from ice melt deepening the ocean basins, dropping sea level slowly.
It looks like MA Rodgers image in comment 850 does work if you drop the as=webp part of the URL:
Eclectic thanks for pointing that out. I just noted what looked like quite a marked temperature drop during the last 6000 years pre-spike was accompanied by at least a fairly steady rise in ocean levels. So the sea level data is questionable.
Since the Antarctic ice has stayed relatively stable, it looks like the temperature drop and recent rise has has so far involved only the smaller (less than continent-size) ice sheets. This would be expected if the smaller sheets were thinner, partly above the sea, and assisted by human agriculture, deforestation, and industrialization, as these occurred almost exclucively in the N. Hemisphere because of greenhouse gas emissions. Is an estimate of the proportion of these gasses attributed to the three human activities available? I know even a rough estimate would be extremely complicated because plants use CO2 and N, as well as sequester them, plus we might know little about the extent of hydrocarbon extraction during the last 200 years, forest utilization, etc., but I bet it could be done.
I have read that the entire subarctic zone continues to lift upwards after the glacial ice maximum and subsequent melt. Are there studies showing the contrubution of each to ocean depths?
Hal Kantrud @857 , the wording of your second sentence is awkward, since it seems to suggest a steady rise in ocean levels during our most recent millennia. Surely that was not what you meant to say. As expected, the very modern temperature spike has led to a sea level rise.
Yet the 4-5000 previous years have been cooling ( roughly 0.7 degreesC) and, as you would expect from basic physics : more cooling overall means more land ice mass and therefore less ocean mass. Does less ocean mass necessarily mean lower sea level globally? MA Rodger's post #843 shows an almost flatline sea level for the last 2000 years . . . but as you have seen discussed, there are many factors & difficulties of measurement ~ so the illustrated "flatline" should be viewed as a rough approximation (and we get into comparing different criteria and even definitions of exactly what is meant by "global Mean Sea Level" and Relative Sea Level). However, that's all "past history" ~ and the problem we now have to tackle is the current & future sea level rise and associated CO2 problems.
Bob Loblaw @856 , thank you for that almost psychedelic picture of the world. I see that it is a model output, so I shouldn't look for granular detail along the coasts!
Scaddenp:
Thanks for the reference. Exactly what I wanted to know. As expected, scientists have figured out a complex evolution of mountains in the ocean.
Eclectic I just drew a horizontal in my eye from 6000 YBP on Rodgers graph to 0 and it looked like about a 2m rise in sea level. I ignored the more recent plateau.
Is it accepted by most Earth scientists now that the recent spike in greenhouse gasses is the primary cause of the rise in sea levels, rather than land rebound or other factors?
Hal Kantrud @860 , yes indeed what are we to make of all this !?!?
On that graph, my eye-crometer shows a MSL uptick of 1m from 3000 BP to 2000 BP, and then zero change 2000 BP to 0 BP (1950.AD).
I don't know the provenance of the graph - I gather it is displayed on Wikipedia, but I haven't looked to see where Wiki got it from.
How useful is that thick black line? You will note how the black line shows no rise in the final century, even though there has been a small measured rise 1850-1950.AD . . . so the line is "thick" . . . and the strange (i.e. unnatural) angulations over past millennia must be the result of some author "hand-drawing" an approximate fit. A fit to those many multicolored points scattered near the black line.
Look at the multicolored data points. Jamaica / Tahiti / Indonesia / Australia / New Guinea / Rio , and so on. A great scattering, and showing much vertical spread too. In other words, the black line is a rough approximation ~ and I advise not getting out your magnifying glass in order to fish for precise detail.
We know that there has been a huge ( over 100m ) MSL rise from the depths of the glacial 20,000 years ago until the Holocene Optimum [strange name!]. Search, and you will find different studies/graphs from different parts of the world - and depending on the local level of land uplift etcetera, you will find at least some indicating a small fall of sea level in the last few thousand years . . . a fall which you would expect as a result of the 0.7 degreesC cooling [0.7 is a rough figure too, but fairly well established].
Nevertheless, there are post-glacial local rebounds and ocean-floor depressions ["siphoning"] to be considered with every site measured. Basically, for practical purposes, I wouldn't be too fussed about it all. Simply stand back and look at the bigger picture.
Hal Kantrud @860 (continued)
The rise in sea level during the past 150 years or so is the result of oceanic "swelling" - roughly half from thermal expansion and half from increased mass (the contribution from melting of land ice). Land rebound is too small to make much difference over 150 years. Likewise the "oceanic siphoning" as the ocean floor slowly sags a bit, under the increased weight of total ocean.
In short, it's a matter of the observed global warming. If you are questioning the connection between the recent spike in Greenhouse Gasses [ GHG's ] and the recent spike in global warming . . . then you've come to the right place, here at SkS website. Loads of info available via the Home Page.
For more detail on "sea-level" budget (the various contributors and estimating their impact), try this paper from Church et al 2011. There may be more recent updates
Eclectic @861,
"That graph" of Holocene SLR you reference (referenced also @860 & pasted in-thread @843) is a bold piece of work found within Wikipedia and is based on the following:-
I say 'bold' as combining the messy Holocene SLR data into a simple grand global average is not entirely scientific although it does prove illustrative. The IPCC AR5 does present a graphic (within Fig 5.15) providing the same sort of image surrounded by a blizzard of other graphical SLR data. This IPCC Fig5.15f is essentially Fig 14 from Lambeck et al (2010) 'Palaeoenvironmental records, geophysical modelling and reconstruction of sea-leveltrends and variability on centennial and longer time scales'.
MA Rodger @864 , thanks for that info ~ you are a champion.
The study by Lambeck et al.(2010) was particularly interesting. I apologize for and withdraw my skepticism about the 0 - 2000.BP flatness of the sea level as shown on "your graph".
The lateness of the Holocene highstand seemed (to me) probably explicable by some lag effects of the H. Optimum's warmth. But if I understand it correctly, Lambeck favors a greater Southern Hemisphere effect lingering on and operating by melting some of the West Antarctica ice sheet up until fairly recent times (despite marginally greater NH cooling).
Since we are discussing sea level rise, recent sea level rise is unprecedented over the past 2,500 years (Kopp et al 2016):
Anthropogenic forcing dominates global mean sea-level rise since 1970 (Slangen et al 2016):
"the anthropogenic forcing (primarily a balance between a positive sea-level contribution from GHGs and a partially offsetting component from anthropogenic aerosols) explains only 15 ± 55% of the observations before 1950, but increases to become the dominant contribution to sea-level rise after 1970 (69 ± 31%), reaching 72 ± 39% in 2000 (37 ± 38% over the period 1900–2005)"
Causes of sea level rise since 1900, from NASA and Frederikse et al 2020:
Takeaways:
1. Glacier-dominated cryospheric mass loss has caused twice as much sea-level rise as thermal expansion since 1900
2. The acceleration since the 1970s is caused by the combination of thermal expansion and increased Greenland mass loss
3. Ocean mass increases from land-based ice losses dominated the early 20th and 21st Century sea level rise record; ocean heating was the dominant component from 1970-2000
4. The closure of the 20th-century sea-level budget derived here implies that no additional unknown processes, such as large-scale deep ocean thermal expansion or additional mass loss from the Antarctic Ice Sheet are required to explain the observed changes of global sea level
Additionally, new research (Miller et al 2020) affirms modern sea level rise is linked to human activities, and not to changes in Earth’s orbit:
LINK
From the source paper, Miller et al 2020:
Miller 2020, Figure 4, rotated once:
And the past 40,000 years, from Miller 2020, Figure 4 above:
Daniel baily:
From your second link:
"Our records that suggest nearly ice-free conditions occurred during the MCO and are thus intriguing if this is an equilibrium state for warming levels that will be attained in this century or the next century under sustained greenhouse gas emissions."
Ice free conditions means sea level 60-65 meters higher than current!! Then the question is how long will it take for all that ice to melt. At a foot a decade it would not be too long before many cities were in troube. I live in Florida (at over 40 feet elevation) and parts of South Florida are already hurting from only 1 foot of sea level rise.
RrealClimate has several good discussions of potential sea level rise. 2013 article 2016 article In general, the IPCC estimates are at the low end of what expert opinion is. This is because of the method the IPCC uses to come to a consensus. The IPCC states what a consensus of experts feel is the lowest range of sea level rise. The average of experts is then higher than the IPCC reports. There is a lot of discussion on melting rates. It seems to me that knowledge of probable melting rates is still being developed.
michael sweet @867,
The quote you cite from #866 is perhaps a little out of context for your purpose as within Miller et al (2015) it is embedded within a discussion of the relationship between sea level, temperature & CO2. With reference to features in its Fig 1, this passage runs:-
The MCO marks the point when global temperatures tipped down towards the Pleistocene era of glaciation/interglacial cycles. Through this time, the layout of the globe has changed enough I think to put into some doubt any direct comparison with the MCO and a +4°C world of today.
@michael sweet
Sea level rise from ice sheets continue to track worst-case (High scenario) climate change scenarios (discussion here, source paper here).
Source
Which, charitably, means 2.0 meters SLR by 2100, given that the Greenland Ice Sheet has tipped into a negative mass balance state, Earth having lost 28 trillion tons of ice in the past 23 years and that Greenland is expected to exceed Holocene loss rates by 2100.
Image Source
Typically, when climate scientists try to understand some of the expected future effects of global warming and climate change, they first look to the past. And in looking to the past, we can use the example of the climate transition from the icy depths of the Last Glacial Maximum into our current Holocene Interglacial to guide us. From about 21,000 years Before Present (BP) to about 11,700 years BP, the Earth warmed about 4 degrees C and the oceans rose (with a slight lag after the onset of the warming) about 85 meters.
However, the sea level response continued to rise another 45 meters, to a total of 130 meters (from its initial level before warming began), reaching its modern level about 3,000 BP.
This means that, even after temperatures reached their maximum and leveled off, the ice sheets continued to melt for another 8,000 years until they reached an equilibrium with temperatures.
Stated another way, the ice sheet response to warming continued for 8,000 years after warming had already leveled off, with the meltwater contribution to global sea levels totaling 45 additional meters of SLR.
Which brings us to our modern era of today: over the past 100 years, global temperatures have risen about 1 degree C…with sea level response to that warming totaling about 150 mm. Recently, accelerations in SLR and in ice sheet mass losses have been detected, which is what you’d expect to happen when the globe warms, based on our understanding of the previous history of the Earth and our understanding of the physics of climate.
Support for above:
https://www.nasa.gov/feature/goddard/2019/study-predicts-more-long-term-sea-level-rise-from-greenland-ice/
https://advances.sciencemag.org/content/5/6/eaav9396
https://climate.nasa.gov/news/2458/why-a-half-degree-temperature-rise-is-a-big-deal/
https://www.nature.com/articles/nclimate2923
https://www.nature.com/articles/ncomms9059
http://www.pnas.org/content/111/43/15296.short
https://www.carbonbrief.org/sea-level-research-says-only-a-brief-window-to-cut-emissions
https://climate.nasa.gov/news/2869/antarcticas-effect-on-sea-level-rise-in-coming-centuries/
https://www.pnas.org/content/110/4/1209
https://science.sciencemag.org/content/364/6444/eaav7908
https://advances.sciencemag.org/content/5/1/eaau3433
https://www.pnas.org/content/116/30/14887
Daniel Bailey and MARodger:
I have not kept up on sea level rise as much as you have the past few years. Your data and posts help me a lot with most recent thinking. I note that every IPCC report they raise their estimates of future rise as more is known.
I remember about 10 years ago I wondered if I would live long enough to see damage from sea level rise (I am currently 62 years old). I now see damage from sunny day flooding recorded in many locations around the globe, including serious damage in my home state of Florida and city of Tampa. I now expect to see many homes in Florida abandoned from sea level rise.
This picture shows sunny day tidal flooding in St. Augustine, Florida this past September.
The Guardian article says that nusance flooding affects 60% of historical locations (the economy is based on historical tourism) and with 1.5 feet (about 45 cm) of additional rise all historical locations will be affected.
How can people live with regular flooding? You would never build a structure in a location that floods once a month. People everywhere refuse to accept the fact that these locations no longer are viable locations to live. Eventually they will have to retreat. Millions of people in Florida live within 1 meter of sea level.
In addition to tidal flooding, the increase in the water table underground makes it much harder to get rain to drain away and causes more flooding when it rains.
It's time the scientists admit they really don't know what they are doing.
[TD] You must be more specific in your comments. Future comments like this one will be deleted without warning.
My favoirite hubris spewing climate denier is at it again.
He was smarting of to a person in Colorado who was discussing the current drought in the Westen half of the US.
[What a coincidence.
The same thing happened in the previous Inter-Glacial Period, and the one before that and the one before that and the other 5 before before that.
Are you foolishly blind enough not to see the pattern?
The West always undergoes a drought during Inter-Glacial Periods.
Tell us why this Inter-Glacial Period should be different.
Ice sheets and glaciers always melt during Inter-Glacial Periods.
Tell us why this Inter-Glacial Period should be different.
Sea levels are normally 4 meters to 14 meters higher than they are now during Inter-Glacial Periods.
Tell us why this Inter-Glacial Period should be different.
Tell us why the sea level should not rise at least another 4 meters like it did in the other 8 previous Inter-Glacial Periods.
Global temperatures in the other 8 previous Inter-Glacial Periods were at least 7°F warmer than present.
Tell us why this Inter-Glacial Period should be different.
Tell us why this Inter-Glacial Period should be a statistical anomaly and be colder with lower sea levels and no melting and no drought.
Can you do that?]
This denier is so hostile and over the top smug and arrogant in his replies it's hard to take them seriously.
Is it accurate that the west always undergoes drough during interglacials?
Also I don't think it's correct that Sea levels are normally 4 meters to 14 meters higher than they are now during Inter-Glacial Periods.
How can this denier make this claim? Global temperatures in the other 8 previous Inter-Glacial Periods were at least 7°F warmer than present.
My response to the above bullets would be that this interglacial is nearning it's end and we should be seeing a global cooling effect, but we are seeing a warming effect due to human activity. Not sure what more I could add to my response to the bulleted statements made by this denier.
TVC15 @873 ~ yes, it's marvellous to observe the shameless rhetorical mendacity of some of these deniers. Hard to say whether they believe their own nonsense, or whether they simply aim to score Debating Club points by playing any arguments (arguments 100% true or 95% false). But .... it is what it is, with these trolls.
I love their dismissive style of argument - "It's stupid to worry about a few extra degrees of warming, when only 4 billion years ago the Earth's surface temperature has been 200 degrees hotter." And so on.
As you know, TVC15, each glacial cycle is somewhat different from each of the others - but what we have to face up to is to deal with modern problems : not the problems of a million years before humankind arrived. So why is he himself running away from facing up to the present situation?
Perhaps your denier friend would be unfazed by having a sea level 3 meters deep in his own house's living room? Or is it only *other* people's houses he is unworried about.
. . . 2
. . . 2
TVC15 , a recent high-resolution sea-shore study [ IIRC - Kulp and Strauss 2019 ] indicates that a 1 meter SLR would displace approx 230 million people from their houses and farmlands. And factoring saline inundation by storm surge, there would be many millions of refugees displaced well before the "average" 1 meter rise is reached. So that's likely to be getting underway before 2100 even though the full 1m rise won't come until after 2100. And doubtless, some of these many refugees will need to settle in the neighbourhood of this denier's great-grandchildren. No social disruption at all !
And for a 2m rise in sea level, you can add a few hundred million more refugees . . . all wanting to go to higher ground . . . like Colorado, or wherever this unworried denier has been living.
Western droughts come and go - and sometimes stay for centuries, judging by the history of the last 2000 years. ( I'm sure your denier friend will tell the farmers and townsfolk, that they simply need to wait patiently, for a few generations or so.)
Note that the PAGES12k proxy studies show that world temperature is currently same or slightly higher than the peak of the Holocene - though many deniers still falsely claim that we are "colder than the Medieval Warm Period". Go figure !