


 Arguments


Sun & climate: moving in opposite directions
What the science says...
| Select a level... |
 Basic
Basic
|
 Intermediate
|
 Advanced
| ||||
|
The sun's energy has decreased since the 1980s but the Earth keeps warming faster than before. |
|||||||
Climate Myth...
It's the sun
"Over the past few hundred years, there has been a steady increase in the numbers of sunspots, at the time when the Earth has been getting warmer. The data suggests solar activity is influencing the global climate causing the world to get warmer." (BBC)
At a glance
Thankfully for us, our Sun is a very average kind of star. That means it behaves stably over billions of years, steadily consuming its hydrogen fuel in the nuclear reaction that produces sunshine.
Solar stability, along with the Greenhouse Effect, combine to give our planet a habitable range of surface temperatures. In contrast, less stable stars can vary a lot in their radiation output. That lack of stability can prevent life, as we know it, from evolving on any planets that might orbit such stars.
That the Sun is a stable type of star is clearly demonstrated by the amount of Solar energy reaching Earth's average orbital position: it varies very little at all. This quantity, called the Total Solar Irradiance, has been measured for around forty years with high accuracy by sensitive instruments aboard satellites. Its average value is 1,362 watts per square metre. Irradiance fluctuates by about a watt either way, depending on where we are within the 11-year long sunspot cycle. That's a variation of no more than 0.15%.
From the early 1970s until today, the Solar radiation reaching the top of Earth's atmosphere has in fact shown a very slight decline. Through that same period, global temperatures have continued to increase. The two data records, incoming Solar energy and global temperature, have diverged. That means they have gone in opposite directions. If incoming Solar energy has decreased while the Earth continues to warm up, the Sun cannot be the control-knob of that warming.
Attempts to blame the sun for the rise in global temperatures have had to involve taking the data but selecting only the time periods that support such an argument. The remaining parts of the information - showing that divergence - have had to be ditched. Proper science study requires that all the available data be considered, not just a part of it. This particular sin is known as “cherry-picking”.
Please use this form to provide feedback about this new "At a glance" section, which was updated on May 27, 2023 to improve its readability. Read a more technical version below or dig deeper via the tabs above!
Further details
Our Sun is an average-sized main sequence star that is steadily using its hydrogen fuel, situated some 150 million kilometres away from Earth. That distance was first determined (with a small error) by a time consuming and complex set of measurements in the late 1700s. It led to the first systemic considerations of Earth's climate by Joseph Fourier in the 1820s. Fourier's number-crunching led him to realise a planet of Earth's size situated that far from the Sun ought to be significantly colder than it was. He was thereby laying the foundation stone for the line of enquiry that led after a few decades to the discovery of what we now call the Greenhouse Effect – and the way that effect changes in intensity as a response to rising or falling levels of the various greenhouse gases.
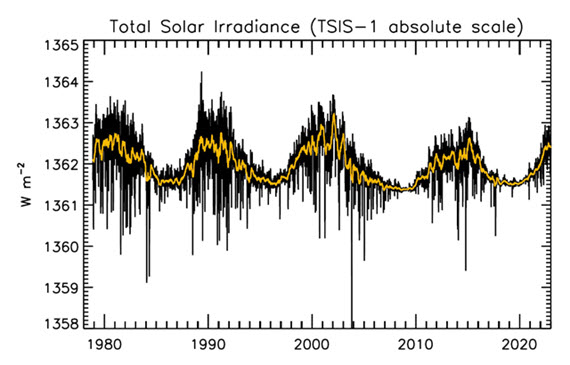
Figure 1: Plot of the observational record (1979-2022) on the scale of the TSIS-1 instrument currently flying on the space station. In this plot, the different records are all cross calibrated to the TSIS-1 absolute scale (e.g., the TSIS1-absolute scale is 0.858 W/m^2 higher than the SORCE absolute scale) so the variability of TSI in this plot is considered to be its “true variability” (within cross calibration uncertainties). Image: Judith Lean.
The Sun has a strong magnetic field, but one that is constantly on the move, to the extent that around every 11 years or so, Solar polarity flips: north becomes south, until another 11 years has passed when it flips back again. These Solar Cycles affect what happens at the surface of the Sun, such as the sunspots caused by those magnetic fields. Each cycle starts at Solar Minimum with very few or no sunspots, then rises mid-cycle towards Solar Maximum, where sunspots are numerous, before falling back towards the end. The total radiation emitted by the Sun – total solar irradiance (TSI) is the technical term – essentially defined as the solar flux at the Earth's orbital radius, fluctuates through this 11-year cycle by up to 0.15% between maximum and minimum.
Such short term and small fluctuations in TSI do not have a strong long term influence on Earth's climate: they are not large enough and as it's a cycle, they essentially cancel one another out. Over the longer term, more sustained changes in TSI over centuries are more important. This is why such information is included, along with other natural and human-driven influences, when running climate models, to ask them, “what if?"
An examination of the past 1150 years found temperatures to have closely matched solar activity for much of that time (Usoskin et al. 2005). But also for much of that time, greenhouse gas concentrations hardly varied at all. This led the study to conclude, "...so that at least this most recent warming episode must have another source."

Figure 2: Annual global temperature change (thin light red) with 11 year moving average of temperature (thick dark red). Temperature from NASA GISS. Annual Total Solar Irradiance (thin light blue) with 11 year moving average of TSI (thick dark blue). TSI from 1880 to 1978 from Krivova et al. 2007. TSI from 1979 to 2015 from the World Radiation Center (see their PMOD index page for data updates). Plots of the most recent solar irradiance can be found at the Laboratory for Atmospheric and Space Physics LISIRD site.
The slight decline in Solar activity after 1975 was picked up through a number of independent measurements, so is definitely real. Over the last 45 years of global warming, Solar activity and global temperature have therefore been steadily diverging. In fact, an analysis of solar trends concluded that the sun has actually contributed a slight cooling influence into the mix that has driven global temperature through recent decades (Lockwood, 2008), but the massive increase in carbon-based greenhouse gases is the main forcing agent at present.
Other studies tend to agree. Foster & Rahmstorf (2011) used multiple linear regression to quantify and remove the effects of the El Niño Southern Oscillation (ENSO) and solar and volcanic activity from the surface and lower troposphere temperature data. They found that from 1979 to 2010, solar activity had a very slight cooling effect of between -0.014 and -0.023°C per decade, depending on the data set. A more recent graphic, from the IPCC AR6, shows these trends to have continued.
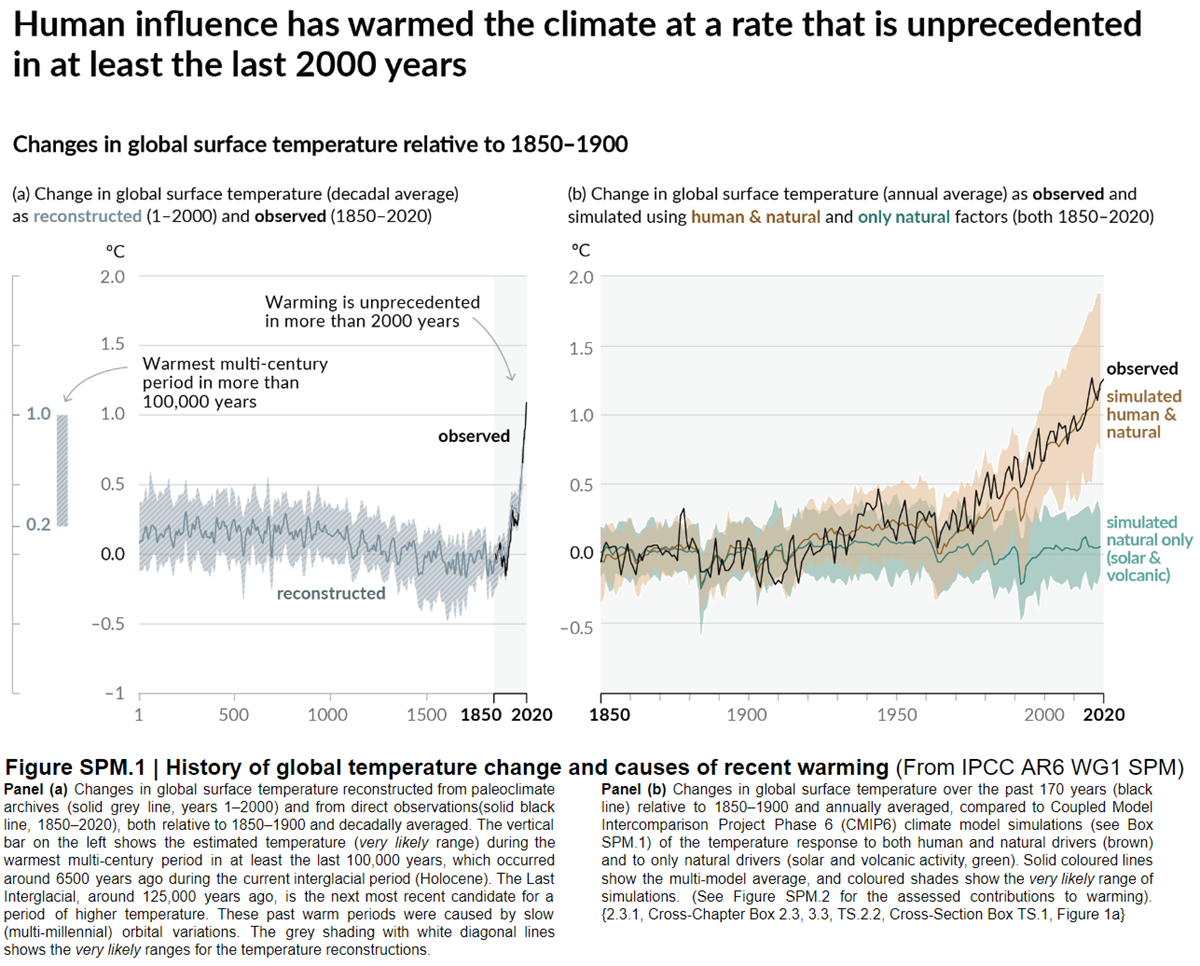
Figure 3: Figure SPM.1 (IPCC AR6 WGI SPM) - History of global temperature change and causes of recent warming panel (b). Changes in global surface temperature over the past 170 years (black line) relative to 1850–1900 and annually averaged, compared to Coupled Model Intercomparison Project Phase 6 (CMIP6) climate model simulations (see Box SPM.1) of the temperature response to both human and natural drivers (brown) and to only natural drivers (solar and volcanic activity, green). For the full image and caption please click here or on the image.
Like Foster & Rahmstorf, Lean & Rind (2008) performed a multiple linear regression on the temperature data, and found that while solar activity can account for about 11% of the global warming from 1889 to 2006, it can only account for 1.6% of the warming from 1955 to 2005, and had a slight cooling effect (-0.004°C per decade) from 1979 to 2005.
Finally, physics does not support the claim that changes in TSI drive current climate change. If that claim had any credence, we would not expect to see the current situation, in which Earth's lower atmosphere is warming strongly whereas the upper atmosphere is cooling. That is exactly the pattern predicted by physics, in our situation where we have overloaded Earth's atmosphere with greenhouse gases. If warming was solely down to the Sun, we would expect the opposite pattern. In fact, the only way to propagate this myth nowadays involves cherry-picking everything prior to 1975 and completely disregarding all the more recent data. That's simply not science.
Longer-term variations in TSI received by Earth
It's also important to mention variations in TSI driven not by Solar energy output but by variations in Earth's orbit, that are of course independent of Solar activity. Such variations, however, take place over very long periods, described by the Milankovitch orbital cycles operating over tens of thousands of years. Those cycles determine the distance between Earth and the Sun at perihelion and aphelion and in addition the tilt the planet's axis of rotation: both affect how much heat-radiation the planet receives at the top of its atmosphere through time. But such fluctuations are nothing like the rapid changes we see in the weather, such as the difference between a sunny day and a cloudy one. The long time-factor ensures that.
Another even more obscure approach used to claim, "it's the sun" was (and probably still is in some quarters) to talk about, "indirect effects". To wit, when studies can't find a sufficiently large direct effect, bring even lesser factors to the fore, such as cosmic rays. Fail.
In conclusion, the recent, post 1975 steep rise in global temperatures are not reflected in TSI changes that have in fact exerted a slight cooling influence. Milankovitch cycles that operate over vastly bigger time-scales simply don't work quickly enough to change climate drastically over a few decades. Instead, the enormous rise in greenhouse gas concentrations over the same period is the primary forcing-agent. The physics predicted what is now being observed.
Last updated on 27 May 2023 by John Mason. View Archives


Just a small extension to MA Rodger's analysis of Dan Pangburn's 'model' @1149. What I did was obtain the sunspot numbers and annual average TSI figures from SORCE for the years 1979-2013 (ie, the satellite record). I calculated the equilibrium temperature response for each sunspot number as:
T(eq) = 286.2*(S(i)/34)^0.25
At that value, S(i) = 34 * (T(i)/286.2)^4, and hence S(i) - 34 * (T(i)/286.2)^4 = 0, ie, there is no temperature change using Pangburn's model.
Using the equilibrium temperature for the sunspot number of a given year, and the forcing (=0.7*TSI/4) for each year from SORCE, I calculated the linear trend of temperature relative to forcing, a value which give the ECS. It turns out to be 1447 +/- 194 K/Wm-2.
This differs from MA Rodger's estimate because, his upper bound on the forcing massively overestimates the forcing differential. In particular, in 1987 the sunspot number was 33.9, with an insolation of 238.19 W/m^2, a value that differs by only 0.015 W/m^2 from the average over the period. Ergo Rodger's overestimated the forcing differential by a factor of 66.67.
qikplay @1152.
You may feel trawling SkS to identify posts to criticise is helpful but do pause a while. The BBC 'myth' addressed in the post here dates to 2004 and was written by David Whitehouse, a man suffering deep denial on AGW. Indeed, he has since been recruited by the GWPF (Gentlemen Who Prefer Fantasy). Whitehouse reports the work of Solanki which have been lost and forgotten by all but AGW deniers. And that is because the evidence, the data and graphs, demonstrates Solanki is plain wrong. You appear to reject the use of "competing graphs and data" as a way examining the unsupported fantasy of the likes of Solanki. How then would you suggest we examine his wild claims?
The fundamental problem with this analysis lies in the measurements used. The author begins with a paleo record (Wang 2005), which provides an estimate of TSI based on theororetical reconstructions and concludes his argument with direct instrument measures of TSI using advanced orbital measures obtained over the period between 1978 and 2010.
The paleo record clearly shows an upward trend in TSI. To counter the obvious conclusion reached from these measures, the author changes his reference to satellite observations, which show a locally declining trend. This is, without doubt, a choice biased by the author's ideology and his intention to refute a rising TSI either exists or is a significant factor in rising global temperature.
In general, use of measures for either solar output (TSI) or surface temperature taken before the broad use of the telegraph should be discarded; these measures were taken by hand using uncalibrated instruments and communicated by horse drawn carriage and sailing ship. The are not accurate or precise to the levels claimed by the models based on them, which are defined in fractions of a Watt and degree Centigrade. It's frankly absurd to use these data. Reconstructions (Wang et. al.) are even more difficult to accept; the error of estimate exeeds the observed variation in the measured value.
This is the root of the problem climateologists face when building models or presenting the results of them; they lack sufficient data. Climate change is a slow process that is detectable in very small changes. To be useful, measurements used must come from calibrated instruments with the accuracy and precision needed to build models capable of making predictions with error bars signigicantly smaller than +/- 1 degree centigrade. It is statistically impossible to use data such as those presented in this article to achieve that goal.
Impossible. This is not an ideologically based argument; it is mathematical. The problem Climate Science faces isn't theoretical, it's based on measurement. Measurements with the necessary precision and accuracy simply are not available over the necessary time frame. There is no way to correct this problem.
And it could be useful for hte author to explain why the data reductions presented (the models) were based on multiple liner regression? By all accounts (and I do mean all) thermodynamic systems have the signature characteristic ov being non-linear.
Pfc Parts @1153:
1)
This is transparently false. The sunspot number shows the same decline since 1979 (ie, since the commencement of satellite observations) as is to be found in the PMOD TSI index.
2)
Uncertainty of the mean of n independent variables equals the uncertainty of the measurement divided by the square root of the number of measurements. Therefore if we have a number of observations with an uncertainty of 2 then we have uncertainties of (with number observations followed by uncertainty:
2 0.71
5 0.45
10 0.32
20 0.22
100 0.10
200 0.07
1000 0.03
2000 0.02
10000 0.01
As can be seen, uncertainty decreases rapidly with multiple measurements. Ergo, the uncertainty in such things as global means surface temperature due to even quite large instrument errors is small. Uncertainty due to coverage biases are a different matter but that has nothing to do with the accuracy of instruments or the means of communicating results.
Clearly your mathematical argument does not hold water (which is itself no surprise as the scientists doing the reconstructions are themselve competent mathematicians).
@1154, the linear regressions in question are not thermodynamic equations. Ergo your "point" is a simple non sequitur.
Adding to the response to biocab at 03:45 AM on 13 September, 2007:
In addition to the amplifying effect of water are three other very significant factors that keep water from swamping CO(2):
1) The total water on the planet doesn't increase or decrease. Earth is an essentially closed system in terms of water, so this is why all water can do to increase warming is amplify some other factor that is changing. This is both logically trivial and utterly inescapable in big picture. The most severe amplification comes from increased ocean temperatures initially decreasing the solubility of CO(2) in the oceans to reduce their CO(2) sequestration, eventually followed by release of previously absorbed CO(2) in ocean water to increase atmoshperic CO(2) and accelerate the process past a tipping point of no return.
2) Only water vapor is a greenhouse gas. Hardly any exists above 10 km altitude. CO(2) continues at 400 ppm all the way up to over 80 km. There is enough CO(2) above 10 km to be practically opaque to infrared at CO(2) spectral wavelenths. All but the 15 micron wavelength overlaps the spectral emissions of water vapor, absorbing and re-emitting them omnidirectionally, which includes back to earth, of course. The 15 micron wavelength comes from both the earth's surface, but more importantly, also from kinetic collisions that convert thermal energy in both non-greenhouse and greenhouse gases to radiant energy (IR) at all CO(2) and other greenhouse gas emissive wavelengths.
3) This conversion of thermal energy in both greenhouse and non-greenhouse gases to radiant IR via kinetic excitation of CO(2) and other greenhouse gases is efficient, since the average lifetime of an excited CO(2) molecule (up to a few milliseconds) is much longer than the average time between collisions with non-greenhouse gases (~1 microsecond). The kinetic excitation of a greenhouse molecule is a field excitation phenomenon. The significant practical extent of the electric field of a greenhouse gas molecule is typically hundreds of times the size of the colliding non-greenhouse gas particles, so the easy target adds to the conversion efficiency.
Therefore most of the energy radiated out into the perfect thermal insulator, space, from the upper atmosphere (just above the troposphere around 10 km and up) is radiated by CO(2) (~68%, with ~16% directly from the surface, and ~13% from water vapor, wth the small remainder by other greenhouse gases). This clearly implies that the upper atmosphere radiates just as much back down, making CO(2) the major factor returning radiant heat to earth from the upper atmosphere. Much of this reaches the atmosphere near the surface mediated by water vapor via the spectral signature in common with CO(2) and the earth's surface itself by conversion to thermal heat upon striking it.
We can clearly deduce from the inevitably of omnidirectional radiation from CO(2) in the upper atmosphere that what goes out into space represents an equal amount going back toward earth. It's mediation by the other factors just referred to makes its very substantial contribution less obvious at the surface.
I find this article intresting since it pre-dates post NASA's prediction in May of 2006 that the sun was about to go into a state of lower solar sunspot activity.
Now just in July at the National Astronomy Meeting in Llandudno, Wales, Professor Valentina Zharkova presented an argument that due to the sinusodal period of the dynomo effects within two layers of the sun thgat have been quited accurately observed and predicted, will essentially cancel oneanother out by 2030 placing the sun in a lower state of inactivity than present and could very well spell another "mini ice age" Maunder Minimum event. We shall soon see.
[TD] There are many things wrong with that news story about Zharkova you are relying on. Read the relevant SkS post and comment there, please.
Climate change advocates have a tendancy to casually disregard the sun as an influence. This may be unreasonable given that the importance of the sun in virtually all of earth's natural processes *should* make it first port of call when trying to explain phenomena.
However, sceptics do not need to provide a solar explanation for global warming. They only need to state that one could exist. Advocates of human climate change may then either rule the sun out completely out or provide support for their preferred explanation (human CO2) by independent means. The latter is obviously off-topic for the current article.
The explaination given by scepticalscience.com does not rule out solar influences. All it does is cite one rather simplistic hypothetical mechanism for solar influence and then dismiss *that*. This could be called a straw man argument. It indicates a preference for putting words in the mouths of sceptics and then debunking *those* rather than listening to what sceptics are really saying.
Do sceptics have a convincing mechanism for a solar explaination? Well, there are some *feasable* ones, but nothing really solid.
So the status on this question is as follows: we can't say it *is* the sun and we can't say it *isn't*, either. Climate alarmists must *thouroughly* rule out the sun as a cause before making any argument along the lines of "warming must have the cause we say it does because there are no other viable causes".
A.R.S.Says @ #1158 :
Clearly you haven't read the educational material in this section.
Please do so . . . and then you will see that your expressed ideas are completely without foundation.
(btw, I must commend your sense of humour in choice of your nom-de-plume ~ the abbreviation is priceless.)
[JH] Inflamatory & off-topic.
Anyone who thinks the 'jury is still out' on whether cosmic rays can cause clouds hasnt seen a cloud chamber in aciton.
matt sykes @1160, the actual quote from the advanced version of the OP is:
Your version is a rather blatant misrepresentation of the text.
Despite that, I will bite. Dana elsewhere says:
The alternative to their growing "...sufficiently through condensation to form cloud-condensation nuclei (CCN)" is that they simply evaporate away to quickly due to their small volume and large surface area. So, here is a cloud chamber in action:
So, do the rapidly forming tracks then gradual dissipation indicate that the liquid droplets are growing through condensation, or just fading away? How does just seeing this clould chamber in action make it obvious that they are growing through condensation rather than dissipating?
And that, of course, is in a supersaturated solution - not normal atmospheric conditions. So, yes, I think the jury is still out on whether or not cosmic rays can lead to the formation of clouds - and looking at cloud chambers does not resolve the issue. Certainly, at least, if you actually look rather than bringing your prejudice to the table.
limited selection set obfuscation and dulicity, it is UV class C radiation that is melting the ice, anyone can take a simple UV measurement and substantiate this reality. Why did UV class C suddenly start reaching the surface? the earths high altitude ozone layer is dissolved by CFC and HFC contamination only by oil refining unrestricted pollution since 1980 when the EPA was destroyed by reagan appointee james watt. So the only country with real air standards was compromised.
[PS] Welcome to Skeptical science. Please take the time to review the Comments Policy and ensure future comments are in full compliance with it.
Firstly, you appear to be offtopic. I think this would be better under "its ozone". Use the search button in top left to find appropriate topics. Secondly, note the requirement to back claims. In particular, the claim that UV_C is melting ice caps is contrary to published science. The association of CFCs and HFC with oil refining is also unknown to me.
For 220 ppmv man-made CO2 in Earth atmosphere, how much real energy does that amount of CO2 absorb from the Sun, or from 15 micro-meter wavelength IR radiated back from the Earth? Doesn't 15 micro-meter IR radiation (that CO2 "strongly absorbs") correspond to a surface radiating at -80 deg.C? (Wein's radiation temp.equation). That would be very, very low energy radiation absorbed by CO2.
[RH] Before just deleting this comment outright for being off-topic, how about we give you the opportunity to explain why you think this applies to the article you're commenting on? Which is:
"Sun & climate: moving in opposite directions."
[PS] And perhaps have poster review their mathematics and understanding how the RTE works - a doubling of CO2 from preindustrial corresponds to 1.1C increase in surface temp before any feedbacks.
cdbenny @1163, your question of topic on this thread, so I have answered it in a more appropriate thread.
Why off-topic? Doesn't CO2 absorb radiation originating from the sun? Re-radiated from earth? What wave-lengths does CO2 absorb? A number of analyses state "CO2 strongly absorbs IR radiation at 15 micro-meter wavelenght." Review math? do you not know Wein's eqn.: deg.K = 2897/15micro-meter wavelenth = 193deg.K, or neg.80deg.C. (The sun radiates avg.abt 0.5micro-meter, so sun surface avg.abt 2897/0.5 = 5,800deg.K). If CO2 absorbs 15 micro-meter radiation, that is very low energy; where is the energy analysis on CO2 absorbing IR radiation?
Curtis @1164 :where is the 'approp thread' you answered 1163?
[PS] Try clicking on the link Tom provided and please read an article before deciding to comment on it. You might want to check your understanding of Wein's law in a text book.
cdbenny @1165, the OP of this thread is about the myth that recent global warming has been primarilly due to increased solar radiation. Your comments have no bearing on that topic. Even the fig leaf that solar radiation is also absorbed by CO2 is shown to be irrelevant in that the intensity of solar radiation in the relevant portions of the spectrum are only 1.4% of the intensity of upward IR radiation from the surface at those same wave lengths.
The final phrase of my preceding post was hyperlinked to the appropriate thread. The link in plain text is
http://www.skepticalscience.com/news.php?p=3&t=109&&n=1210#116071
I will not address again your silly misunderstanding of Wein's Law.
New user here. Just found this link being offered up by a denier running a blog called notrickszone.
http://notrickszone.com/2016/02/16/impossible-to-ignore-in-2015-alone-massive-250-peer-reviewed-scientific-papers-cast-doubt-on-climate-science/
It purports to tout 250 studies from 2015 that deny AGW. Having reviewed these lists from deniers before, I'm uh, skeptical, that many of the studies say what is claimed of them.
RockfordFile
I just skimmed the first 20 or so papers. Most seemed to be straight science on details of climate. A focus on sun climate links at regional scales, high atlantic/arctic/greenland patterns, solar impacts on the stratosphere, projections of past and future solar activity etc. or simply exploring things like variability of the Indian Monsoon. Nothing challenging the basics of CO2's role, just exploring subordinate mechanisms.
Except for 3 red flags:
So broadly, standard detailed, regional mechanism, climate research. Not extraordinary or paradigm changing. Just the obvious that not all the details of the science is settled. Which of course it isn't.
Again a giant version of the 'the science is settled' strawman argument.
But too detailed to try and rebut in depth.
Welcome to SkS.
If you are interested in discussing this further the 'the science isn't settled' thread is the appropriate location. Others will follow you there.
[GT]
Can someone point to a rebuttal of Soon, Connolly & Conolly?
http://globalwarmingsolved.com/data_files/SCC2015_preprint.pdf
They claim It's the Sun.
sailingfree @1169, a brief read of Soon, Connolly and Connolly (SC&C)shows it to be a smorgasborg of cherry picks. They start by cherry picking the ACRIM reconstruction of Satellite measurements of Total Solar Irradiance (TSI) in preference to the PMOD reconstruction, or the IRMB reconstruction. They do this despite the fact that, by their own admission that comparisons of the reconstructions to ground based data were "were slightly
better for PMOD". They then cherry pick one of eight reconstructions of TSI since 1850, choosing one with the highest variability in TSI. From what I know of the issues, neither choice is justified, but I will leave that to be argued by others.
Moving on, they procede to cherry pick their own NH temperatures series using just rural stations from China, the United States, Ireland and the Arctic Circle. Last time I looked, there were more locations than that in the NH. Their resulting reconstruction is significantly different from that using the GHCN (essentially the NOAA temperature reconstruction). That is odd because Caerbannog has repeatedly shown using randomly selected rural stations chosen to maximize territorial coverage that just a few tens of stations essentially reproduces the standard records:
More troubling than the difference is the cherry pick of a NH only temperature reconstruction. The NH temperature record is considerably more variable than that of the SH:
Presumably global forcings will have global effect, so that effects seen primarilly in one hemisphere only cannot be attributed to global forcings. The choice of a NH temperature series (strictly a 3 nation plus Arctic series) invalidates the study without further analysis.
Proceding further on, SC&C test the correlation between their cherry picked reconstruction of TSI and their cherry picked reconstruction of NH temperatures. They then assume that CO2 forcing only accounts for the residual of TSI based temperature reconstruction. This pair wise comparison proceedure is not a valid statistical technique for testing the correlation of multiple factors. If it were valid, it would generate the same linear dependence between CO2 and temperature regardless of whether you tested CO2 against temperature and TSI against residuals, or the reverse. As it happens SC&C do test both and show that they do not generate the same factor. They claim this demonstrates they should use the solar first priority, whereas it actually disproves the validity of their technique.
Finally, SC&C find a variation in temperature relative to changes of TSI of 0.2112 C/ (W/m^2) (Figure 28 a). Adjusting for albedo and the fact that the Earth is spherical, that becomes 1.207 C/ (W/m^2) of solar forcing. For an equivalent forcing to the doubling of CO2, that represents a TCR of 4.465 C. In contrast, for CO2 they find a change in temperature relative to change in forcing of -0.1039 C/ (W/m^2) (Figure 29 b). For a doubling of CO2, that represents a TCR of -0.384 C.
The TCR of CO2 differs from their stated estimate, which was calculated based on CO2 concentration (Figure 29 a) rather than radiative forcing. We can default to their stated TCR value of 0.44 C for CO2. That leaves unexplained why their trend line for CO2 and for CO2 radiative forcing have opposite signs. It also leaves unexplained why they repeatedly mistate the TCR as being the "climate sensitivity". The most fundamental problem however is, why is the temperature response to changes in solar radiative forcing 10 times greater than that due to CO2 radiative forcing in their model? That is an extraordinary result that requires extraordinary explanation. The default assumption must be that reponse to radiative forcing is approximately the same across all forcings.
To summarize, even if we ignore their multiple cherry picks - the use of a NH only temperature series; and of singular sequential linear regression rather than multiple regression means the paper is scientific garbage. Unsurprisingly, it produces a garbage result (temperature responce to solar forcing ten times that due to CO2 forcing).
Tom Curtis @1170,
Your characterisation of Soon et al (2015) as "a smorgasborg of cherry picks" is well founded. One "cherry pick" you could add to the charge-sheet is that Soon et al (2015) fail to address the implications of the Hoyt & Schatten TSI data prior to 1880. Their Figure 8 does plot out the various TSI reconstructions back to 1800 which, if the Hoyt & Schatten (1993) data is accepted as a proxy for NH temperature as Soon et al propose, implies the 1830s NH temperatures would have to be warmer than the 1960s. And if that is a tricky proposition to defend, it must be remembered that the H&S resconstruction is 1700-1992 (see IPCC graph here). The implication of the Soon et al (2015) proposition thus also encompasses the implication that the 1770s were as warm as the 1940s and also as warm as the early 1990s. I think even the bogus methods of Soon, Connolly & Connolly would struggle with defending such a warm 1770s.
There is no way that the satellite instruments measuring TSI are stable enough to make any claims one way or another about its change since they have been flown (1978 to present). So the belief that TSI has been stable or even gone down based on these measurements is a myth.
Stability requirement: As is understood, a change on the order of 0.1% in TSI could yield the observed average warming. So in order to use these instruments to successfully state that this is not happening, they would need to be stable by <0.01% !!!. This is this stability requirement stated by the instrument engineers and scientists themselves (see for instance the Wikipedia "Solar irradiance" article, and then click on links to articles written by the instrument engineers/scientists). Mind you, this requirement needs to be satisfied over the entire series of instruments flown since 1978, with the change in TSI "passed through" several of these instruments to the present, using each instrument in the "daisy chain" to calibrate the next one.
Community stability assessment: In the community of engineers and scientists that actually build and fly these instruments, there is a high degree of skepticism that they are stable to the 0.01% requirement (or even anywhere close to this). Just Google the subject of satellite TSI instruments, or fan out from the Wikipedia "Solar irradiance" article, for yourself.
My background: I was an optical instrument engineer for my entire career, with a lot of that time working as a contractor for NASA GSFC (such as working to fix the Hubble telescope). I designed, built, and calibrated flying instruments, as well as the instruments used to test same. A considerable amount of my time was spent dealing with issues affecting the long term performance of optical instruments, including radiometric stability. With this experience, I was constantly called upon by NASA to evaluate the instruments built by others. If NASA had used GSFC to fly these instruments, as it "should" have done since it is GSFC's pervue to fly any unmanned bird within the bounds of lunar orbit, there was a fair likilyhood that the long term stability assessment of these instruments would have ended up on my desk.
My stability assessment: Any optical engineer with any radiometric experience whatsoever, would ROFL if you claimed that you had a radiometric instrument stable to <0.01%, let alone a whole "daisy chain" of them flown over decades in space. This is certainly true after examining the design of these instruments (active cavity electrical substitution radiometers), and the environment in which they operate. Leaving the electronics aside, there is no way that these radiometers could be assumed to optically stable to 0.01%, or anywhere near that performance. OMG, your hitting the radiometric cavity with full vacuum sunlight. Do you have any idea what that does to any optical surface over time? Also, no matter how careful you are, there can and will be outgassing from the internal surfaces of the instrument cavity (especially all that baffling), which will collect on the (designed) specular surface of the light cone used trap the light. When the sunlight hits that contamination, it will "fry" it, causing "globules" that will increase the diffuse reflectivity of the cone over time, thereby decreasing the amount of specular light absorbed by the cone, and therefore its sensitivity. This is something we intrument engineers have seen time and again with spaceborne instruments measuring full sunlight. The present generation has some accompanying ground "witness instruments" that are twins of what is being flown, and the engineers/scientists have wisely put one permanantly in a vacuum chamber along with a solar simulator to measure its long term stability under the expected conditions. But this measurement is still in progress (in my understanding), and I'll bet my last dollar that this witness won't even come close to being stable enough.
Total Solar Irradiance Data
Bill N @1172 . . . presumably for the same reasons, you are equally skeptical that TSI could have been shown to have "risen" significantly since 1978.
And then there's the matter of stratospheric cooling since 1978 ~ which also seems to suggest that the TSI has not risen.
And the cumulative and aggregate effect of data from ground-level instruments which are properly maintained.
All in all, "it doesn't seem to be the sun" . . . would appear to be quite correct.
Greetings "RedBarron". What you posted does not address the long term optical stability issue. There is no onboard instrumentation that can test for optical changes over time (see below for a caveat). The quoted long-term relative uncertainties of 10ppm/yr for the TIM have nothing to do with the continual optical changes due to environmental factors such as outgassing, dust, and sunlight induced degredation of the conical specular refelectors used. This is why use is being made of a ground vacuum witness under simulated solar impingement in order to finally get a handle on this. If you don't believe me, just look at what is being said about stability by some of the very engineers and scientists who fly these instruments. Finally, to obtain a time frame long enough for reasonable assessment of whether the average TSI is changing (over time constants longer than the 11yr solar cycles of course), use is required of the similarly designed radiometers prior to TIM use. Again, there is no way that the whole "daisy chain" of these instruments can be relied upon to the level of stability required. Note we are not talking about absolute calibration here, since each instrument in the series is calibrated against the ones already flying to measure TSI changes. But if they are all experiencing optical changes over time (at levels smaller than what can be detected by the absolute calibrations, but plenty large enough to swamp the long term stabiliy requirement), there is no way to know that.
The UV channel of the TIM spectrometer can though indirectly measure long term solar changes accurately, due to its use of a large number of reference stars in order to measure its sensitivity changes over time. But at present, solar science may not be mature enough to predict TSI changes based on purely UV changes (I far as I can tell). Perhaps if an instrument were flown that could use a similar "many-star" based calibration technique across a number of visible wavelengths, then the changes in our Sun's TSI could be reasonably inferred. But at present, even if the TIM UV channel could be used to infer TSI changes, it has not flown nearly long enough to quantify what these changes are.