


 Arguments


Sun & climate: moving in opposite directions
What the science says...
| Select a level... |
 Basic
Basic
|
 Intermediate
|
 Advanced
| ||||
|
The sun's energy has decreased since the 1980s but the Earth keeps warming faster than before. |
|||||||
Climate Myth...
It's the sun
"Over the past few hundred years, there has been a steady increase in the numbers of sunspots, at the time when the Earth has been getting warmer. The data suggests solar activity is influencing the global climate causing the world to get warmer." (BBC)
At a glance
Thankfully for us, our Sun is a very average kind of star. That means it behaves stably over billions of years, steadily consuming its hydrogen fuel in the nuclear reaction that produces sunshine.
Solar stability, along with the Greenhouse Effect, combine to give our planet a habitable range of surface temperatures. In contrast, less stable stars can vary a lot in their radiation output. That lack of stability can prevent life, as we know it, from evolving on any planets that might orbit such stars.
That the Sun is a stable type of star is clearly demonstrated by the amount of Solar energy reaching Earth's average orbital position: it varies very little at all. This quantity, called the Total Solar Irradiance, has been measured for around forty years with high accuracy by sensitive instruments aboard satellites. Its average value is 1,362 watts per square metre. Irradiance fluctuates by about a watt either way, depending on where we are within the 11-year long sunspot cycle. That's a variation of no more than 0.15%.
From the early 1970s until today, the Solar radiation reaching the top of Earth's atmosphere has in fact shown a very slight decline. Through that same period, global temperatures have continued to increase. The two data records, incoming Solar energy and global temperature, have diverged. That means they have gone in opposite directions. If incoming Solar energy has decreased while the Earth continues to warm up, the Sun cannot be the control-knob of that warming.
Attempts to blame the sun for the rise in global temperatures have had to involve taking the data but selecting only the time periods that support such an argument. The remaining parts of the information - showing that divergence - have had to be ditched. Proper science study requires that all the available data be considered, not just a part of it. This particular sin is known as “cherry-picking”.
Please use this form to provide feedback about this new "At a glance" section, which was updated on May 27, 2023 to improve its readability. Read a more technical version below or dig deeper via the tabs above!
Further details
Our Sun is an average-sized main sequence star that is steadily using its hydrogen fuel, situated some 150 million kilometres away from Earth. That distance was first determined (with a small error) by a time consuming and complex set of measurements in the late 1700s. It led to the first systemic considerations of Earth's climate by Joseph Fourier in the 1820s. Fourier's number-crunching led him to realise a planet of Earth's size situated that far from the Sun ought to be significantly colder than it was. He was thereby laying the foundation stone for the line of enquiry that led after a few decades to the discovery of what we now call the Greenhouse Effect – and the way that effect changes in intensity as a response to rising or falling levels of the various greenhouse gases.
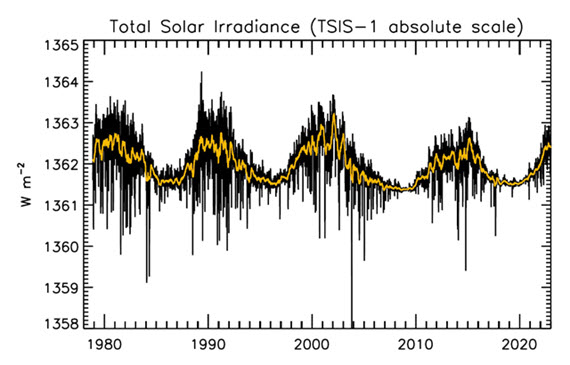
Figure 1: Plot of the observational record (1979-2022) on the scale of the TSIS-1 instrument currently flying on the space station. In this plot, the different records are all cross calibrated to the TSIS-1 absolute scale (e.g., the TSIS1-absolute scale is 0.858 W/m^2 higher than the SORCE absolute scale) so the variability of TSI in this plot is considered to be its “true variability” (within cross calibration uncertainties). Image: Judith Lean.
The Sun has a strong magnetic field, but one that is constantly on the move, to the extent that around every 11 years or so, Solar polarity flips: north becomes south, until another 11 years has passed when it flips back again. These Solar Cycles affect what happens at the surface of the Sun, such as the sunspots caused by those magnetic fields. Each cycle starts at Solar Minimum with very few or no sunspots, then rises mid-cycle towards Solar Maximum, where sunspots are numerous, before falling back towards the end. The total radiation emitted by the Sun – total solar irradiance (TSI) is the technical term – essentially defined as the solar flux at the Earth's orbital radius, fluctuates through this 11-year cycle by up to 0.15% between maximum and minimum.
Such short term and small fluctuations in TSI do not have a strong long term influence on Earth's climate: they are not large enough and as it's a cycle, they essentially cancel one another out. Over the longer term, more sustained changes in TSI over centuries are more important. This is why such information is included, along with other natural and human-driven influences, when running climate models, to ask them, “what if?"
An examination of the past 1150 years found temperatures to have closely matched solar activity for much of that time (Usoskin et al. 2005). But also for much of that time, greenhouse gas concentrations hardly varied at all. This led the study to conclude, "...so that at least this most recent warming episode must have another source."

Figure 2: Annual global temperature change (thin light red) with 11 year moving average of temperature (thick dark red). Temperature from NASA GISS. Annual Total Solar Irradiance (thin light blue) with 11 year moving average of TSI (thick dark blue). TSI from 1880 to 1978 from Krivova et al. 2007. TSI from 1979 to 2015 from the World Radiation Center (see their PMOD index page for data updates). Plots of the most recent solar irradiance can be found at the Laboratory for Atmospheric and Space Physics LISIRD site.
The slight decline in Solar activity after 1975 was picked up through a number of independent measurements, so is definitely real. Over the last 45 years of global warming, Solar activity and global temperature have therefore been steadily diverging. In fact, an analysis of solar trends concluded that the sun has actually contributed a slight cooling influence into the mix that has driven global temperature through recent decades (Lockwood, 2008), but the massive increase in carbon-based greenhouse gases is the main forcing agent at present.
Other studies tend to agree. Foster & Rahmstorf (2011) used multiple linear regression to quantify and remove the effects of the El Niño Southern Oscillation (ENSO) and solar and volcanic activity from the surface and lower troposphere temperature data. They found that from 1979 to 2010, solar activity had a very slight cooling effect of between -0.014 and -0.023°C per decade, depending on the data set. A more recent graphic, from the IPCC AR6, shows these trends to have continued.
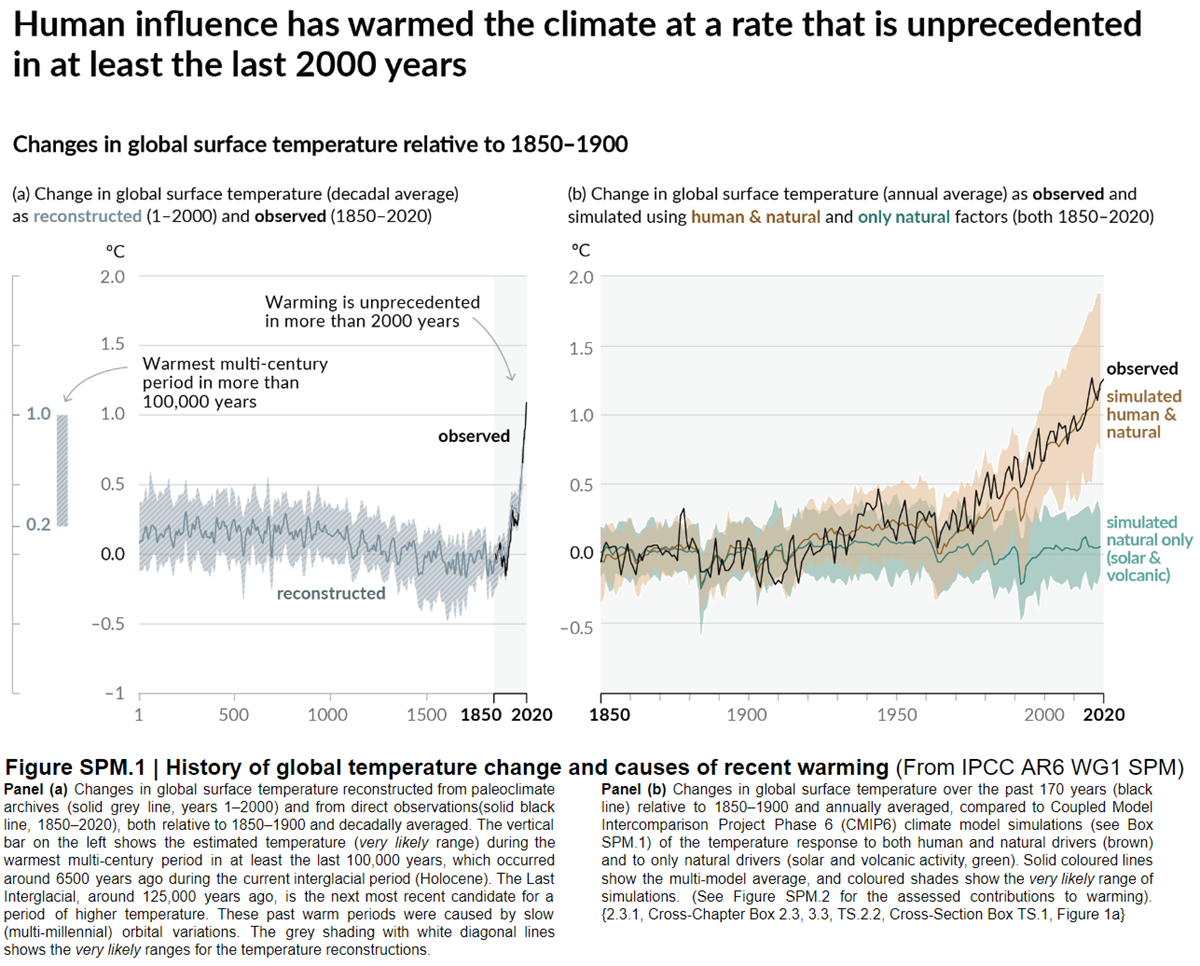
Figure 3: Figure SPM.1 (IPCC AR6 WGI SPM) - History of global temperature change and causes of recent warming panel (b). Changes in global surface temperature over the past 170 years (black line) relative to 1850–1900 and annually averaged, compared to Coupled Model Intercomparison Project Phase 6 (CMIP6) climate model simulations (see Box SPM.1) of the temperature response to both human and natural drivers (brown) and to only natural drivers (solar and volcanic activity, green). For the full image and caption please click here or on the image.
Like Foster & Rahmstorf, Lean & Rind (2008) performed a multiple linear regression on the temperature data, and found that while solar activity can account for about 11% of the global warming from 1889 to 2006, it can only account for 1.6% of the warming from 1955 to 2005, and had a slight cooling effect (-0.004°C per decade) from 1979 to 2005.
Finally, physics does not support the claim that changes in TSI drive current climate change. If that claim had any credence, we would not expect to see the current situation, in which Earth's lower atmosphere is warming strongly whereas the upper atmosphere is cooling. That is exactly the pattern predicted by physics, in our situation where we have overloaded Earth's atmosphere with greenhouse gases. If warming was solely down to the Sun, we would expect the opposite pattern. In fact, the only way to propagate this myth nowadays involves cherry-picking everything prior to 1975 and completely disregarding all the more recent data. That's simply not science.
Longer-term variations in TSI received by Earth
It's also important to mention variations in TSI driven not by Solar energy output but by variations in Earth's orbit, that are of course independent of Solar activity. Such variations, however, take place over very long periods, described by the Milankovitch orbital cycles operating over tens of thousands of years. Those cycles determine the distance between Earth and the Sun at perihelion and aphelion and in addition the tilt the planet's axis of rotation: both affect how much heat-radiation the planet receives at the top of its atmosphere through time. But such fluctuations are nothing like the rapid changes we see in the weather, such as the difference between a sunny day and a cloudy one. The long time-factor ensures that.
Another even more obscure approach used to claim, "it's the sun" was (and probably still is in some quarters) to talk about, "indirect effects". To wit, when studies can't find a sufficiently large direct effect, bring even lesser factors to the fore, such as cosmic rays. Fail.
In conclusion, the recent, post 1975 steep rise in global temperatures are not reflected in TSI changes that have in fact exerted a slight cooling influence. Milankovitch cycles that operate over vastly bigger time-scales simply don't work quickly enough to change climate drastically over a few decades. Instead, the enormous rise in greenhouse gas concentrations over the same period is the primary forcing-agent. The physics predicted what is now being observed.
Last updated on 27 May 2023 by John Mason. View Archives


Hi! As mathematician I can't help but wonder about one thing. In advanced section, you compute the possible range of solar contribution to global warming. To do that you use previously computed values for temperature increase for doubling CO_2 (through senstitivity etc). Basically, to compute solar contribution you use computed CO_2 contribution. So the logic goes: if CO_2 contribution is computed correctly, than solar contribution right now is not big enough to explain the current global warming. What I see here is circular logic.
I would imagine, you want your argument to go something like this: suppose CO_2 contribution is low, then solar contribution is low (in particular, it may not fit the data we have for before 1950s).
Please correct me if I understood what is going on wrong.
socialfox - estimates of climate sensitivity seek to answer what would the change of temperature for a given effective increase in radiation at TOA. Changes in GHG concentration, albedo are back-calculated to an effective change in TOA radiation. ie. As if the incoming solar radiation was changing. The direct contribution to radiative flux from a change in GHG is a known quantity (~4W/m2 for a doubling, which falls out the Radiative Transfer Equations and has been empirically verified in various ways). It is not something deduced from the temperature response, but resultant feedbacks (water vapour, albedo, cloud cover) that contribute to actual change in temperature are not well known and hence the wide range of estimates for climate sensitivity. Climate sensitivity is estimated from a variety of methods including paleoclimate and models.
Note that models do not assume a climate sensitivity - it is an emergent property from the model so I dont see the circularity.
As a person concerned about the climatic issue I am trying to understand all the arguments, however this graphic baffles me. Going to the physical foundations of the graph, the temperature is an indicator of the accumulated heat, while solar irradiation is a flow, and by therefore, a contribution of heat. So I don't see any point in looking for a correlation between the two variables (it would be like comparing speed with position). I think that the correlation between temperature variation and irradiation would be more interesting, and that is when these variables not only do not move in opposite directions but do so in parallel.
Reading though the comments, there are mentions of the cooling/warming effects of El Nina/Nino. Looking at this from a marine biologist perspective, I'd like to bring up the effects of climate change on tropical coral, particulary in the indian ocean and south pacific and how examining coral biodiversity records could be used to support AGW. Coral live between a fairly narrow temperature range. Extreme rises in temperature lead to bleaching and usually coincide with el nino events where vast bodies of warmer become trapped in the indian ocean and southern pacific. What we are seeing is a decline in biodiversity and massive bleaching events in the last 30 years, notable events in 1998, 2005 and 2017. Studying in the Maldives, there was evidence of coral recovery but ONLY for a few species compared to what can be found in historical records. Then the whole system got hit again in 2017 so back to square 1. To me, it is apparent that such a delicate ecosystem can be thriving for thousands of years and then hammered by prolonged, frequent, intense el nino events in a short space of time is a smoking gun. The reversal of trade winds seems to hinge on a delicate energetic balance in the atmosphere. I don't know why it's difficult to comprehend that insulating energy would change the dynamics of a system.
Apology for bothering you, I have misplaced the web path leading to this discussion of the Heinz Hug claim that CO2 absorbs so much of the infrared very close to land surface that more CO2 would not matter. In other words, he claims it is such a potent absorber that the effect is already saturated. There was a nice rebuttal somehere and I could not locate it. The rebuttal included a figure, Australian style, with the planet "upside down". It also mentioned satellite data about infrared emissions over the last decades. Can anyone help me locate this discussion which exists somewhere in your blogs?
[DB] Perhaps this one?
comeaukay @1280: Maybe you are looking for this: Is the CO2 effect saturated?
deucarra @ 1278: You are quite correct.
I assume that others, as I do, "eyeball" the average incoming irradiation and compare it to the slope of the temperature curve.
Deucarra, sailingfree - remember that outgoing must match incoming for conservation of energy. Perhaps need to look at how the Stephan-Bolzmann law is derived?
As it is, temperature is function of power. (T4 ~ to incoming energy flux), so the comparison is entirely valid. If energy flux changes, then surface temperature must change to maintain conservation of energy.
Hi All
I have some questions that I'm sure people here can help me with.
I read a paper by Ronan Connoly and colleagues:
https://www.sciencedirect.com/science/article/abs/pii/S0012825215300349
Preprint:
LINK
They say that the temperature graph on this page above is wrong because it does not take urban heat islands into account. They seem to show on graphs that rural temperatures are more or less flat since the 1950s. They seem to have looked very carefully at the data, starting with Valencia in Ireland. Are they wrong?
Secondly, I heard a talk by Richard Alley on youtube. He says that the ice ages were driven by 100,000, 41,000, 23,000 and 19,000-year Milankovitch cycles. He shows a convincing Fourier transform. If the sun can drive ice ages (approx 10C change), it should certainly be powerful enough to drive a temperature change of around 1C.
https://www.youtube.com/watch?v=ujkcTZZlikg
There seem to be many different models for solar irradiation - see the Connolly article above. Which one should we pick? They pick one that almost exactly matches the temperature fluctuations that they report. Are they wrong?
Thx to all and I'd be very interested in comments and explanations (but not so interested in assertions that there is "masses of evidence" out there that shows that the Connollys are completely wrong and that I should go and look for it).
[DB] Just because the climate changed naturally in the past does not mean that human activities are unable to change the climate today. Logical fallacy snipped.
Urban heat islands are dealt with here. Put all questions and responses to them there, not here.
This particular paper is execrable. You can look at takedown here but also note that Soon simply ignores any dataset that doesnt fit what his fossil fuel funding masters want. eg marine data (no urban heat sources there). Hard to believe this is still circulating in denier land.
It seems you are frantically on a search for anything that might indicate a problem in the science, no matter what the cesspool. Good luck. Have you actually looked at IPCC WG1 summary of climate science instead?
scaddenp,
I share your skepticism regarding the motivations of PatrickSS.
They do not appear to be interested in expanded awareness and improved understanding.
Instead of starting with a detailed understanding of the subject, they appear to be seeking excuses to not expand their awareness or improve their understanding (though they sound interested by 'asking questions').
As an example, in previous comments they present their summary understanding of presentations of understanding by "“consensus” climate scientists" (their term of reference) as "...sunlight comes in, heats the Earth, and the heat escapes from the Earth via IR. Increased CO2 absorbs and blocks more IR, so the Earth gets warmer." They then compare that with what they consider to be more believable presentations by Lindzen, Allen and Curry (they are more impressed by these people than they are by the "consensus" climate scientists that they present an extremely poor level of understanding of).
In addition they appear to have summarized my previous comments to them regarding pursuit of expanded awareness and understanding of climate science matters as "... assertions that there is "masses of evidence" out there that shows that the Connollys are completely wrong and that I should go and look for it":
"There is a massive diversity of evidence supporting the climate science consensus understanding that human activities, particularly fossil fuel use, are significantly impacting the global climate in ways that are detrimental to the future generations."
"Seek out detailed explanations of the incorrect aspects of the claims made by Lindzen, Alley and Curry. There are many sources for the corrected expanded understanding (and a vast amount is available right here on the SkS site)."
I believe you are correct to suspect that PatrickSS has not read, and is unlikely to read, any IPCC document. I would add that I suspect that PatrickSS filters information for its 'ability to impress them, suit their preferred beliefs'. My comments were an attempt to make them aware of that.
Recommended supplemental reading:
Four graphs that suggest we can’t blame climate change on solar activity by Gareth Dorrian & Ian Whittaker, The Conversation UK, Jan 24, 2020
Recommended supplemental reading:
Electroverse article incorrectly claims the Sun is behind climate change, Edited by Scott Johnson Climate Feedback, Mar 18, 2020
I appreciate the argument on recent decrease in solar output. But that is the "Gravity doesn't exist" argument. A person tracks a falling ball. Initially, gravity theory and fall rates match. Then they no longer match. So lesser scientists conclude that it's not gravity making the ball fall. "See, if it was gravity, then the ball fall rate would continue to rise." There are good arguments, but that's not a worthy one.
Scientists have long ago learned to account for fluids. With gravity, it's friction provided by the fluid called air. In climate, it's the fluid called oceans.
If I turn the stove down, stove element temperature will decrease. But, if the pan still has a temperature lower than the stove element, pan temperature will continue to rise. Oceans are about 7C warmer than the atmosphere. As sun and ocean temperatures fall, they will continue to increase the temperature of the atmosphere. Oceans will always have a temperature higher than the atmosphere. But, the gap does narrow as oceans cool and the atmospheric temperature continues to rise.
Think of atmosphere as aluminum foil and think of the oceans as the cast iron pan that is absorbing (and storing) solar heat. This will get you closer to the truth about climate change.
Chuck #1289:
Your stove analogy fails because the oceans are not cooling. If anything, their warming seems to have accelerated over the last few decades.
Here's the temperature anomaly of the upper 100 metres:
And here's the change of heat content in the upper 2000 metres:
The Sun has cooled, but the atmosphere and the oceans keep warming. The only explanation making sense is that the Earth gives off less heat to space.
HK@1290 -
"The only explanation making sense is that the Earth gives off less heat to space."
--- Another additional explanation would be the fact, that the earth absorbs more short-wave solar energy from space, although the solar constant(1360,5W/m²) tends to decrease actually.
Explained by the cloud and snow / ice albedo that has decreased in the last few decades (0,5W/m² which is a lot).
[BL] The user cph has been confirmed as a sock puppet of the previously-banned user coolmaster. Until the admins can delete the account of cph, any further posts by cph wll be deleted as soon as moderators find them. Please do not respond to any comments you come across.
"Explained by the cloud and snow / ice albedo that has decreased in the last few decades (0,5W/m² which is a lot)."
The net forcing from the preindustrial period when counting both the positive forcing from the greenhouse gases and the negative forcing from man-made aerosols is now roughly 2.5–3 W/m².
Changes in clouds and the snow/ice albedo are positive feedbacks amplifying that warming. The most important and fastest of those is the water vapour feedback which roughly doubles the initial warming.
BTW, if clouds and snow/ice changed by themselves and not as a feedback to warming caused by GHGs, we wouldn't get a cooling stratosphere or more warming in winter than summer at high northern latitudes.
HK@1292 - "BTW, if clouds and snow/ice changed by themselves and not as a feedback to warming caused by GHGs, we wouldn't get a cooling stratosphere..."
--- I did not understand your last sentence. I am of the opinion that, for example, a changed cloud albedo cannot be explained by a rise in temperature alone. Changes and anomalies in global mean cloud cover can also be caused by fewer (sulfate) aerosols or expanding deserts (dry regions become drier).
https://www.carbonbrief.org/satellite-data-reveals-impact-of-warming-on-global-water-cycle
Evaporation increases by + 2.3 mm / year, which is not fully compensated for by increased precipitation of + 1 mm / year. A decreasing runoff through the rivers of -1.01 mm / year and a falling groundwater level of -0.75 mm / year quantify the drainage of the continents. This drainage (through drained bogs, wetlands, groundwater, aquifers, canalization of rivers and a constantly growing sealing of urban areas) is just as man-made as the CO² emissions, rising temperatures and the resulting higher evaporation. Too little H²O in desert regions and the earth's atmosphere, which in summer extend through droughts up to the Arctic Circle, are a temperature driver. Too much CO² is just as warming as too little H²O. Less evapotranspiration -> less cloud albedo -> higher incoming radiation energy and record temperatures on the earth's surface -> even faster drying out with even higher temperatures - imho, similar to the ice-snow albedo, form a vicious circle.
The authors estimate a "statistically significant" increase in evapotranspiration of around 10% above the long-term mean (corresponds to a temperature increase over land areas of ~ + 1.44 ° C). During the same period, precipitation only increased by 3% and global river runoff decreased by 6%.
---
What is noticeable here is a simultaneous decrease in relative humidity and cloudiness, which certainly correlates with a general increase in the number of hours of sunshine.
[BL] The user cph has been confirmed as a sock puppet of the previously-banned user coolmaster. Until the admins can delete the account of cph, any further posts by cph wll be deleted as soon as moderators find them. Please do not respond to any comments you come across.
My point in #1292 was that the 0.5 W/m2 of forcing from clouds and snow/ice is small compared to the overall net forcing over the last 150 years or so and that the albedo change brought up by you is at least partly a direct consequence of the warming, i.e., one of the positive feedbacks.
However, I will admit that clouds and humidity are complex and can be influenced by other factors in addition to the direct result of man-made greenhouse gases. Desertification and deforestation in general and especially cutting down tropical rainforests can have a profound impact on the local hydrological cycle, changing humidity, cloud cover, rainfall and run-off and thus have an impact on the local temperature as well. So yes, man-made climate change isn't only about the greenhouse effect and the warming caused by it, but it's definitely the most important part of it on a global scale.
It's also worth noting that even if the relative humidity seems to have decreased somewhat for the reasons explained here, the absolute or specific humidity has in fact increased, just as expected in a warming world.
Water has an impact on the temperature not only via its removal of latent heat through evaporation – which has a local cooling impact – but also through its warming impact via its strong greenhouse effect, which is the most important of all the positive (amplifying) feedbacks on a global scale.
Diagram showing the monthly fluctuations in total global cloud cover since July 1983. During the observation period, the total amount of clouds fluctuated from about 69 percent in 1987 to about 64 percent in 2000. The annual variation in cloud cover follows the annual variation in atmospheric water vapor content, which presumably reflects the asymmetrical distribution of land and ocean on planet Earth.
Within the still short period of satellite cloud cover observations, global cloud cover reached a maximum of about 69 percent in 1987 and a minimum of about 64 percent in 2000 (see diagram above), a decrease of about 5 percent. This decrease corresponds roughly to a net change in radiation of around 0.9 W / m2 within a period of only 13 years, which can be compared with the total net change estimated by the IPCC 2007 report from 1750 to 2006 of 1.6 W / m2 for all climate drivers including greenhouse gas emissions from fossil fuel burning(cooresponds to your mentioned 2,5-3W/m² in 2021). These observations leave little doubt that cloud cover variations can have a profound impact on global climate and meteorology on almost every time scale considered.
The total reflectance (albedo) of the planet earth is about 30 percent, which means that about 30 percent of the incident short-wave solar radiation is reflected back into space. If all the clouds were removed, the global albedo would drop to around 15 percent and the short-wave energy available to warm the planet's surface would increase from 239 W / m2 to 288 W / m2 (Hartmann 1994). However, long-wave radiation would also be affected, which emits 266 W / m2 into space compared to the current 234 W / m2 (Hartmann 1994). The net effect of removing all clouds would therefore still be an increase in net radiation of around 17 W / m2. So the global cloud cover has a significant overall cooling effect on the planet, although the net effect of high and low clouds is opposite.
HK: - "but also through its warming effect through its strong greenhouse effect, which is the most important of all positive (reinforcing) feedbacks on a global level."
According to the current status, the net radiation effect of clouds is -19W / m² (Wild 2019) and corresponds very well with + 0.9W / m² per 5% less cloud cover.
High levels of global cloud cover are associated with low global temperatures, demonstrating the cooling effect of clouds. A simple linear fit model suggests that a 1 percent increase in global cloud cover corresponds to a global temperature decrease of about 0.07 ° C.
[DB] You are again off-topic for this post. Your entire argument revolves around clouds, so if you're going to prosecute that agenda, please take it here (after reading the post and all of the comments in the discussion thread):
https://skepticalscience.com/clouds-negative-feedback-intermediate.htm
[BL] The user cph has been confirmed as a sock puppet of the previously-banned user coolmaster. Until the admins can delete the account of cph, any further posts by cph wll be deleted as soon as moderators find them. Please do not respond to any comments you come across.
Total solar radiation has a huge impact on climate change, according to the scientific article below: Combine the data below with the closure of the ozone hole over the past 20 years, and that in itself could explain global warming. All hot in the last 25 years. They estimate that the Sun was responsible for 45–50% of global warming and 25–35% of global warming in 1980–2000. It may have played a key role in continued climate change over the past century. It also pointed out that the impact of solar on climate change over the same period was much stronger than what some theoretical models had predicted.
Pepper: Welcome to Skeptical Science.
Although there is a lot of noise about solar variations being a possible cause for recent warming, the papers that make this claim usually suffer major flaws.
The numbers that you are quoting need a reference - "they" is not enough detail! It sounds like you may be referring to the results of the paper that is reviewed in this blog post at Skeptical Science. Follow that link to see an example of how papers claiming a significant solar effect can have serious shortcomings.
The video tell the problem of energy balance. Temperature is tightly coupled variables. The solar irridiance is increasins during the past 50 years, I think it's important to know that solar irridiance changes most in the shorter wavelengths. It might not look like large effect for this change but there is something more.
Krit242 @1298 ,
Please look again at the diagram Figure 1 at the top of this page. The blue line shows the solar irradiance (in watts per square metre) has been decreasing since about year 1960. There is no increasing. The planet Earth is warming, and the warming is not due to solar changes.
That is why Pepper @1296 is wrong also ~ and the paper linked @1297 [ Ziskin & Shaviv, 2012 ] is poor science. Pepper has been deceived by Shaviv & some of the other (very tiny number of) scientists who are acting as propagandists. And why are these propagandists trying to deceive people ? . . . yes, that is an interesting question ! Most likely, these propagandists are first trying to deceive themselves.
Krit242 ~ please look at "the big picture". Look at the huge forest of climate evidence, and not at just one or two trees.
krit242 @ 1298:
The argument that short wavelengths of solar radiation have a large effect on climate is usually tied to the "it's cosmic rays" argument. The total amount of energy at those shorter wavelengths is very limited - although individual photons have more energy at shorter wavelemgths, there are just a lot fewer photons. A large percentage change in a small number is still a small number.
As for cosmic rays, Skeptical Science has a page for that, too.
The review I linked to at 1297 looks at a paper that tries to argue in favour of "indirect" solar effects - i.e., effects that are related to "something unknown" that is not the direct heating/energy input from variations in solar output. (Spolier alert: it's not a good paper.)