


 Arguments


Sun & climate: moving in opposite directions
What the science says...
| Select a level... |
 Basic
Basic
|
 Intermediate
|
 Advanced
| ||||
|
The sun's energy has decreased since the 1980s but the Earth keeps warming faster than before. |
|||||||
Climate Myth...
It's the sun
"Over the past few hundred years, there has been a steady increase in the numbers of sunspots, at the time when the Earth has been getting warmer. The data suggests solar activity is influencing the global climate causing the world to get warmer." (BBC)
At a glance
Thankfully for us, our Sun is a very average kind of star. That means it behaves stably over billions of years, steadily consuming its hydrogen fuel in the nuclear reaction that produces sunshine.
Solar stability, along with the Greenhouse Effect, combine to give our planet a habitable range of surface temperatures. In contrast, less stable stars can vary a lot in their radiation output. That lack of stability can prevent life, as we know it, from evolving on any planets that might orbit such stars.
That the Sun is a stable type of star is clearly demonstrated by the amount of Solar energy reaching Earth's average orbital position: it varies very little at all. This quantity, called the Total Solar Irradiance, has been measured for around forty years with high accuracy by sensitive instruments aboard satellites. Its average value is 1,362 watts per square metre. Irradiance fluctuates by about a watt either way, depending on where we are within the 11-year long sunspot cycle. That's a variation of no more than 0.15%.
From the early 1970s until today, the Solar radiation reaching the top of Earth's atmosphere has in fact shown a very slight decline. Through that same period, global temperatures have continued to increase. The two data records, incoming Solar energy and global temperature, have diverged. That means they have gone in opposite directions. If incoming Solar energy has decreased while the Earth continues to warm up, the Sun cannot be the control-knob of that warming.
Attempts to blame the sun for the rise in global temperatures have had to involve taking the data but selecting only the time periods that support such an argument. The remaining parts of the information - showing that divergence - have had to be ditched. Proper science study requires that all the available data be considered, not just a part of it. This particular sin is known as “cherry-picking”.
Please use this form to provide feedback about this new "At a glance" section, which was updated on May 27, 2023 to improve its readability. Read a more technical version below or dig deeper via the tabs above!
Further details
Our Sun is an average-sized main sequence star that is steadily using its hydrogen fuel, situated some 150 million kilometres away from Earth. That distance was first determined (with a small error) by a time consuming and complex set of measurements in the late 1700s. It led to the first systemic considerations of Earth's climate by Joseph Fourier in the 1820s. Fourier's number-crunching led him to realise a planet of Earth's size situated that far from the Sun ought to be significantly colder than it was. He was thereby laying the foundation stone for the line of enquiry that led after a few decades to the discovery of what we now call the Greenhouse Effect – and the way that effect changes in intensity as a response to rising or falling levels of the various greenhouse gases.
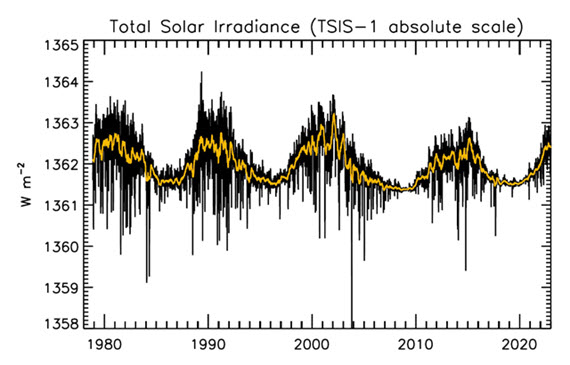
Figure 1: Plot of the observational record (1979-2022) on the scale of the TSIS-1 instrument currently flying on the space station. In this plot, the different records are all cross calibrated to the TSIS-1 absolute scale (e.g., the TSIS1-absolute scale is 0.858 W/m^2 higher than the SORCE absolute scale) so the variability of TSI in this plot is considered to be its “true variability” (within cross calibration uncertainties). Image: Judith Lean.
The Sun has a strong magnetic field, but one that is constantly on the move, to the extent that around every 11 years or so, Solar polarity flips: north becomes south, until another 11 years has passed when it flips back again. These Solar Cycles affect what happens at the surface of the Sun, such as the sunspots caused by those magnetic fields. Each cycle starts at Solar Minimum with very few or no sunspots, then rises mid-cycle towards Solar Maximum, where sunspots are numerous, before falling back towards the end. The total radiation emitted by the Sun – total solar irradiance (TSI) is the technical term – essentially defined as the solar flux at the Earth's orbital radius, fluctuates through this 11-year cycle by up to 0.15% between maximum and minimum.
Such short term and small fluctuations in TSI do not have a strong long term influence on Earth's climate: they are not large enough and as it's a cycle, they essentially cancel one another out. Over the longer term, more sustained changes in TSI over centuries are more important. This is why such information is included, along with other natural and human-driven influences, when running climate models, to ask them, “what if?"
An examination of the past 1150 years found temperatures to have closely matched solar activity for much of that time (Usoskin et al. 2005). But also for much of that time, greenhouse gas concentrations hardly varied at all. This led the study to conclude, "...so that at least this most recent warming episode must have another source."

Figure 2: Annual global temperature change (thin light red) with 11 year moving average of temperature (thick dark red). Temperature from NASA GISS. Annual Total Solar Irradiance (thin light blue) with 11 year moving average of TSI (thick dark blue). TSI from 1880 to 1978 from Krivova et al. 2007. TSI from 1979 to 2015 from the World Radiation Center (see their PMOD index page for data updates). Plots of the most recent solar irradiance can be found at the Laboratory for Atmospheric and Space Physics LISIRD site.
The slight decline in Solar activity after 1975 was picked up through a number of independent measurements, so is definitely real. Over the last 45 years of global warming, Solar activity and global temperature have therefore been steadily diverging. In fact, an analysis of solar trends concluded that the sun has actually contributed a slight cooling influence into the mix that has driven global temperature through recent decades (Lockwood, 2008), but the massive increase in carbon-based greenhouse gases is the main forcing agent at present.
Other studies tend to agree. Foster & Rahmstorf (2011) used multiple linear regression to quantify and remove the effects of the El Niño Southern Oscillation (ENSO) and solar and volcanic activity from the surface and lower troposphere temperature data. They found that from 1979 to 2010, solar activity had a very slight cooling effect of between -0.014 and -0.023°C per decade, depending on the data set. A more recent graphic, from the IPCC AR6, shows these trends to have continued.
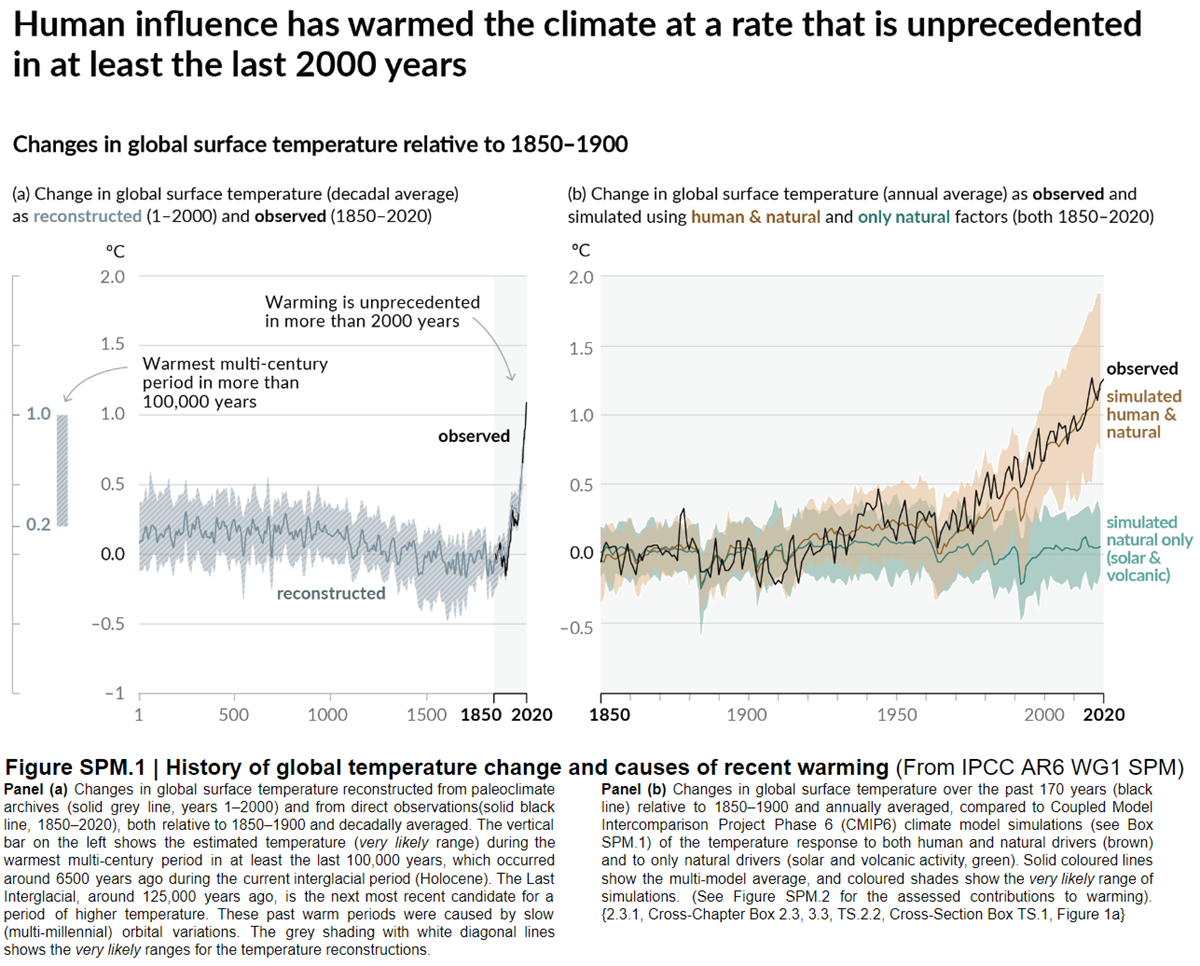
Figure 3: Figure SPM.1 (IPCC AR6 WGI SPM) - History of global temperature change and causes of recent warming panel (b). Changes in global surface temperature over the past 170 years (black line) relative to 1850–1900 and annually averaged, compared to Coupled Model Intercomparison Project Phase 6 (CMIP6) climate model simulations (see Box SPM.1) of the temperature response to both human and natural drivers (brown) and to only natural drivers (solar and volcanic activity, green). For the full image and caption please click here or on the image.
Like Foster & Rahmstorf, Lean & Rind (2008) performed a multiple linear regression on the temperature data, and found that while solar activity can account for about 11% of the global warming from 1889 to 2006, it can only account for 1.6% of the warming from 1955 to 2005, and had a slight cooling effect (-0.004°C per decade) from 1979 to 2005.
Finally, physics does not support the claim that changes in TSI drive current climate change. If that claim had any credence, we would not expect to see the current situation, in which Earth's lower atmosphere is warming strongly whereas the upper atmosphere is cooling. That is exactly the pattern predicted by physics, in our situation where we have overloaded Earth's atmosphere with greenhouse gases. If warming was solely down to the Sun, we would expect the opposite pattern. In fact, the only way to propagate this myth nowadays involves cherry-picking everything prior to 1975 and completely disregarding all the more recent data. That's simply not science.
Longer-term variations in TSI received by Earth
It's also important to mention variations in TSI driven not by Solar energy output but by variations in Earth's orbit, that are of course independent of Solar activity. Such variations, however, take place over very long periods, described by the Milankovitch orbital cycles operating over tens of thousands of years. Those cycles determine the distance between Earth and the Sun at perihelion and aphelion and in addition the tilt the planet's axis of rotation: both affect how much heat-radiation the planet receives at the top of its atmosphere through time. But such fluctuations are nothing like the rapid changes we see in the weather, such as the difference between a sunny day and a cloudy one. The long time-factor ensures that.
Another even more obscure approach used to claim, "it's the sun" was (and probably still is in some quarters) to talk about, "indirect effects". To wit, when studies can't find a sufficiently large direct effect, bring even lesser factors to the fore, such as cosmic rays. Fail.
In conclusion, the recent, post 1975 steep rise in global temperatures are not reflected in TSI changes that have in fact exerted a slight cooling influence. Milankovitch cycles that operate over vastly bigger time-scales simply don't work quickly enough to change climate drastically over a few decades. Instead, the enormous rise in greenhouse gas concentrations over the same period is the primary forcing-agent. The physics predicted what is now being observed.
Last updated on 27 May 2023 by John Mason. View Archives


The earth has been cooling down its dropped over 1 degree since the 90s not sure why the graph above stops and does not show this cooling down since the article was posted later than the highest heating point.
Now this cooling down is still continuing even though methane gas was released roughly ten times the amount more than normal. the sun has been less active as well before the earth began to cool a bit .the earth is still .36 degrees warmer however but again this cooling was done a bit after 2000 so that decrease happened relatively fast and I am sure will cause weather changes as the earth adjusts ..
They are trying to put the blame on man for the methane .however since 2007 Methane levels went on the rise and again the past 2 years released 10x (was the quote) that amount .. so unless rice paddies and cows and other man made products which is supposed to be 60 percent of the methane I dont see that had anything to do with this huge release at all as they stated having risen some monstrous amounts this can not be man made methane .
They admit that its hard to know where it came from ..but they will indeed blame man make up stats and charge people for it even though this much methane release has to come world wide and from other sources .IMO
[JH] Sloganeering snipped.
Please note that posting comments here at SkS is a privilege, not a right. This privilege can be rescinded if the posting individual treats adherence to the Comments Policy as optional, rather than the mandatory condition of participating in this online forum.
Please take the time to review the policy and ensure future comments are in full compliance with it. Thanks for your understanding and compliance in this matter.
Recommended supplemental reading:
As Earth Warms Up, The Sun Is Remarkably Quiet by Bob Henson, WunderBlog, Weather Underground, Jan 11, 2017
Recommended supplemental reading:
The NASA data conspiracy theory and the cold sun by Stefan Rahmstorf, Real Climate, Jan 16, 2017
'If the sun's energy is decreasing while the Earth is warming, then the sun can't be the main control of the temperature'.
Is this opening comment a suggestion that the sun is not the main control of temperature of the Earth?
Largely yes Charlie74.
If the output from the Sun varied significantly then that most certainly would matter. But the Sun's output actually varies to such a small extent over the solar cycle that a reasonable approximation is that it is constant.
But the strength of the greenhouse effect then modulates that impact. On Earth the climate is around 30 C warmer than it would be just from the strength of the Suns rays alone. On Venus it is over 500 C warmer than you would expect.
How strong the sunlight is sets the minimum temperature. But the GH effect raises it above that minimum.
Hi all. I've posted hardly at all on this site due to time constraints. However, I have read the first page very carefully, particularly following BioCab's comments, partly because my predilection is that AGW is probably happening, but that mankind's affect on the climate is not catastrophic.
One of the issues that came up in Page 1, back in 2007, is the argument that warming is likely to be causing CO2 release. This argument is that mankind, while emitting a lot of CO2, is not the major CO2 emitter on the planet. I understand the argument that it is thought that the minsiscule amount of CO2 that is emitted by mankind is forcing the warming, but the apparent leverage of that warming has not yet been proven.
My question is this: Does anybody know which page on this thread presents the 'Warming is Releasing' argument? Or is it the case that the "Warming is Releasing" argument resides on it's own page?
Thx! JF
JohnFornaro... This would be a more appropriate topic for this thread. Please repost your question there.
Rob Honeycutt: Thanks.
Would anyone know if there is a simple way to download the data used to produce Figure 2 from the IPCC AR5 Chapter 5? I'd like to show their calculations in a presentation, but the charts as provided are a bit busy. If I can present them as individual charts in Apple Keynote, it would really help.
Thans in advance, and thank you for Skeptical Science!
Christian
Cready @1234, this is a good first point of call.
Tom Curtis @1235, thanks. I did find that page, but I got horribly lost looking for the right data to reproduce that figure. I'm not really sure what I should be looking for, however. Any ideas?
cready @1236,
The upper panel of AR5 Fig 5.2 plots SST, SL & southern ocean dust as well as paleo CO2. If it is just the CO2 you wish to plot out, this NOAA directory may be useful. The data is a little old now (all pre-2006) but it probably provides half of the data in Fig 5.2.
cready @1236, if the data is not directly available, sending them an email requesting it may help. They may, however, refer you to another source.
Alternatively, you can read the caption of the figure, which lists all of the original sources. Following them up may well provide you with the data. I'm not certain, but the data for the first panel may be that in the xcel spreadsheet downloadable at the bottom of this page, for example. You need to be careful about version when going this route. The Lisiecki and Raymo data (sea level) has "...calibrated to global average eustatic sea level (Naish and Wilson, 2009; Miller et al., 2012a)" which may mean you need to go to either of those papers, or perform the recalibration yourself based on those papers.
Sorry if this has already been brought up (I think I can be forgiven for not wanting to read through 1238 comments) but can someone please respond to this? I'm arguing with a denier on Youtube right now.
https://i1.wp.com/s24.postimg.org/bu2hwxlut/Sunspot_Integral_Climate_Wind_Ice.png
To me it seems they're looking at accumulated sunspots (is that what they mean by "integral"?) and if that's the case the graph can never decrease, but it does. Sometime seems off but I want to be precise.
anticorncob6 @1239, if you use an offset (eg, SSN - the mean value of the SSN over a given interval) or normalized sunspot number (eg, (SSN - mean value)/standard deviation), you can get negative values. Integrating will hten allow negative slopes. Clearly if you allow yourself to do that, however, you can potentially generate an infinite number of curves with different values and/or different shapes. Therefore unless you clearly lay out how you did it, and justify the steps - it is always an invalid approach when integrating.
That is particularly the case when you use different offsets, which has clearly been done in this case. In particular, the graph of the comparison with the Southern Annular Mode (bottom left) shows a negative slope for the "sunspot integral" from about 1870 to 1930. Equally clearly, in comparing with global sea ice (bottom right), the "negative sunspot integral" is near flat over the same interval. Clearly a different baseline has been adopted in the two cases, and likely in others as well.
To make it worse, the comparison with global sea ice has clearly been tuned to get that effect. The markings on the y-axis of values from -1 to 1 indicate that these are normalized values, but the "negative sunspot integral" for half of the record is an effectively flat line with a high value. That would not be possible with an integration of the SSN offset by the mean value of the series. Ergo they have chosen some different offset for the reason that it gives that shape to the graph.
As the saying goes, there are lies, damned lies, and statistics as used by climate change deniers.
John Christy recently used a cumulative total solar irradiance (TSI) index to argue that the Sun, not CO2, caused most of the recent global warming. This cumulative-TSI-based approach is flawed, though explaining why is beyond the scope of this post. I instead want to point out how Christy contradicted himself in his defense of his claim.
In the 1st edition of his hotspot blogpost/"report", Christy claims that 150mb is the tropical upper troposphere:
"On the Existence of a “Tropical Hot Spot" & The Validity of EPA’s CO2 Endangerment Finding" (page pages 23, 25, and 59)
But in the 2nd edition of his blogpost/"report", he claims that 150mb is the tropical stratosphere:
"On the Existence of a “Tropical Hot Spot” & The Validity of EPA’s CO2 Endangerment Finding, Abridged Research Report, Second Edition" (pages 24, 25, and 70)
So in the transition from the 1st to the 2nd edition, Christy re-labelled upper tropospheric temperature as stratospheric temperature, with the effect of making it look like the stratosphere warmed. He did this despite the fact that the stratosphere actually cooled (as shown in a source Christy cited in his "report"; see the Sherwood paper cited on page 23 of the "report's" first edition). Christy's re-labeling is convenient for his position, because Christy's solar warming hypothesis implies stratospheric warming. Furthermore, CO2-induced global warming would result in stratospheric cooling, and Christy's "report" is committed to saying that CO2 has had no significant impact on temperature records.
So Christy's self-contradiction on atmospheric temperature, allowed him to claim that CO2 had no significant effect on temperature and that the Sun caused most of the recent global warming. I'm surprised that Christy would cite such a distorted blogpost/"report" to the US Congress:
"U.S. House Committee on Science, Space & Technology, 29 Mar 2017, Testimony of John R. Christy" (pages 10 and 11).
The first sentence in this article by Raymond T. Pierrehumbert debunks any arguments about cumulative TSI:
(my emphasis)
Recommended supplemental reading:
Reduced Energy from the Sun Might Occur by Mid-century; Now Scientists Know by How Much, News, Scripps Institution of Oceanography, Feb 5, 2018
Has anyone considered the wide variety of other influences on the earth besides the Sun and CO2?
Permit me to throw one out here: What about the precititous decline in magnetic field strength of the earth in the last 150 years? Is this not a path for energy from the Sun and beyond to find its way into our atmosphere? It seems to me to be a bit bigger than a "hole in the ozone"...
That is only one of many global situations that might be of concern to a climate concerned scientist.
To lump everything not Sun related into a CO2 bucket seems a bit hasty.
[DB] Given that air is not ferrous, the changes in the magnetic field strength do not amount to much, on the timescales of human lifetimes:
And
SOURCE 1
SOURCE 2
SOURCE 3
Actual scientists have already studied this, summing up 170 years of research into this graphic:
Theodoric - what is lacking is any evidence for other solar changes influencing climate. The magnetic field has fluctuated and reversed throughout earth history without any sort effect on climate such as we see now. By constrast, the effects of GHG increases are precisely what we would expect from well-established physics and changes in GHG throughout earth history is closely linked to climate effects.
"To lump everything not Sun related into a CO2 bucket seems a bit hasty"
That is a straw man argument. Even a cursory reading of just SPM of the IPCC reports would tell you that all known influences on climate are considered.
If you want to argue for some other model for climate, then you need to present evidence. Start by presenting how much extra "energy from Sun and beyond" would heat the earth surface. (Depleting ozone cools the planet by the way)
Hello. I notice that the last post on this topic was ~6.5 years ago. Figure 1 in the overview is very helpful to a lay person newbie like me. Are there any updates from the last few years? Thanks in advance.
Oops, I withdraw my last question.
I discovered this site about a month ago and have been working my way through several of the articles and thousands of comments. The comment traffic on this article has been quite light since mid 2017. Have the skeptics given up this argument?
My layman's absorption of all this is the following (expressed in my layman's language) — it seems that any argument along the lines of "it's current solar activity (of some variety)" is devastated by the broad array of evidence... less incoming radiation being measured, less outgoing radiation measured, nights warming faster than days, winters warming faster than summers. I think I get that, let me know if I missed or mistated something.
Does this array of evidence Is also work against the varieties of "it's past solar activity stored up and now being released", or could such forcings be consistent with the previously stated evidence? Or does that devolve into a war of statistics?
Thanks in advance.
AFT,
My feeling is that the "skeptics" have given up. 10 years ago they argued that it was not warming. Now most of them say they have always said it was warming but the warming will not be bad. They also argue that it will crash the economy to take action even though all peer reviewed studies say it will be beneficial.
Not very many people argue that it is past solar activity stored up. Can you link an example of a serious argument? Scientists have identified the sources of heat. During El Nino some stored heat is released while more heat is stored during La Nina. Longer term storing of heat is global warming. Can you link an example of someone claiming a war of statistics?
Hello Michael — indeed, as a layman observer, I perceive that the battle started at "it's not warming", moved to "it's warming but not us", and is indeed now at "it's not that bad" or "not worth the cost to mitigate".
No, I cannot point to any recent "stored up past solar activity" arguments, I was reacting to those arguments that appeared on this thread.