


 Arguments
Software
Resources
Comments
The Consensus Project
Translations
About
Support
Arguments
Software
Resources
Comments
The Consensus Project
Translations
About
Support
![]()
![]()
![]()
![]()
![]()
![]()
![]()
![]()
![]()
![]()


![]()


Latest Posts
- Skeptical Science New Research for Week #20 2026
- Higher warming predictions for 2026 and 2027
- A look back at ‘An Inconvenient Truth,’ 20 years later
- Two videos about the Atlantic Meriodonal Overturning Circulation (AMOC)
- 2026 SkS Weekly Climate Change & Global Warming News Roundup #19
- EGU2026 - Five days of virtual learning
- Skeptical Science New Research for Week #19 2026
- Climate Adam - Climate Change is Destroying Lives... Now
- EGU2026 - Presentation about the Skeptical Science Experiment
- Fact brief - Were the 2022 whale deaths off the US East Coast caused by offshore wind development?
- 2026 SkS Weekly Climate Change & Global Warming News Roundup #18
- Our new research is published - but we're not done yet with the 'Experiment'
- Skeptical Science New Research for Week #18 2026
- Wildfires used to ‘go to sleep’ at night. Climate change has them burning overtime
- Transition risk: The human cost of net zero
- How strong can a hurricane get in a warming world?
- 2026 SkS Weekly Climate Change & Global Warming News Roundup #17
- The really big picture, in four pictures
- Skeptical Science New Research for Week #17 2026
- EGU2026 - My plans for attending virtually
- Global warming is making the strongest hurricanes stronger
- As Cuba’s grid fails, solar power becomes a lifeline
- 2026 SkS Weekly Climate Change & Global Warming News Roundup #16
- Skeptical Science New Research for Week #16 2026
- Don’t panic: A field guide to the runaway greenhouse
- Human-caused climate change is unmistakably distinct from Earth’s natural climate variability
- What’s cheaper: Fueling your car with gas or electricity?
- 2026 SkS Weekly Climate Change & Global Warming News Roundup #15
- Skeptical Science New Research for Week #15 2026
- What the Iran conflict means for gas prices, clean energy, and the climate
Comment Search Results
Search for sun causing global warming
Comments matching the search sun causing global warming:
- 2025 SkS Weekly Climate Change & Global Warming News Roundup #14
One Planet Only Forever at 08:04 AM on 9 April, 2025This week’s news includes several items in the Climate Change Impacts category about the damaging impact of human-caused global warming and climate change on developed and developing global socioeconomic systems.
- Big Banks Quietly Prepare for Catastrophic Warming
- Global warming of more than 3°C this century may wipe 40% off the world’s economy, new analysis reveals
- Climate crisis on track to destroy capitalism, warns top insurer,
Those articles provide a basis for continuing a discussion here that started on the recent SkS reposting of “Climate skeptics have new favorite graph; it shows the opposite of what they claim”. The comment discussion had evolved away from the topic of the OP. The discussion had shifted to matters related to the development of sustainable improvements for the total global population, now and into the very far future.
The three articles listed above prompted me to expand on my semi-conspiracy theory about the development of opposition to the efforts to increase awareness and improve understanding of how people can be less harmful and more helpful to Others. (see my comment @22 and nigelj’s reply @23 on that SkS reposting linked above)
Additional considerations related to this week’s News items are:
Big Banks Quietly Prepare for Catastrophic Warming:
Quote:
“The recent reports — from Morgan Stanley, JPMorgan Chase and the Institute of International Finance — show that Wall Street has determined the temperature goal is effectively dead and describe how top financial institutions plan to continue operating profitably as temperatures and damages soar.”
Related thoughts:
This suggests that some people who know better are not powerfully raising awareness and improving the understanding of the general population. They are trying to maximize their collective benefit in spite of knowing how harmful their lack of action to limit the global harm done will be. It is like the way that the 2008/9 global financial disaster turned out to be beneficial for many of them (very few of them faced a negative change of status relative to Others – many of them increased their status relative to Others). The least fortunate who got little benefit from the sub-prime mortgage scams suffered the most.
Global warming of more than 3°C this century may wipe 40% off the world’s economy, new analysis reveals
Quote:
“Any impacts from weather events elsewhere, such as how flooding in one country affects the food supply to another, are not incorporated into the models.
Our new research sought to fix this. After including the global repercussions of extreme weather into our models, the predicted harm to global GDP became far worse than previously thought – affecting the lives of people in every country on Earth.”
Related thoughts:
A group of people today have proudly watched a 10% hit happen to global economic activity in a matter of a few days. They think they will be the winners. Everyone will lose because of the unjustified tariff attacks. But the likes of Trump probably think they will suffer less harm that Others will. Some of them may even believe they will benefit from the inequitable unjustifiable actions (paying members of Trump’s Mar-a-Lago Cult could have an unfair advantage if they heard about what the Trump Administration would actual do before it became public knowledge). These type of people would have even less concern about actions they benefit from causing 40% harm to the future economy Others have to live with.
Climate crisis on track to destroy capitalism, warns top insurer
Quote:
“The insurance sector is a canary in the coalmine when it comes to climate impacts,” said Janos Pasztor, former UN assistant secretary-general for climate change.
The argument set out by Thallinger in a LinkedIn post begins with the increasingly severe damage being caused by the climate crisis: “Heat and water destroy capital. Flooded homes lose value. Overheated cities become uninhabitable. Entire asset classes are degrading in real time.”
“We are fast approaching temperature levels – 1.5C, 2C, 3C – where insurers will no longer be able to offer coverage for many of these risks,” he said. ...
“This applies not only to housing, but to infrastructure, transportation, agriculture, and industry,” he said. “The economic value of entire regions – coastal, arid, wildfire-prone – will begin to vanish from financial ledgers. Markets will reprice, rapidly and brutally. This is what a climate-driven market failure looks like.”
Related thoughts:
All of the resistance to the achievement of Sustainable Development Goals, not just resistance to efforts to limit the harm done by climate change impacts, is raising doubts about, and reducing the sustainability of, capitalism (and democracy – given the recent authoritarian ‘winning of unjustified popular beliefs and related abusive power’ in many democracies).
The following time-line of events is part of the basis for my semi-conspiracy theory about the reasons there is such a powerful resistance to learning to be less harmful and more helpful to Others. (note that there are many similar things along the timeline ... since the beginning of recorded human history and more recently)
- 1913 – US 16th Amendment ratified allowing Congress to impose an Income Tax. (Still resisted by many wealthy and influential people who almost certainly know that their resistance is harmfully incorrect. Also resisted by people who are less aware or misunderstand things and have unjustified doubts about the benefits of an Income Tax because they are easily tempted to be misled that way)
- 1933 – 1938 – US New Deal series of reforms (Resisted - See above)
- 1948 – UN Universal Declaration of Human Rights (Resisted - See above)
- 1962 - Silent Spring first published (Resisted - See above)
- 1964 - US Surgeon General report regarding smoking (Resisted - See above)
- 1965 – UN Development Programme - evolved from UN programs that started in 1949 (Resisted - See above)
- 1972 - Stockholm Conference – identified many harmful developed human impacts (Resisted - See above)
- 1990 – IPCC first report (Resisted - See above)
- 2020 – COVID19 – (Influential people opposed to learning to be less harmful and more helpful to Others found new ways to maximize their ability to benefit from being misleading)
Constantly improving global civilization is not a guarantee. It is very hard work to limit the harm done by people who resist learning to be less harmful and more helpful to Others. They know better, but do not care about how harmful their actions and lack of actions are.
- Fact brief - Can CO2 be ignored because it’s just a trace gas?
One Planet Only Forever at 05:00 AM on 27 January, 2025Evan @6,
Your make a good point about the sensitivity of our amazing planet’s global climate conditions. It has prompted the following thoughts regarding attempts to ignore or dismiss CO2 impacts ...
The warming impact of increased levels of CO2 have been understood for more than 125 years. And the natural causes of glaciation and inter-glacial periods, like the Milankovitch cycles, have been reasonably understood for more than 80 years.
A challenging understanding, an inconvenient truth, is that human CO2 impacts causing global warming may be helpful in the future but are not helpful now. Those distant future actions could make the next natural glaciation event more ‘livable’.
The next glaciation is expected to naturally happen about 50,000 years from now. But studies, like the one reported in the Carbon Brief in 2016: Human emissions will delay next ice age by 50,000 years, indicate that the human caused increased CO2 levels have likely delayed the next glaciation by 50,000 years. That is nothing to be proud of. It was Too Much Too Soon.
It would be ‘great’ if lots of easy to access fossil fuels were still available for future humans to use to limit the negative impacts of future glaciations.
Fossil fuels are undeniably non-renewable. Future generations cannot benefit from burning them as much as current generations do. Rapidly ending fossil fuel use would leave more ‘limited resources’ for the benefit of future generations and reduce the climate change harm done to people today and to future generations. However, the ‘competitive marketplace’ fails to ‘naturally’ develop towards those understandably ‘great’ objectives. In fact, there is ample evidence that the marketplace developed, and continues to develop, misinformation efforts against the development of such ’helpful external influences on the marketplace’.
The undeniable marketplace efforts against learning to be less harmful and more helpful to Others clarifies what competitive free market activity can be expected to accomplish. The fundamental market function is managing the distribution and benefits from the use of scarce resources. It develops replacement alternatives as resources become scarcer. However, the marketplace will only seriously develop replacements that are less expensive than the increased cost of the activities that rely on scarcer resources (note political efforts to reduce the costs of fossil fuels).
More importantly, the market is unlikely to care to reduce harm or ensure that harm done is repaired. Limiting harm done, and avoiding the challenge of getting the beneficiaries of harm done to repair the damage done, requires external influence to make the more harmful ways less popular, more difficult, and more expensive.
Hopefully efforts to limit the success of misinformation, not just regarding climate science, will result in more helpful and less harmful political action. It is common sense that political actions need to be less likely to cycle in ways that are significantly negative for the future of humanity. However, limiting the sensitivity of political actions to harmful misunderstandings is likely less certain than improving the understanding of the sensitivity of the climate on this amazing planet to the impacts of human activity.
Scientific understanding is certain to be constantly improving the ability to develop sustainable improvements and limit harm done - The politics of popularity of beliefs is not certain to develop sustainable improvements or limit harm done.
- Fact brief - Are we heading into an 'ice age'?
AdriantheHistorian at 01:32 AM on 23 December, 2024Skeptical Science asks that you review the comments policy. Thank you.
[snip]
TODAY!......... Climate Shift. ..??.. DID the “NEW ICE AGE”, Climate Fanatics of the 1970’s CAUSE the so-called, “Climate Shift” Crises of Today?
(Scientists say sprinkling diamond dust into the sky could offset almost all of climate change so far — but it'll cost $175 trillion)
Story by Sascha Pare 12-19-2024
Sprinkling diamond dust into the atmosphere could offset almost all the warming caused by humans since the industrial revolution and "buy us some time" with climate change, scientists say.
[This is Funny as the ''Climate Craze'' back in the 1970's was the New Ice Age..... Yes ''they'' said that Pollution (partials) were being thrown up into the upper atmosphere and causing the suns light to be reflected back into space., This was causing a New Ice Age to destroy the Earth.
Note; To STOP this New Ice Age, the USA went 'seriously' into protecting the 'Environment' way back in the 1970's with President Nixon signing the Environmental Protection Act (EPA) into law.
Today the USA only produces as much steel as it did in 1950, this is as an example of those EPA efforts.
High Gas Prices?.. EPA will Not allow a New Oil refinery to be built in America.
Etc. Etc.
And this is also a major reason for the loss of Millions of very good paying jobs, I might add. 'clean', comes with a very steep 'price'.]
Continued.
New research indicates that shooting 5.5 million tons (5 million metric tons) of diamond dust into the stratosphere every year could cool the planet by 1.8 degrees Fahrenheit (1 degree Celsius) thanks to the gems' reflective properties. This extent of cooling would go a long way to limiting global warming that began in the second half of the 19th century and now amounts to about 2.45 F (1.36 C), according to NASA.
The research contributes to a field of geoengineering that's looking for ways to fight climate change by reducing the amount of energy reaching Earth from the sun.
https://www.msn.com/en-us/weather/topstories/scientists-say-sprinkling-diamond-dust-into-the-sky-could-offset-almost-all-of-climate-change-so-far-but-it-ll-cost-175-trillion/ar-AA1w6MuP?ocid=msedgntp&pc=HCTS&cvid=2dfb5c2f1669448799854ec819ce98bf&ei=43
- Stop emissions, stop warming: A climate reality check
AdriantheHistorian at 01:36 AM on 20 December, 2024Skeptical Science asks that you review the comments policy. Thank you.
[snip]
TODAY!......... Climate Shift. ..??.. DID the Climate Fanatics of the 1970’s CAUSE the Climate Crises of Today?
Funny as the ''Climate Craze'' back in the 1970's was the New Ice Age..... Yes ''they'' said that Pollution (partials) were being thrown up into the upper atmosphere and causing the suns light to be reflected back into space., This was causing a New Ice Age to destroy the earth.
(Scientists say sprinkling diamond dust into the sky could offset almost all of climate change so far — but it'll cost $175 trillion)
Story by Sascha Pare 12-19-2024
Today those same people (Rainmakers) are selling yet another climate ''Crises''.
Note; To STOP this New Ice Age, the USA went 'seriously' into protecting the 'Environment' way back in the 1970's with President Nixon signing the Environmental Protection Act (EPA) into law.
Today the USA only produces as much steel as it did in 1950, this is as an example of those EPA efforts.
High Gas Prices?.. EPA will Not allow a New Oil refinery to be built in America.
And this is also a major reason for the loss of Millions of very good paying jobs, I might add. 'clean', comes with a very steep 'price'.
Even IF the ‘Clean’ is ONLY here and all that pollution was just Moved to China, along with all the Jobs.
Good thing we don’t use the same Air as the Chinese. Otherwise it would ALL have been a waste of time and Money.
TODAY!......... Climate Shift. ..??.. DID the Climate Fanatics of the 1070 CAUSE the Climate Crises of Today?
(Scientists say sprinkling diamond dust into the sky could offset almost all of climate change so far — but it'll cost $175 trillion)
Story by Sascha Pare 12-19-2024
Sprinkling diamond dust into the atmosphere could offset almost all the warming caused by humans since the industrial revolution and "buy us some time" with climate change, scientists say.
New research indicates that shooting 5.5 million tons (5 million metric tons) of diamond dust into the stratosphere every year could cool the planet by 1.8 degrees Fahrenheit (1 degree Celsius) thanks to the gems' reflective properties. This extent of cooling would go a long way to limiting global warming that began in the second half of the 19th century and now amounts to about 2.45 F (1.36 C), according to NASA.
The research contributes to a field of geoengineering that's looking for ways to fight climate change by reducing the amount of energy reaching Earth from the sun.
https://www.msn.com/en-us/weather/topstories/scientists-say-sprinkling-diamond-dust-into-the-sky-could-offset-almost-all-of-climate-change-so-far-but-it-ll-cost-175-trillion/ar-AA1w6MuP?ocid=msedgntp&pc=HCTS&cvid=2dfb5c2f1669448799854ec819ce98bf&ei=43
- There is no consensus
Rob Honeycutt at 09:25 AM on 22 April, 2023Okay, let's go over this again, Albert.
The premise of the paper is as stated in the introduction.
We examined a large sample of the scientific literature on global CC, published over a 21 year period, in order to determine the level of scientific consensus that human activity is very likely causing most of the current GW (anthropogenic global warming, or AGW).
Do you honestly not see the words: human activity is very likely causing most of the current AGW?
That statement creates the fundamental basis of papers that either endorse or minimize that position.
If you're telling me that most "skeptics" agree that human activity is very likely causing most of the current GW... hey! We're good!
"It is a clear indication that only 1.6% of the papers thought that humans were causing most of warming."
Nope, precisely because categories 1, 2 and 3 all endorse the idea that human activity is very likely causing most of the current GW.
"...AMS in 2016 and it explicitly asked members if they vpbelieved humans were responsible for the majority of warming and 67% said yes."
And they also explain that most of their members were NOT experts in climate science and do not publish climate research. The greater their expertise, the greater their level of agreement, with the highest level of expertise also demonstrating ~97% agreement with the idea that human activity is very likely causing most of the current GW.
"...why Cook went to considerable lengths to hide the category numbers."
He didn't.
"I am passionate about truth in science..."
Clearly, quite the opposite.
"...I have an open mind on all matters..."
As Carl Sagan used to say, "It's good to keep an open mind, but not so much that your brain falls out." I think that perfectly describes your position in this matter.
"In the sixteenth century, 99.9% of scientists believed the Sun orbited the Earth."
No, it was 16th century scientists who were explaining to people the earth orbited the sun. Once presented within a scientific/mathematical structure, scientists of the day readily accepted this fact.
"i Won't be commenting on this thread again."
We are relieved.
- There is no consensus
Albert22804 at 09:03 AM on 22 April, 2023"a) If you had bothered to read the actual paper it's explained why the figures are organized as they are."
I have read the paper multiple times and the so called explanation groups 1,2 and 3 together and compares them to groups 5 6 and 7 and as I have said, most sceptics would be in group 3.
The "minimise" option Is a red herring as most sceptics believe in an ECS of 1.2C which is both group 3 and groups 56 and 7.
"b) Your 1.6% figure only relates to papers that explicitly quantify human contribution. With that you'd have to compare that to other papers that explicitly minimize human contribution."
Nonsense. It is a clear indication that only 1.6% of the papers thought that humans were causing most of warming.
You can't count, for example, a paper that explicitly quantifies against a paper that implicitly endorses human contribution.
Nomsense. Most sceptics who write papers would be in several categories and that is the lie in Cooks paper.
The only time that a scientific organisation has polled its members was by the AMS in 2016 and it explicitly asked members if they vpbelieved humans were responsible for the majority of warming and 67% said yes.
They didn't play the pretend game of setting up false categories and compare warmists against sceptics like Cook did.
The AMS were extremely embarrassed by this and tried to spin the result saying it was misinterpreted blah blab blah but since this no scientific body has ever dared poll their members again.
Roh you still havenot explained why Cook went to considerable lengths to hide the category numbers. It took me a couple of days to eventually figure out how to chuck the file into a spreadsheet and extract the totals.
I am passionate about truth in science, you're not, so let's just agree to disagree.
PS engaged with you on this subject because I have an open mind on all matters and wanted to read whether there were aspects of the "97%" I wasn't aware of, but your comments show me that there aren't.
Last comment
A few years ago the Australian sceptic society had a comment on their home page saying nothing was exempted from scepticism but also had a manifesto on global warming saying the science was settled and gave theit reasons.
I went through the manifesto line by line discrediting it by referring to data and submitted it. However next day it had disappeared and I contacted the editor and he said he had passed it on to "experts" to see if it was valid. He said he would get back to me but never did.
So a sceptic society now determines what you can be sceptical about. You can challenge the theories of Newton and Einstein but not the high church of climate change. That makes it a faith, not science.
Very last comment
In the sixteenth century, 99.9% of scientists believed the Sun orbited the Earth.
i Won't be commenting on this thread again.
- The Big Picture
One Planet Only Forever at 13:32 PM on 17 March, 2023I believe that it is important (and may be helpful) to reasonably (rationally) evaluate (question) the following questionable (interesting) claims that have been made:
1. The increase of CO2 has been caused by the growth of global population (from 1 billion to 8 billion).
JasonChen and Peppers have both made versions of this claim in this comment string.
There does appear to be a correlation. But correlation does not mean causation. The details within the full picture of human population impacts are important to understand.
Not every human has caused, or benefited from, an equal amount of harmful impact. And the personal difference of magnitude of impact among the global population is massive. A multitude of evaluations, enough to establish a consensus understanding, conclude that the majority of the ‘CO2/global warming/climate change’ impact is due to the highest impacting portion of the population (and any population sub-group).
Said another way: If the highest impacting 800 million of the global population were the only humans to live, global population peaked at 800 million rather than having the global population grow to 8 billion, the climate change problem today would be almost as serious as it currently is with 8 billion now on the planet. And the solution would still be 'rapidly ending fossil fuel use', especially by the highest impacting portion of the 800 million.
The problem is the highest impacting portion of the population and their bad examples of how to live being perceived as ‘advanced, superior, and desired’.
2. Helpful developments for the benefit of (the future of) humanity require(d) fossil fuel use.
JasonChen and Peppers have both made versions of this claim in this comment string.
Fossil fuel use burns up non-renewable resources. This planet could be habitable for hundreds of millions of years. At current levels of use, fossil fuels will not last 1000 years. Perceptions that helpful development is achieved through fossil fuel use makes no sense. Any benefits ‘relying on continued fossil fuel use’ will end as the resource runs out. And there is the added matter of the many harms caused by fossil fuel use, not just the rapid production of excess CO2 causing rapid global warming/climate changes and changes of ocean chemistry.
3. Perceptions that helpfulness justify harmfulness.
When people focus on claiming perceptions of the positive benefits of fossil fuel use they are essentially claiming that perceptions of benefit justify or excuse harm done. They may also try to deny that harm is being done by what they perceive to be a positive action. Or they may try to argue that more evidence that harm is being done needs to be obtained before action is taken to limit the harm done (Waiting until the actual damage done is undeniable ‘based on their perceptions’: Waiting until the car crashes before trying to reduce the chances of a car crash). Or they may try to argue that the harm done is acceptable or enjoyable (that car race was thrilling ...).
4. Perceptions of potential personal benefit can cause a person to resist learning to be less harmful and be more helpful to Others (and even themselves).
This is the tricky bit. When a person is confronted with evidence that something they have developed a desire and preference for is harmful or risks causing avoidable harm some people will learn to be less harmful and more helpful. But some people will try to argue against the real and potential harm. They will seek out and develop a liking for a misunderstanding that they believe excuses or diminishes the harmfulness of a ‘perceived to be personally beneficial’ activity like fossil fuel use.
- It's not bad
Eclectic at 09:29 AM on 20 February, 2023PollutionMonster @409 ,
Good luck with your battle against the science-deniers. As you have noticed, they use all sorts of poor logic and see-the-tree-but-ignore-the-forest stuff. They are emotionally driven ~ as you must be, if you wish to entertain yourself by crossing swords with them in public.
Your task of course is to persuade the onlookers, not the intransigent Denialists. My humble advice is to Keep It Simple.
A/ The observed Stratospheric Cooling is a great argument : being proof that it is not The Sun causing modern global warming. And the Stratospheric Cooling was successfully predicted by "models" of 80-ish years ago.
B/ The observed sea level rise is great proof of actual global warming (Denialists try to deflect on to the gray area of "but the rise is not accelerating" or the rubbishy "it's just rebound from the Little Ice Age".) Also you can mention the coastal measurements by Kulp & Strauss [2019] showing that a 1 meter sea level rise would displace 230 million people (Denialists hate the idea of refugees & migrants).
C/ When pressed to declare what the perfect climate is ~ I state the climate of 1950 A.D. (Easy to defend.)
These sorts of arguments suit my simple brain, and are difficult to counter by sophists, bloviators & other trollish propagandists.
- Skeptical Science New Research for Week #50 2022
peterklein at 07:12 AM on 16 December, 2022I mostly became mostly aware of the climate and global warming issue about the time that Al Gore began beating the drum (even while he continued to fly globally in his private jet). Since then, I've read about climate change and climate modeling from many sources, including ones taking the position that ‘it is not a question if it is a big-time issue, but what to do about it now, ASAP?’.
In the past few weeks, it appeared to me there has been a of articles, issued reports, and federal government activity, including recently approved legislation, related to this topic. While it obviously has been one of the major global topics for the past 3+ decades, the amount of public domain ‘heightened activity’ seems (to me) to come in waves every 4-6 months. That said, I decided to write on the topic based on what I learned and observed over time from articles, research reports, and TV/newspaper interviews.
There clearly are folks, associations, formal and informal groups, and even governments on both sides of the topic (issue). I also have seen over the decades how the need for and the flow of money sometimes (many times?) taints the results of what appear to be ‘expert-driven and expert-executed’ quantitative research. For example, in medical research some of the top 5% of researchers have been found altering their data and conclusions because of the source of their research funding, peer ‘industry’ pressure and/or pressure from senior academic administrators.
Many climate and weather-related articles state that 95+% of researchers agree on major climate changes; however (at least to me) many appear to disagree on the short-medium-longer term implications and timeframes.
What I conclude (as of now)
1. This as a very complex subject about which few experts have been correct.
2. We are learning more and more every day about this subject, and most of what we learn suggests that what we thought we knew isn't really correct or at least as perfectly accurate as many believe.
3. The U.S. alone cannot solve whatever problem exists. If we want to do something constructive, build lots of nuclear power plants ASAP (more on that to follow)!
4. Any rapid reduction in the use of fossil fuels will devastate many economies, especially those like China, India, Africa and most of Asia. Interestingly, the U.S. can probably survive a 3 or 4% reduction in carbon footprint annually over the next 15 years better than almost any country in the world, but this requires the aforementioned construction of multiple nuclear electrical generating facilities. In the rest of the world, especially the developing world, their economies will crash, and famine would ensue; not a pretty picture.
5. I am NOT a reflexive “climate denier” but rather a real-time skeptic that humans will be rendered into bacon crisps sometime in the next 50, 100 or 500+ years!
6. One reason I'm not nearly as concerned as others is my belief in the concept of ‘progress’. Look at what we accomplished as a society over the last century, over the last 50, 10, 5 and 3 years (e.g., Moore’s Law is the observation that the number of transistors on integrated circuits doubles about every two years!). It is easy to conclude that we will develop better storage batteries and better, more efficient electrical grids that will reduce our carbon footprint. I'm not so sure about China, India and the developing world!
7. So, don't put me down as a climate denier even though I do not believe that the climate is rapidly deteriorating or will rapidly deteriorate as a result of CO2 upload. Part of my calm on this subject is because I have read a lot about the ‘coefficient of correlation of CO2 and global warming, and I really don't think it's that high. I won't be around to know if I was right in being relaxed on this subject, but then I have more important things to worry about (including whether the NY Yankees can beat Houston in the ACLS playoffs, assuming they meet!).
My Net/Net (As of Now!)
I am not a researcher or a scientist, and I recognize I know far less than all there is to know on this very complex topic, and I am not a ‘climate change denier’… but, after
also reading a lot of material over the years from ‘the other side’ on this topic, I conclude it is monumentally blown out of proportion relative to those claiming: ‘the sky is falling and fast’!
• Read or skim the book by Steven Koonin: Unsettled: What Climate Science Tells Us, What It Doesn't, and Why It Matters /April 27, 2021; https://www.amazon.com/Unsettled-Climate-Science-Doesnt-Matters/dp/1950665798
• Google ‘satellite measures of temperature’; also, very revealing… see one attachment as an example.
• Look at what is happening in the Netherlands and Sri Lanka! Adherence to UN and ESG mandates are starving countries; and it appears Canada is about to go over the edge!
• None of the climate models are accurate for a whole range of reasons; the most accurate oddly enough is the Russian model but that one is even wrong by orders of magnitude!
• My absolute favorite fact is that based on data from our own governmental observation satellites: the oceans have been rising over the last 15 years at the astonishing rate of 1/8th of an inch annually; and my elementary mathematics suggests that if this rate continues, the sea will rise by an inch sometime around 2030 and by a foot in the year 2118… so, no need to buy a lifeboat if you live in Miami, Manhattan, Boston, Los Angeles, or San Francisco!
• Attached is a recent article and a Research Report summary.
Probably the most damning is the Research Report comparison of the climate model predictions from 2000, pointing to 2020 versus the actual increase in temperature that has taken place in that timeframe (Pages 9-13). It's tough going and I suggest you just read the yellow areas on Page 9 (the Abstract and Introduction, very short) and the 2 Conclusions on Page 12. But the point is someone is going to the trouble to actually analyze this data on global warming coefficients!
My Observations and Thinking
In the 1970s Time Magazine ran a cover story about our entering a new Ice Age. Sometime in the early 1990s, I recall a climate scientist sounding the first warning about global warming and the potentially disastrous consequences. He specifically predicted high temperatures and massive floods in the early 2000’s. Of course, that did not occur; however, others picked up on his concern and began to drive it forward, with Al Gore being one of the primary voices of climate concern. He often cited the work in the 1990’s of a climate scientist at Penn State University who predicted a rapid increase in temperature, supposedly occurring in 2010 and, of course, this also did not occur.
Nonetheless many scientists from various disciplines also began to warn about global warming starting in the early 2000’s. It was this growing body of ‘scientific’ concern that stimulated Al Gore's concern and his subsequent movie. It would be useful for you to go back to that and review the apocalyptic pronouncements from that time; most of which predicted dire consequences, high temperatures, massive flooding, etc. which were to occur in 10 or 12 years, certainly by 2020. None of this even closely occurred to the extent they predicted.
That said, I was still generally aware of the calamities predicted by a large and diverse body of global researchers and scientists, even though their specific predictions did not take place in the time frame or to the extent that they predicted. As a result, I become a ‘very casual student’ of climate modeling.
Over the past 15 years climate modeling has become a popular practice in universities, think-tanks and governmental organizations around the globe. Similar to medical and other research (e.g., think-tanks, etc.) I recognized that some of the work may have been driven by folks looking for grants and money to keep them and their staff busy.
A climate model is basically a multi-variate model in which the dependent variable is global temperature. All of these models try to identify the independent variables which drive change in global temperature. These independent variables range from parts per million of carbon dioxide in the atmosphere to sunspot activity, the distance of the earth from the sun, ocean temperatures, cloud cover, etc. The challenge of a multi-variant model is first to identify all of the various independent variables affecting the climate and then to estimate the percent contribution to global warming made by a change in any of these independent variables. For example, what would be the coefficient of correlation for an increase in carbon dioxide parts per million to global warming?
You might find that an interesting cocktail party question to ask your friends “what is the coefficient of correlation between the increase in carbon dioxide parts per million and the effect on global warming?” I would be shocked if any of them even understood what you were saying and flabbergasted if they could give you an intelligent answer! There are dozens of these climate models. You might be surprised that none of them has been particularly accurate if we go back 12 years to 2010, for example, and look at the prediction that the models made for global warming in ten years, by 2020, and how accurate any given model would be.
An enterprising scientist did go back and collected the predictions from a score of climate models and found that a model by scientists from Moscow University was actually closer to being accurate than any of the other models. But the point is none were accurate! They all were wrong on the high side, dramatically over predicting the actual temperature in 2020. Part of the problem was that in several of those years, there was no increase in the global temperature at all. This caused great consternation among global warming believers and the scientific community!
A particularly interesting metric relates to the rise in the level of the ocean. Several different departments in the U.S. government actually measures this important number. You might be surprised to know, as stated earlier, that over the past 15 or so years the oceans have risen at the dramatic rate of 1/8th of an inch annually. This means that if the oceans continued to rise at that level, we would see a rise of an inch in about 8 years, sometime around 2030, and a rise of a foot sometime around the year 2118. I suspect Barack Obama had seen this data and that's why he was comfortable in buying an oceanfront estate on Martha's Vineyard when his presidency ended!
The ‘Milankovitch Theory’ (a Serbian astrophysicist Milutin Milankovitch, after whom the Milankovitch Climate Theory is named, proposed about how the seasonal and latitudinal variations of solar radiation that hit the earth in different and at different times have the greatest impact on earth's changing climate patterns) states that as the earth proceeds on its orbit, and as the axis shifts, the earth warms and cools depending on where it is relative to the sun over a 100,000-year, and 40,000-year cycle. Milankovitch cycles are involved in long-term changes to Earth's climate as the cycles operate over timescales of tens of thousands or hundreds of thousands of years.
So, consider this: we did not suddenly get a lot more CO2 in the atmosphere this year than we had in 2019 (or other years!), but maybe the planet has shifted slightly as the Milankovitch Theory states, and is now a little closer to the sun, which is why we have the massive drought. Nothing man has done would suddenly make the drought so severe, but a shift in the axis or orbit bringing the planet a bit closer to the sun would. It just seems logical to me. NASA publicly says that the theory is accurate, so it seems that is the real cause; but the press and politicians will claim it is all man caused! You can shut down all oil production and junk all the vehicles, and it will not matter per the Theory! Before the mid-1800’s there were no factories or cars, but the earth cooled and warmed, glaciers formed and melted, and droughts and massive floods happened. The public is up against the education industrial complex of immense corruption!
In the various and universally wrong ‘climate models’, one of the ‘independent’ variables is similar to the Milankovitch Theory. Unfortunately, it is not to the advantage of the climate cabal to admit this or more importantly give it the importance it probably deserves.
People who are concerned about the climate often cite an ‘increase in forest fires, hurricanes, heat waves, etc. as proof of global warming’. And many climate deniers point out that most forest fires are proven to be caused by careless humans tossing cigarettes into a pile of leaves or leaving their campfire unattended, and that there has been a dramatic decrease globally on deaths caused by various climate factors. I often read from climate alarmists (journalists, politicians, friends, etc.), what I believe are ‘knee-jerk’ responses since they are not supported by meaningful and relevant data/facts, see typical comments below:
• “The skeptical climate change deniers remind me of the doctors hired by the tobacco industry to refute the charges by the lung cancer physicians that tobacco smoke causes lung cancer. The planet is experiencing unprecedented extreme climate events: droughts, fires, floods etc. and the once in 500-year catastrophic climate event seems to be happening every other year. Slow motion disasters are very difficult to deal with politically. When a 200-mph hurricane hits the east coast and causes a trillion dollars in losses then will deal with it and then climate deniers will throw in the towel!”
These above comments may be right, but to date the forecasts on timing implications across all the models are wrong! It just ‘may be’ in 3, 10 or 50 years… or in 500-5000+ before the ‘sky is falling’ devastating events directly linked to climate occur. If some of the forecasts, models were even close to accuracy to date I would feel differently.
I do not deny there are climate related changes I just don’t see any evidence their impact is anywhere near the professional researchers’ forecasts/models on their impact as well as being ‘off the charts’ different than has happened in the past 100-1000+ years.
But a larger question is “suppose various anthropogenetic actions (e.g., chiefly environmental pollution and pollutants originating in human activity like anthropogenic emissions of sulfur dioxide) are causing global warming?”. What are they, who is doing it, and what do we do about it? The first thing one must do is recognize that this is a global problem and that therefore the actions of any one country has an effect on the overall climate depending upon its population and actions. Many in the United States focus intensely upon reducing carbon emissions in the U.S. when of course the U.S. is only 5% of the world population. We are however responsible for a disproportionate part of the global carbon footprint; we contribute about 12%. The good news is that the U.S. has dramatically reduced its share of the global carbon footprint over the past 20 years and doing so while dramatically increasing our GDP (up until the 1st Half of 2022).
Many factors have contributed to the relative reduction of the U.S. carbon footprint. Chief among these are much more efficient automobiles and the switch from coal-driven electric generation plants to those driven by natural gas, a much cleaner fossil fuel.
While the U.S. is reducing its carbon footprint more than any other country in the world, China has dramatically increased its carbon footprint and now contributes about 30% of the carbon expelled into the atmosphere. China is also building 100 coal-fired plants!
Additional facts, verified by multiple sources including SNOPES, the U.,S. government, engineering firms, etc.:
• No big signatories to the Paris Accord are now complying; the U.S. is out-performing all of them.
• EU is building 28 new coal plants; Germany gets 40% of its power from 84 coal plants; Turkey is building 93 new coal plants, India 446, South Korea 26, Japan 45, China has 2363 coal plants and is building 1174 new ones; the U.S. has 15 and is building no new ones and will close about 15 coal plants.
• Real cost example: Windmills need power plants run on gas for backup; building one windmill needs 1100 tons of concrete & rebar, 370 tons of steel, 1000 lbs of mined minerals (e.g., rare earths, iron and copper) + very long transmission lines (lots of copper & rubber covering for those) + many transmission towers… rare earths come from the Uighur areas of China (who use slave labor), cobalt comes from places using child labor and use lots of oil to run required rock crushers... all to build one windmill! One windmill also has a back-up, inefficient, partially running, gas-powered generating plant to keep the grid functioning! To make enough power to really matter, we need millions of acres of land & water, filled with windmills which consume habitats & generate light distortions and some noise, which can create health issues for humans and animals living near a windmill (this leaves out thousands of dead eagles and other birds).
• So, if we want to decrease the carbon footprint on the assumption that this is what is driving the rise in the sea levels (see POV that sea levels are not rising at: www.tiktok.com/t/ZTRChoNTg) and any increase in global temperature, we need to figure out how to convince China, India and the rest of the world from fouling the air with fossil fuels. In fact, if the U.S. wanted to dramatically reduce its own carbon footprint, we would immediately begin building 30 new nuclear electrical generating plants around the country! France produces about 85% of its electrical power from its nuclear-driven generators. Separately, but related, do your own homework on fossil fuels (e.g., oil) versus electric; especially on the big-time move to electric and hybrid vehicles. Engineering analyses show you need to drive an electric car about 22 years (a hybrid car about 15-18 years) to breakeven on the savings versus the cost involved in using fossil fuels needed to manufacture, distribute and maintain an electric car! Also, see page 14 on the availability inside the U.S. of oil to offset what the U.S. purchases from the middle east and elsewhere, without building the Keystone pipeline from Canada.
Two 4-5-minute videos* on the climate change/C02/new green deal issue, in my opinion, should be required viewing in every high school and college; minimally because it provides perspective and data on the ‘other’ side of the issue while the public gets bombarded almost daily by the ‘sky is falling now or soon’ side on climate change!
* https://www.prageru.com/video/is-there-really-a-climate-emergency and
https://www.prageru.com/video/climate-change-whats-so-alarming - Skeptical Science New Research for Week #43 2022
Art Vandelay at 16:55 PM on 9 November, 2022MA Rodger @ 23.. "The carbon cycle is estimated to include an annual 120Gt(C) flux from the biosphere to the atmosphere suggesting human beings provide directly 0.6% of that flux. This is far smaller than the proportion being bandied about by commenter Art Vandelay."
That's a misundersting on your part. I expressed CO2 from human respiration as a percentage of human emissions, not total flux.
Above and beyond the use of fossil fuels, the impact of humanity indirectly on the size of that 120Gt(C) flux (by replacing natural ecosystems with agriculture & pasture) and any resulting impact that change in size would have on the CO2 levels in the atmosphere is seperate consideration which is yet to be properly set out by commenter Art Vandelay."
There's no shortage of published studies, and some have shown that as much as a third of atmospheric CO2 the result of human activity other than fossil fuel combustion. I would hope that the significance of this would be embraced as we move away from fossil fuel consumption, and with certainty of population growth and a further 6 billion added to a 'developed world'.
"Feel free to continue to flaunt your ignorance."
And lets all feel free to discuss with civility and respect.
One planet Only @ 25..
"But the rate of fossil fuel use, along with other human activity impacts (not the exhaling of CO2 which is simply a small part of the already established carbon cycle) is undeniably causing a significant increase of CO2 levels in the atmosphere and related global warming and related climate changes."
Of course it is, and that's why there's a global focus and commitment to remedy that situation.
The better way to make the point may be that what Art claims to have learned from a Professor of Geology is potentially Art fooling themself about the matter.
For what it's worth, the same geologist is also of the view that cows are a contributing factor to climate change, even though they too, like us, are part of the natural carbon cycle. Assuming the number of cattle is static their contribution to rising greenhouse gas is zero.
So are cows a problem or not?
- 2022 SkS Weekly Climate Change & Global Warming News Roundup #37
One Planet Only Forever at 04:09 AM on 10 October, 2022Eagle the Greek,
My initial reaction to your comment was to ask for clarification, and specific examples, regarding your belief that "Both side of the argument have big misunderstandings".
But, upon further consideration of your entire comment from the perspective of the pursuit of increased awareness and improved understanding of how to sustainably improve things for the future of humanity, I wish to provide the following context as the reasonable common sense basis for your response.
Human activity can undeniably influence the environment of this planet on a local and global scale. But it is unlikely that humans will even learn enough to accurately control the results of human development impacts. The environment, local and global, is amazingly complex. It was not just made for humans to do whatever they wish with. The best that can be hoped for from humans, with their ability for thoughtfulness, is increased awareness and improved understanding of unsustainable harmful activity governing leadership actions to limit the harm done by people who have developed a liking for 'other interests' which keeps them from helpfully self-governing, keeps them from learning to be less harmful and more helpful members of global humanity.
Human actions add up. So everyone needs to be helped to limit harm done. Being a better person would also involve being more helpful to others, not just less harmful, to help develop a sustainable improving future for all of global humanity. Admittedly that may require some supposedly higher status humans to lose some developed perceptions of superiority.
Human actions can be negative or positive from the perspective of developing sustainable ways of living and sustainable improvements. And it is undeniable that a lot of negative (harmful unsustainable) activity has developed, especially by the supposedly more advanced portion of the global population.
With that understanding as the context, please elaborate on your belief that there are "big misunderstandings" on both sides of the CO2 debate, understanding that CO2 impacts are not the only human activities causing rapid ∆T. The response also needs to be consistent with the awareness and understanding of all the other harmful unsustainable impacts of human activity which includes many other harmful impacts of fossil fuel use, not just the increase of CO2 levels.
And, of course, a reasonable response would also be consistent with the understanding that fossil fuels are not renewable. Future generations will have to live without benefiting from burning them. And an challenging perspective is that human impacts causing slight global warming may be helpful in the future by limiting the changes of the next natural glaciation event. That next glaciation is expected to be at least 50,000 years away (lots of studies indicate that approximate date. But some studies have indicated that the warming impact to date is delaying the onset of the next glaciation to be about 100,000 years from now.
It would be great if lots of easy to access fossil fuels were available at that time for humans to cautiously limit the challenges of that next natural glaciation. And the other benefits of rapidly ending fossil fuel use to leave the stuff for those distant future generations are the reduced harm done today and to generations in the more immediate future.
- How to inoculate yourself against misinformation
nigelj at 13:10 PM on 2 July, 2022David-acct @14
"I have to agree with petra regarding the free exchange of information even if misleading."
I mostly agree with this. While I deplore misinformation, organisations trying to censor everything that could be misinformation creates obvious problems of excessively suppressing free speech. Its generally better to have things out there where they can be debated.
However I do think a small number of exceptions can be made. We already have defamation laws if people falsely accuse other people of certain things and so I can understand websites being reluctant to post highly defamatory statements. And our media In New Zealand do not publish claims that covid vaccines dont work, or that covid is not worse than a common cold, because it risks causing low uptake of vaccines and massive pressure on hospitals. They do allow a lively public debate on the covid issue in general, including posting material that is contested but they have some limits. The media are walking a fine line, but I see no practical alternative that would make sense and be useful.
Free speech just isn't a simplistic issue to me. I think western countries do ok with free speech overall. If you want real supression of free speech look at China, Russia or N Korea.
"What happens in a decade or so if scientists discover a forcing that is a greater factor than co2 as the primary driver of warming. The censorship of that discovery as "misinformation " ..."
But its very unlikely anyone would censor a genuine discovery like that. It would be reported in the peer reviewed literature and this is not "censored" by governmnets and anyone else for that matter. Studies (of dubious merit) trying to claim global warming is being caused by the sun or adiabatic pressure have been published. Media already publish results of peer reviewed studies of all types.
"Nigel - you mention covid ( an i like dont like the covid deniers). the being said, the CDC has been one of the prime movers of misleading and deceptive studies on covid, ranging from the effectiveness of masking, effectiveness of vaccines, boosters, etc. The CDC has lost a tremendous amount of credibility when they are supposed to be the experts. "
You are assuming the CDC studies were misleading or deceptive. You provide no evidence they were those things. Misinformation suggests spreading information known to be wrong, or spreading junk science, or making ignorant statements. I doubt the CDC did that. It looks to me like they were simply wrong. Perhaps they were negligent but nobody has demonstrated that. I believe there is a difference in being wrong and spreading misinformation. We have different words like misinformation, wrong or incorrect information.
But the CDC certainly had some strange ideas about masks. Its almost obvious that masks would at least reduce the viral load gulped down into the lungs, and this can only be a good thing. I was mystified when suggestions were made that masks weren't much use and I wasn't sure whether to believe that or not.
"When the experts try to label scientific inquiries as misinformation, they come across as trying to hide something"
I do not know of anyone doing that. Who specifically is doing that?
- The problem of growth in a finite world
One Planet Only Forever at 12:48 PM on 3 March, 2022Dear Peter,
I have quickly reviewed the Intro and Conclusion of the paper and skimmed the contents, my standard way of starting to read a Report. I have yet to do a full reading, but I will.
I will open this response by confirming that we appear to be aligned regarding measures that will help limit population growth and the importance of limiting the total global population.
I will start by presenting the context of my perspective which is always open to improvement. But it is based on a significant amount of experience and learning. My name on this site reflects that perspective.
Awareness of the bigger picture is needed when looking at any part of the bigger picture. And for humans the bigger picture is the need for human activity to be governed (limited) to not harm Others or future humans, including not harming their ability to live a decent a life. And people will naturally be tempted to aspire to the examples set by the portion of the population that has developed the impression of being the highest status. That is important understanding since this planet is likely to be habitable for more than 100 million years. Sustaining humanity through that long period (almost forever) is the big picture. Many developed human activities are inconsistent with that understanding. And they would be inconsistent with sustained living on any other planet. The unsustainable nature of what has developed is not new. The growing awareness and understanding of the growing magnitude of the harmful unsustainability of what has developed is what is new.
Total Harmful Impacts of the Total Global Population are a developed problem that requires the development of solutions. The Sustainable Development Goals are a fairly comprehensive presentation of the solution that is open to further improvement.
We appear to be aligned regarding actions that would help limit global population. What you mention are understood parts of the Sustainable Development Goals and the Millennium Development Goals. Those sets of goals are steps in the constantly increased awareness and improved understanding of what is harmful and unsustainable. The pursuit of sustainable development understanding became a global coordinated collaborative effort 50 years ago with the Stockholm Conference.
It appears that the efforts to identify and limit harmful developments also sparked some harmful resistance to learning to be less harmful, particularly in the supposedly superior, more advanced, nations. But the resistance to that learning also appears to be strong among the supposedly superior, more advanced, portions of many less developed nations. And people who develop their thinking inside systems that promote smaller shorter-term perspective can struggle to see the bigger picture beyond their developed worldview. And, indeed, a part of the problem is the development of political groups that appeal for support by opposing, or not supporting, abortion and family planning. Some of them argue for 'abstinence' as the solution. But that is like arguing that 'not living' is a solution to the 'total climate change impacts of the total population' problem.
So we may also be aligned regarding the need to identify and try to reduce the popularity of political groups that would act in those less helpful ways. That would be good since it appears that 'these days' the political groups that are less supportive of measures to limit population growth are also less supportive of measures that would limit the climate change impact growth. And they also appear to be less supportive of actions that would limit or correct many developed harmful activities. They appear to be opposed to almost all the Sustainable Development Goals, one issue at a time (they even oppose limits on plastic use – the next globally acknowledged problem needing a global agreement to correct).
That brings me to a point I wish to make regarding something I noticed in the paper: “Emissions = Population x GDP/capita x Energy/GDP x Emissions/Energy”. That presentation can make it difficult to see the important need for superiority and advancement to be recognized as "reduced energy use per person" and "reduced harm done by the energy that is used" (because any use of technologically produced energy has the potential to produce harmful results).
I offer the following sequence of changes as a way to more comprehensively present the issue (guided by Einstein's advice to keep things simple, but not too simple):
"Emissions = Population x GDP/capita x Energy/GDP x Emissions/Energy + (a similar evaluation of all Other Emissions causing activity)".
That corrects for the over-simplification of only focusing on energy. However, fugitive emissions related to natural gas extraction, processing and transport also need to be counted. So Emissions/Energy is too simplistic. It could miss impacts associated with energy use that need to be counted. A more comprehensive statement would be:
“Global Warming Impacts = Population x GDP/capita x Energy/GDP x Global Warming Impacts/Energy + (a similar evaluation of all Other Global Warming Impact causing activity)”
That captures Evan's accurate point that many other things, particularly agriculture, cause global warming impacts that result in climate change. I noticed that the paper includes awareness of land use impacts on global warming. So the above would appear to be aligned with the understanding presented in the paper.
But there is also more harm done by energy use and agriculture than the climate change impacts. So a more comprehensive "Bigger Picture" presentation of the issue is:
“Total Harm Done = Population x GDP/capita x Energy/GDP x (Total Harm Done)/Energy + (a similar evaluation of all Other Harmful Impact causing activity)”
Now we get to the simple crux of the over-simplification that can be understood to apply to all of above presentations. The simplest way to present the above appears to be:
"Total Harmful Impacts = The sum of the harmful impacts attributable to each person"
That leads to understanding that there will be a diversity of degrees and types of harm that would be hidden by averaging the impacts of a group of people. And, as Evan also accurately points out, everyone wants a better life for themselves, their children, and others they identify closely with. So people can be expected to aspire to live like the people who they identify as being more advanced, more superior. And there is ample evidence that the current norms for identifying superiority and advancement, like the measure of GDP per capita, are harmfully misleading. People have been working to correct that misunderstanding about what deserves to be considered superior or more advanced, how to measure improvement, for a while now. The 2020 Human Development Report points out some of the efforts to correct that harmful developed misunderstanding.
That also leads to understanding that the people with the highest amount of harm attributed to their actions need to be the focus of efforts to limit harm done (Rule of Law works best when it is done this way). And it leads to understanding that people who act in ways that cause harm are not made acceptable by Other people acting to undo or adapt to the harm that is done. Reducing harm done requires the harm to be ended and, as much as possible, it requires those who benefit from the harm done to do what is required to undo the harm done.
Averaging the per capita impacts of a nation helps compare nations to identify which nations should be most focused on for harm reduction. But per capita does not identify the people within a nation who should be the focus of harm reduction efforts. As an example, immigrants into Australia may have remained as lower than average impacting people, which means their addition to the population actually disguises the increased harm done by the more harmful members of the population.
That brings me to my concluding point.
It is fundamentally unacceptable for a person to benefit from something that Other people will be harmed by, or be at risk of harm from. And regarding climate change impacts, it is unacceptable for people to be benefiting from creating the impacts even if Others are acting to reduce the impacts. And an averaging of a group of people can be harmfully misleading by hiding what the different people in the group have done.
Achieving Sustainable Development, developing a truly lasting future for humanity that can be improved by the development of truly sustainable improvements, can legitimately maintain or increase GDP per capita. Achieving those goals is likely to result in a lower peak population than would otherwise develop. And the per person impacts of that smaller total population would be lower. But to achieve that the harmful developed activities need to be identified and corrected.
The fundamental rule of "Do No Harm - Help Others" needs to be governing the actions of people. Everyone self-governing that way would be great. But that is a fantasy world. And the lack of that rule governing what has developed to date has produced an significant need for corrections, particularly corrections of the ways that the supposedly more advanced and supposedly superior people, who everyone looks up to and aspires to be like, live their lives.
That is the fundamental understanding I will be applying, and have been applying, to the reading of the paper, or any other presentation of thoughts. It is not the norm ... but it would be helpful if it became more of the norm.
- SkS Analogy 1 - Speed Kills: How fast can we slow down?
One Planet Only Forever at 07:48 AM on 23 February, 2022In response to Santalives’ questionable insistence on asking questionable questions, especially his demand for a comprehensive response to a cherry-picked questionable paper, Evan@89 has concisely and correctly asked Santalives a valid question.
I await Santalives’ thoughtfully considered comprehensive response.
However, Santalives’ responses to all other efforts to help them learn to be less harmfully misled, and every other commenter has tried to help, has prompted me to share more thoughts.
Santalives has rather conclusively proven that they are powerfully motivated to persist in harmfully misunderstanding matters that matter to the future of humanity, like many of the fans of sites like WUWT.
When I first read this item, when there were no comments, it prompted me to consider the matter and consider how I could thoughtfully respond. When I returned with some thoughts I was thrilled to see that there were already many other comments ... then I read the comments to see if they would modify my thinking. Reading the comments motivated me to make the comment I made @23. Santalives clearly did not pick-up on the hint.
My comment @48 was motivated by what continued to happen. Santalives responded @49 in a questionable way that was rapidly and effectively responded to by Evan (no need for me to respond). Santalives’ lack of a meaningful response to Evan @50 (I did not see the comment that disappeared. But I can infer from the remaining comments that Santalives’ response was more misunderstanding, adding proof of my point about them being a unique individual who shares the “anti-commonsense” “Hard of Learning – Selective Learning” characteristic (a play on “hard of hearing – selective hearing”) of fans of WUWT.
Santalives questionably asked about Newton vs. Einstein. “The Big Picture” by Sean Carroll (highly recommended reading for everyone, not just Santalives) explains that science has developed different ways of talking about similar things. Einstein’s way of talking about physics does not contradict Newton’s way of understanding what would happen to an apple when you let it go. And as a structural engineer I prefer to apply Newton’s way of describing things, even though it does not work for everything that Einstein's way does. And newer ways of describing physics are developed for newer things that Einstein was unaware of. And those newer ways of describing things are very unlikely to ‘overturn’ the fundamental understandings of Einstein. And it is highly unlikely that more in-depth pursuit of awareness and understanding regarding climate science will overturn the consensus understanding that human impacts are rapidly causing climate changes that harm the development of a sustainable improving future for humanity.
Returning to Santalives questionably asking about the motivation of people commenting on WUWT. They would each have their own motivations, beliefs and biases which have to be inferred from the patterns of their behaviour (Many situations require the development of understanding of what is going on to be inferred from observation, with the understanding that any interaction may affect the observed result. This is covered effectively by Sean Carroll in “The Big Picture”, but is more relevant to socioeconomic-political matters). Further details regarding the context for my response can be found in my comments on the three recent versions of “Analogy 1”: this one, the previous one, and the one before that.
The important question is: Is a person interested in, or willing to, learn to be less harmful and more helpful to Others. Everyone undeniably always has the ability to learn. People who can be seen to 'Resist learning to be less harmful and more helpful to Others' are harmfully motivated to harmfully misunderstand things. And competition for perceptions of superiority relative to others can produce very harmful motivations, with related harmful misunderstandings, and harmful resistance to learning to be less harmful and more helpful to Others. And competition for popularity and profit can develop harmful demands for the freedom to believe whatever excuses doing something understandably harmful that a person may hope to benefit from.
The Sustainable Development Goals are a very comprehensive presentation of the constantly improving understanding of how to be less harmful and more helpful to Others. They are the result of the efforts of thousands (perhaps millions) of people who became officially globally coordinated to collaborate by the 1972 Stockholm Conference.
Global warming related climate change (btw, As an engineer I would define “climate” as the regional climate norms - like temperature, wind, rain, snow, freezing rain - and their expected variations) is a significant impediment to Sustainable Development. The diversity of rapid climate change impacts harmfully distracts attention by forcing the pursuit of ‘adaptation attempts’ rather than the pursuit of ‘sustainable improvements’ (like the ways that a war or recovery from a natural disaster can ‘appear to improve economic performance measures like GDP’). And changes of atmospheric CO2 levels due to burning fossil fuel is a significant, but not exclusive, cause of the problems faced by global humanity into the future.
Admittedly from a ‘Sustainable Development to improve the future for humanity’ perspective there are many other harmful unsustainable ‘developed popular and profitable activities’ that are excused by harmful misunderstanding. However, this site is focused on the subset of harmful misunderstanding that relates to climate science (btw, the other human caused ghgs of concern are examples, so indeed it isn’t just CO2).
The following items are offered as further evidence of the harm being done by the popularity and profitability of harmful misunderstandings that sites like WUWT fail (potentially deliberately) to help fight against:
Sea Level Rise related to the previous versions of SkS Analogy 1.
Broader impacts of rapid human caused climate change
Regional specific impact of human caused climate change that has already happened.
- It's albedo
MA Rodger at 23:33 PM on 20 February, 2022blaist @121
I had the impression the Order of the Day set out @111 was "small bites" but @121 you appear to be serving up a giant five-course meal.
You seem to be proposing a driver of AGW with a mechanism initiated by (1) a decrease in surface albedo due to the spread of urban areas leading to (2) a rise in surface temperature which in turn leads to (3) reduced relative humidity which leads to (4) reduced cloud cover which then amplifies the warming due to (5) a reduction in cloud albedo. Do correct me if I have misunderstood your proposed mechanism.
Yet if this suggestion is to hold water, how does it reconcile with the 'Amazonia report' you cite, Costa et al (2007) which (as you describe) "showed that in despite of an increase in albedo from rain forest to crop/pasture, the temperature increased." And this increase in surface albedo with land-use-change is global and has been on-going since 1700 according to your other citation Ghimire et al (2014) whose Fig 2 is pasted below showing a cooling radiative forcing (inset rising albedo).

So if there is an increase in surface albedo, what is it causing the increasing global temperature and thus kicking-off your proposed mechanism, (1) to (5) above? Why would we be experiencing warming if globally surface albedo has been increasing since 1700? - It's albedo
blaisct at 07:28 AM on 20 February, 2022MA Rodger @112
Before I answer your question on whether there is something other than AGW causing global warming. Let me clarify that I am not a skeptic on Anthropical Global Warming, AGW, I firmly believe that man’s activities are causing AGW. The paper Dubal & Vahrenholt expressed doubt that the 20 years of CERES data showed significant evidence of GHG caused AGW and that clouds were the significant factor. How is cloud cover related to AGW? The Skeptical web site seems to be committed to evaluating theories. Here is the answer to your question:
The data I have looked at (below) suggest that AGW is not cause by one thing but a series of interactive events starting with land albedo and ending with ocean/land albedo and relative humidity (not specific humidity) in the middle. You will see (below) that this cycle of events is a known cycle in weather and that man’s activities have interfered with the cycle to cause AGW. For lack of a better name, I will call the cycle of events the “Low Humidity Albedo Cycle”, LHAC. The LHAC cycle back in the 1700-1800 (with low man-made albedo change) was:
Event 1: Over land on sunny days the temperature rises and the relative humidity, RH, drops through the day no matter what the albedo of the land is. How much the RH drops depends on availability of water from liquid water evaporation or plant transpiration. If no water is added to this daily event the specific humidity, SH, will remain constant while the RH drops. With water available the RH does not drop as much and the SH increase. The energy fueling this event (sunny days) depends on the albedo and latitude of the land, the lower the albedo and the closer to the equator the stronger this event. Clouds greatly dampen this event.
Event 2: The air above this land is hot and dryer and it rises all day long, creating a plume of rising hot low humidity air. That plume of air moves with the prevailing winds usually to the east in a circling pattern due to the Corellas effect.
Event 3: This hot low RH air is hungry for water. If this air finds clouds it eats away at them until the air is saturated with water, this process cools the air and raises the SH and RH. If this hot low RH air does not find a cloud it can cool as the pressure drops at the higher altitudes or it can serve as a deterrent to cloud formation. In all cases it reaches saturation.
Event 4: With fewer clouds more sun can reach the earth and warm the land and oceans, this is the final albedo decrease event. This last albedo event is the strongest because the change in albedo in the greatest with no clouds in the way of direct sun light. The warmer oceans store some of this energy and evaporate more water - find cold air and make more clouds.
This natural LHAC cycle of event will remain stable if the albedo and moisture availability remain constant. Let’s take each event and look at its contribution to the total AGW since 1880:
Event 1: Since 1700-1880 man has made some small changes in land use albedo but a large change in the land area. Most of these albedo changes came along with a decrease in moisture availability. UHI’s are most noted, with albedo changes between 0 and 0.2 depending on what the city replaced. I don’t have a source for the average, I will assume 0.05 average albedo change. The urban area has increased to about 3% of the earth’s land mass for all cities. I have no trouble doubling that to 6% for all man-made structures, rural + urban, they all have lower albedos and generate heat. Go to any city at Climate data and you can find the daytime data for temperature vs RH, in the morning the RH is high and as the day progress the temperature rises and the RH drops sometimes to 40% RH or lower, this is a normal psychometric thermodynamic process. Figure 1 is an example of daily RH from Beijing and is typical of most cities (just focus on the day time).

Figure 1
The change in albedo flux of all the earth’s cities is estimated at 0.08W/m^2 (assuming 177W/m^2 sun to the city, 50% cloud cover, 0.05 albedo change, 3% of land mass cities). Even if we make larger assumptions, we still can’t get to the 2.2W/m^2 we are looking for to account for all the AGW since 1880 or the 1.3 W/m^2 in Dubal & Vahrenholt . These cities can have daily temperature rise of up to 8’C. A large part of this temperature rise is due to the psychometric rise, PR, in temperature while the RH drops at a constant energy input (albedo). Looking at temperature anomalies, SH, and RH all plotted together vs time, Figure 2, we see they are all correlated (Temp and SH positively, and Temp and RH negatively).

Figure 2
If PR were not occurring on a global basis the RH and SH would both have a positive slope. Using the psychometric chart in @106 we can get the average temperature rise per % RH of -0.15 ‘C/%RH. The slope of the RH data in (2) is 0.16%RH/decade, for the 40 years of the chart this is 0.6% change in RH, giving a PR temp rise of 0.1’C for the 40 years vs the 0.7’C observed, small but not insignificant. This hot low RH air has no W/m^2 flux as it leaves the UHI; but, the hot low RH air has potential energy gain in getting saturated with water. Let’s add the crop/pasture land albedo changes to the UHI's. Globally the change since 1880 from virgin land to crop/pasture was about 6% with little change in albedo (Global albedo change); but, with low moisture change. The most notable of these changes was the deforestation of the Amazonian rain forest to make crop and pasture land Amazonia report (and @106). Amazonia report showed that in despite of an increase in albedo from rain forest to crop/pasture the temperature increased, the RH deceased, the cloud cover decreased, and the rain decreased. Classic example of psychometric temperature and RH behavior. Most likely all of this global 6% increase in crop/pasture land is producing hot low RH air just like the UHI’s. Combining the UHI and crop/pasture land changes we get 9% of the earth’s land mass producing more hot low RH air than 1880.
Event 2: This hot low relative humidity air rises and goes downwind from the UHI or changed crop/pasture land. The picture from (6) shows the extent of the UHI plume from Chicago, Il.

Figure 3
This is a computer model tuned with real data and calculates the extent of the plume to be 2 to 4 time the area of the UHI. The model also predicts the shape of the plume, rising to where some clouds could be. Using 3 times as the average extent of the plume we now get 27% of the land mass (7.8% of the earth) being affected by plumes like the one in Figure 3.
Event 3: Cloud destruction/prevention is the closest target for the hot low RH plume; but, if clouds are not available the lower pressure will saturate it or it will mix with cooler air. When this plume of hot low RH air increases its RH to 80% it is no longer is a threat to clouds or cloud prevention. Clouds and RH observations are that almost no clouds can form below 60% RH and significant reductions will occur below 80% RH.

Figure 4
Data shown in the figure 4 shows a 41%/decade decrease in clouds over 40 years. Dubal & Vahrenholt Figure 9 show about 0.57%/decade decrease, this data can be correlated to Figure 2 RH data and get 2.7% change in cloudiness/change in RH (R^2 =0.63). Not the best correlation but shows there is a relationship.
Event 4: The reduce cloud cover exposes more land and ocean to the sun. This land and ocean are located in the middle 75% of the earth where the cloud cover is about 50% vs about 60% for the whole earth, also assuming albedo of clouds is 50%. The sun’s flux to this exposed area is the cloud free flux of 342 W/m^2 (1367/4). Dubal & Vahrenholt suggest this energy is split 85% over ocean (0.05 albedo) and remainder over land (0.15 albedo). Using 40%/decade cloud cover for 2 decades of CERES data we get -1.6W/m^2 change in incoming SW [ 342W/m^2*0.8% cloud cover change*(85% *(1-0.05)+(1-80%)*(1-0.15))]. A little greater than the -1.3 W/m^2 observed; but close enough to show that the LHAC theory is plausible. - It's albedo
blaisct at 05:08 AM on 15 December, 2021Once again thanks for your comment (MA Rodger and the editor) and the additional papers on the subject. I will try to do better with the links.
The earlier data I was referring to was earthshine 10 years and CERES 10 years which showed that the data for the earths albedo was very noisy and flat. The flat part was what was expected for anthropogenic greenhouse gas , AGH, global warming. My initial understanding of AGH radiative forcing was that AGHs absorbed radiation (got hot) and that the higher the AGH concentration (at constant radiation) the more heat it could hold back thus the temperature would increase but the energy in vs out of the zone where this occurred would be the same (albedo would be flat). My understanding has been expanded to include: AGHs hotter temperature will reduce humidity and thus reduce cloud cover, expose more earth surface to the sun thus reduce earths albedo; therefor, albedo vs time for AGHs may not be flat.
The new (new to me) data I sited Earthshine 20 years showed a decrease albedo from both earthshine and CERES data – my only interest is this report was the agreement with earthshine an CERES data. The editor’s link CERES 20 years 1 and another link CERES 20 years 2 provided a lot more CERES data with different analyses. These three papers are the first time I have seen data showing a decrease in albedo (increase in TOA radiation) vs time. If all climate change was due to AGHs this graph would be flat. Using the CERES 20 years 2 graph for TOA radiation out. (of the three links I chose this one because it has the In Situ data (earth surface temperature)) one can see the good correlation between In Situ data and CERES data

Figure 1
“Comparison of overlapping one-year estimates at 6-month intervals of net top-of-the-atmosphere annual energy flux from the Clouds and the Earth's Radiant Energy System Energy Balanced and Filled Ed4.1 product (solid red line) and an in situ observational estimate of uptake of energy by Earth climate system (solid blue line). Dashed lines correspond to least squares linear regression fits to the data.”
. If there was any AGH global warming mixed In with the TOA (red) data it would have a slope lower than the In Situ data. The report CERES 20 years 1 did look for the AGH flat line signal and found it in the “Clear Sky” LW (long wave) data but nowhere else (1 of four graphs).
Two of these reports put a lot of emphasis on clouds decrease (new to me). (Decrease in cloud cover increased surface exposure to suns radiation and heats the earth more.) The report CERES 20 years 2 also found correlation to Water vapor, trace gases, surface albedo, as well as clouds. Both of these reports express doubts on the current understanding of climate change and make recommendation to further understand what is causing cloud cover to change.
While this new data is interesting and worth following up on it is still very noisy (low R^2) and another 20 years would be better.
I recognize that AGH global warming would promote other forcing including reduce clouds, reduced ice, reduced snow cover all exposing more surface to direct rays of the sun. Other man-made albedo changes can do the same thing. Here are two examples that may relate to the new papers.
Let’s start with the “heat island effect”, UHI. While the global warming from UHI’s lower albedo is small it does have observable effect on cloud formation, CERES 20 years 2.

“Figure 3
Attribution of Clouds and the Earth's Radiant Energy System net top-of-atmosphere flux trends for 2002/09–2020/03. Shown are trends due to changes in (a) clouds, (b) surface, (c) temperature, (d) combined contributions from trace gases and solar irradiance (labeled as “Other”), (e) water vapor, and (f) aerosols. Positive trends correspond to heat gain and negative to loss. Stippled areas fall outside the 5%–95% confidence interval. Numbers in parentheses correspond to global trends and 5%–95% confidence intervals in W m−2 decade−1.”
When air rises from a UHI it is hotter than the incoming air without a source of moisture to saturate it; so, it leaves as dryer air. This air generally rises and moves to the east. Look at figure 3 (a) and see the lower cloud formation change off the coast of east USA, Tokyo, and downwind Europe. With time (1880-2021) the UHI does not get hotter but it gets bigger thus the volume of low moisture air gets bigger. I am not going to argue the significances of the albedo part of UHI other than to recognize it is lower than 1 W/m^2 but not zero. What UHI is not given credit for is what happens downwind to this hotter low humidity air. Does it cool the ocean, reduce the snow line, melt ice, or reduce the cloud cover down wind, since this hot dry air should rise the clouds should be the first target. I can also see a chain of events: Hot low moisture air (from AGHs, UHIs, or other land changes) rises and go downwind, reduces cloud cover, over water the sun heats the ocean, the hotter ocean currents circulate to the poles, and melt some ice.
I’ll leave the quantification of this observable (figure 3 (a)) new (to me) correlation to others. A new UHI contribution to GW will be the albedo effect + the lower cloud effect + any other.
Second, is land use changes such as forest to crop or pasture land or grass land to crop land. Albedo decrease in grass land to crop land change is documented in Grass to Crops. Forest to crop land change increase in albedo is documented in Forest to Crops. Over 205 years the paper Global albedo study calculates that all the pluses and minuses add up to little change in albedo from land use changes. It is assumed (by me) that decreased albedo of a parcel of land means an increase in temperature and vs/vs. The study Amazonia Forest to Crops shows that increasing albedo does not always mean cooler temps. This report shows that when rain forest was replaced with crop land that the temperature increased, the rain decreased, and the cloud cover decreased. The Figure 3 (e) above shows bright red spot for “water vapor” (I assume that is change to lower humidity) in Amazonia. This is not an uncommon effect from replacing forest with crop or pasture land. The report Forest study observes that forests vs crop/pasture conversion gets warmer as the conversion gets south of 35’N latitude.
This unintuitive (to me) observation that an increase in albedo does not always result in a decrease in temperature can be explained by moisture. The resulting temperature depends on a constant enthalpy (total heat in the air= gases + moisture). Enthalpy is usually determined by the albedo (higher albedo lower enthalpy vs/vs); therefore, land exposed to the same albedo (enthalpy) can have a wide range of temperatures depending on the moisture (relative humidity) of the albedo (enthalpy). This relationship has been captured in a psychrometric chart,
(Sorry for the poor quality of this chart)
Example of a rain forest conversion to crop land: Start out with a rain forest at 25’C (bottom scale) go straight up to 90% humidity curve; this is our hot humid rain forest. If we convert this rain forest to crop land with a higher albedo, we move to a lower enthalpy line (anyone will do). The constant enthalpy line run diagonal (upper left to lower right). If the moisture is maintained at 90% the temperature will drop as expected for the higher albedo. Following the same enthalpy line (same albedo) go to a lower humidity curve that may result (and does in Amazonia) and one will see the temperature will increase (even to above the starting rainforest temperature at very low humidity).
A concern is how NASA and the IPCC pair surface temperature data with relative humidity and albedo. The three all connected in enthalpy. A misunderstanding of climate change could occur if Amazonian (rain forest to crop land) high albedo, high temperature, lower humidity type data was included in correlations with Canadian (forest to crop land) lower albedo, cooler temperatures, high humidity, type data. Does anyone know if this has been looked at? The report CERES 20 years 1 has looked at ocean enthalpy correlations. I have not seen any land enthalpy data. - It's albedo
coolmaster at 23:46 PM on 13 September, 2021@GPWayne:
"We know the planet is warming, and that human agency is causing it. What we cannot say yet is how climate change is affecting albedo, how it might be affected in the future, and what contribution to climate change - positive or negative - it may make."
coolmaster: The albedo is relative ... and depends primarily on the wavelength of the light that hits the body/molecule. We should therefore always specify a wavelength range for the albedo. Otherwise, strictly speaking, the entire incoming spectrum of the sun ( UVC140nm up to Micro waves10cm) is decisive. This relativity to the albedo is particularly important for an element as widespread worldwide as H²O. I.e. ice and snow with an albedo of up to 0,9 in the visible range(380-780nm) has an albedo in the micro wave range of only < 0,1.
Albedo of the earth ist 0,3 because absorbtion is 0,7(0,5 on the surface + 0,2 in the atmosphere) --> so the atmosphere has an albedo. Higher concentrations of GHG specially CO² is lowering the albedo of the atmosphere and is thus increasing temperature. We could always increase the albedo elsewhere: clouds, white color in the outdoor area or lighter field crops through foliar fertilization with light clays are just a few of the many possibilities.
The temperature of the earth's surface is globally determined by the radiation balance, the radiation budget. This records the interaction between absorption and reflection as well as re-emission and scattering.
But no matter which albedo you are looking at, whether short or long wave - a higher albedo can never cause a rise in temperature or energy. Conversely, every falling albedo increases temperatures or energy on earth.
So I suggest that you update the last sentence of your basic rebuttal.
@Moderation response: "last warning"
In my last comment, which you would like to see in the slr section, the word albedo appears 3 times - the words clouds and cloud cover even more often. You should also warn others, who do exactly the same(i.e. MAR,BL).
The inseparable connection between albedo - clouds - water and SLR was invented by an immovable mover (Aristotle's definition of God) ! not me !
I don't want to discuss religion here, if only because I don't belong to any official religious community and because my religion is art. For me, climate science is a discipline, just like painting, sculpture, dance, music, and theater, etc.
Nevertheless, I noticed that there once was a man who said he wanted to save the world. Among other things, because he supposedly could move over the water ...
I also want to save the world ... and move (spiritually & physically) over the water.
If you don't like my holistic, alternative climate protection strategy, which lowers sea level rise and earth temperatures - I can't change it, but I can't understand it either. In my opiniont it is the very last opportunity for you, your readers, commentators, your descendants, and the rest of creation to escape from climate hell (as long as anybody presents a much better, faster or cheaper concept.)
That was my last warning to you...
- It's planetary movements
Daniel Bailey at 02:45 AM on 30 March, 2021
"there is no effect on our climate"
Likeitwarm, while the Sun can influence the Earth’s climate it isn’t responsible for the warming trend we’ve seen over the past few decades. The Sun is a giver of life; it helps keep the planet warm enough for us to survive. We know subtle changes in the Earth’s orbit around the Sun are responsible for the comings and goings of the ice ages. But the warming we’ve seen over the last few decades is too rapid to be linked to changes in Earth’s orbit, and too large to be caused by solar activity.
One of the “smoking guns” that tells us the Sun is not causing the recent warming of Earth’s surface and ocean comes from looking at the amount of the Sun’s energy that hits the top of the atmosphere. Since 1978, scientists have been tracking this using sensors on satellites and what they tell us is that there has been no upward or downward overall trend in the amount of the Sun’s energy reaching Earth.
A second smoking gun is that if the Sun were responsible for global warming, we would expect to see warming throughout all layers of the atmosphere, from the surface all the way up to the upper atmosphere (stratosphere). But what we actually see is warming at the surface and cooling in the stratosphere. This is consistent with the warming being caused by a build-up of heat-trapping gases near the surface of the Earth, and not by the Sun getting “hotter.”
Scientists have quantified the warming caused by human activities since preindustrial times and compared that to natural temperature forcings.
Changes in the sun's output falling on the Earth from 1750-2011 are about 0.05 Watts/meter squared.
By comparison, human activities from 1750-2011 warm the Earth by about 2.83 Watts/meter squared (AR5, WG1, Chapter 8, section 8.3.2, p. 676).
What this means is that the warming driven by the GHGs coming from the human burning of fossil fuels since 1750 is over 50 times greater than the slight extra warming coming from the Sun itself over that same time interval.

https://science2017.globalchange.gov/chapter/2/#fig-2-3
The reality is, over the past 6 decades of significant global warming, the net energy forcing the Earth receives from the Sun had been very slightly negative. As in, the Earth should be cooling, not warming, if it was the Sun driving the observed warming of the past 6 decades. Does this mean the Sun is dimming? No. Over the centuries, the Sun’s output waxes and wanes between more active periods of time, like during the 1950s and 1960s, and periods when it is very quiet for decades like in the1600s (called a Grand Solar Minimum). However, the difference between the more active periods and the quieter periods isn’t very great and is not by itself long enough or great enough to propel Earth’s climate into either a runaway heating (like happened on Venus) or into an “snowball Earth”. Overall, the Sun has increased its output by roughly 10% per billion years of its life.
https://climate.nasa.gov/faq/14/is-the-sun-causing-global-warming/
https://www.climate.gov/news-features/understanding-climate/climate-change-incoming-sunlight
"brightening of the Sun is unlikely to have had a significant influence on global warming since the seventeenth century"
https://www.nature.com/articles/nature05072
What this means, in plain English: the warming caused by the greenhouse gas emissions from the human burning of fossil fuels is 6 times greater than the possible decades-long cooling from a prolonged Grand Solar Minimum.
Even if a Grand Solar Minimum were to last for a century, global temperatures would still continue to warm. Because the Sun is not the only factor affecting global temperatures on Earth.
https://agupubs.onlinelibrary.wiley.com/doi/full/10.1029/2010GL042710
https://agupubs.onlinelibrary.wiley.com/cms/asset/6dbf95a2-e322-4c92-838a-faf4dd77fa93/grl26938-fig-0002.png
https://agupubs.onlinelibrary.wiley.com/doi/10.1029/2011JD017013
https://agupubs.onlinelibrary.wiley.com/cms/asset/50198c16-0139-4e49-a7f2-e3e66e3af759/jgrd17754-fig-0006.png
https://agupubs.onlinelibrary.wiley.com/doi/full/10.1002/grl.50361
https://agupubs.onlinelibrary.wiley.com/cms/asset/a4f99608-109a-410d-99e6-d1c80799bccc/grl50361-fig-0002-m.jpg
https://agupubs.onlinelibrary.wiley.com/doi/full/10.1002/grl.50806
https://agupubs.onlinelibrary.wiley.com/doi/full/10.1002/2014JD022022
https://www.nature.com/articles/ncomms8535
https://www.nature.com/articles/nature21364
https://www.swsc-journal.org/articles/swsc/abs/2017/01/swsc170014/swsc170014.html
https://academic.oup.com/astrogeo/article-abstract/58/2/2.17/3074082
https://iopscience.iop.org/article/10.3847/2041-8213/aaa124/meta
https://www.atmos-chem-phys.net/18/3469/2018/
https://www.sciencedirect.com/science/article/pii/S0277379118307261
https://www.nature.com/articles/s41561-019-0402-y
https://journals.ametsoc.org/doi/abs/10.1175/JCLI-D-19-0059.1
https://climate.nasa.gov/blog/2953/there-is-no-impending-mini-ice-age/
https://www.nasa.gov/press-release/solar-cycle-25-is-here-nasa-noaa-scientists-explain-what-that-means
The human forcing is now the dominant forcing of climate, dwarfing all natural forcings combined. Even that from the Sun.
- Skeptical Science New Research for Week #9, 2021
Rob Honeycutt at 01:46 AM on 16 March, 2021What's fascinating to watch is how SunBurst has presented erroneous statements, been corrected with evidence and citations, and ignored it. It's clear he just flat out doesn't care when he gets something wrong.
@4, 6, 12 he said (without citation) warming isn't global, and shown he's wrong multiple times and in multiple ways.
@14 he claims (without citation) we're taking energy away from people who need it, and shown how this is wrong.
@18 he claims (without citation) that Al Gore said NYC would be under water in 10 years, and he was repeatedly shown this is wrong.
@20 he questions how we could know that human CO2 emissions are causing warming, and is shown the research and evidence, and ignores it.
@27 he asserts that "AGW folks" claim (without citation) that CO2 levels are "unprecedented," is shown the research and ignores the error of his assertion.
@35 he makes the false assertion (without citation) that Lacis 2010 claims the earth must be in perfect equilibrium, and will surely be back to defend his false statement.
If this isn't Gish Gallop then I don't know what is.
- Skeptical Science New Research for Week #9, 2021
nigelj at 07:26 AM on 14 March, 2021Sunburst @12
"You must, however, consider the Big Picture in that "global warming" really isn't global unless the upward temperature trends are happening everywhere, and I have pointed out several regions where exactly the opposite is happening."
No. The world doesn't have to be warming at every place for the world to be warming as a whole. All that has to happen is the planets average temperature goes up. This is self evidently possible even if some small areas are cooling. By analogy a simple traditional wood fire could be getting hotter and hotter measured with temperatures in the chimney even if you spilt your iced drink on a small part of the fire causing one corner of the fire to cool for a little bit. I've already explained all this @7 and you havent disproven it with any data. You have pointed out a couple of regions where you allege without hard evidence theres cooling but you neglect the many more regions that show warming. You provide no proof that areas of your alleged cooling are greater than areas of warming. And as people point out you confuse a warming trend with weather so you havent demonstrated any actual cooling trend anywhere at all on the planet.
---------------------------------
Sunburst @13
"Well, you are free to believe whatever you want. But I'm sure that most Americans who have seen skyrocketing heating bills and frozen water mains for the past 5-10 winters would tend to say it's a cooling trend and not just cold weather. "
Or is it because electric companies are simply charging more money for other reasons? Maybe they are building new infrastructure. Maybe they are getting greedy. Maybe there is maineinance work. Again you provide no reliable evidence of why prices are skyrocketing or even "if" they are sky rocketing.
And 10 years does not constitute a climate change trend. Its generally accepted we need 30 years of data to be certain the climate has changed in a fundamental way and its not just short term natural cyclical variability. This is why it was only decided in about the 2000s that burning fossil fuels was definitely causing climate change. So even if the global climate WAS cooling for 5 -10 years (it isn't) this doesnt prove very much.
" At any rate, it would simply be wrong to deprive those people (including myself) of the fuels they need in order to get them through the winter seasons despite all of the "global warming" we are experiencing."
Strawman. Nobody is depriving anyone of fuel.
- 2021 SkS Weekly Climate Change & Global Warming Digest #1
Dr. S. Jeevananda Reddy at 21:46 PM on 10 January, 2021nigelj
on the solar and wind — see the reference I quoted earlier.
About nuclear power — I am against this and fighting on this. In India Hydropower is the major component after coal and in USA it is nuclear power — equivalent to hydropower % in India with coal % similar.
Coal power — the dust compensate the heat at the power station. Also water is used to cool some of it.
CO2 levels in SH are nearly one-third of NH. Also prior to 1960 a smooth increasing CO2 curve is an hypothetical curve.
IPCC claim that CO2 can cause catastrophic global warming. Because CO2 is not capable of causing significant global warming by itself, their contention is that increased CO2 raises temperature slightly and that produces an increase in water vapour, which does have the capability of raising atmospheric temperature. However, it is not the case, and on the contrary water vapour/relative humidity controls the energy coming from the Sun that controls the temperature at the ground. Since 1960 with the steadily rising irrigated agriculture and development of water resources caused steady rise in water vapour in the atmosphere but it has short life – not cumulative like carbon dioxide. That means under cold-island effect the temperature must decrease. This was recorded in satellite data. But later this data series were withdrawn from the internet and introduced new data series that matches with adjusted ground data series. Also annual state-wise temperature data series where intensive agriculture practice exists, namely Punjab, Haryana & UP belt showed decreasing trend in annual average temperature. Also climate sensitivity factor that converts CO2 in to heat/temperature is heuristic so far. Also the trend in global average annual temperature is not global warming but it is a part of trend is global warming that to based on adjusted data series.
A recent report states that CO2 level of 1970 was the height in the last 800,000 years — which is false observation. In fact CO2 measurements started around 1960 — According to WMO Fact Sheet 4 of August 1989— 45 stations of which 3 from SH and no station in tropics.
According to Freja Vamborg, a senior scientist at C3S, it is unquestionably an alarming sign that May 2020 has been the warmest month on record globally. However, even more concerning is the facts that average temperatures of the last 12 months have become one of the hottest 12-month-periods ever recorded in our dataset. Of course, this does not as such represent a long-term climate trend, as monthly temperature deviations vary, and some regions showed below average conditions. May 2020 tied with May 2016 for average global land and ocean temperatures, while April 2020 was on par with April 2016 for the hottest temperatures since records began in 1880. The global average temperature for May 2020 was 15.7oC (60.3oF), according to two independent measurements by the European Copernicus Climate Change Service (C3S) and the US National Oceanic and Atmospheric Administration’s (NOAA) included in the State of the Climate: Global Climate Report for May 2020. -— Both studies found abnormalities over Siberia and the Arctic Ocean with temperatures about 10.0oC (18oF) above average for this time of the year. That means these part of irregular variation part of natural variability. This is nothing to do with the CO2 linked global warming.
- How much has nuclear testing contributed to global warming?
boston745 at 12:49 PM on 27 October, 2020I understand that cosmic rays aren't germain to the articlr directly. However a weakened magnetic field allows more CR energy in. Its possible that the nuclear testing accelerated that weakening.
The problem with compartmentalization by article topic is that no 1 thing is causing global warming. Multiple factors are at play. Thus its difficult to discuss.
The earths orbit around the sun has brought the earth as close to the sun as it gets in a 400,000 year cycle. Thus the earth is receiving about maximum solar radiation. With a weaker field, more solar radiation gets through and thus more absorption.
Cloud cover is also a factor, which is impacted by moisture in the air, aerosols, & CRs. Clouds can reflect energy or keep radiation in like a thermal blanket.
- The pros and cons of planting trees to address global warming
WLU at 06:30 AM on 29 March, 2020By planting trees not only is carbon sequestered from the air but the radiant energy from the sun it is turned into chemical energy rather than thermal energy. While planting trees will produce a darkened landscape they will not respond like a landscape of darkened rocks. Rocks absorb the radiant energy from the sun and heat up radiating in the infrared which is blocked by greenhouse gasses causing global warming. Green plants don't do this. They tend to inhibit global warming.
- 500 scientists refute the consensus
Simple QED at 20:54 PM on 10 December, 2019Carbon emissions as the cause of global warming claimed to explain the recent severe weather on the Earth may be misleading. Small Earth temperature increases, say 1 K per year, caused by carbon emissions are thought the cause of recent severe weather. Since 1 K temperature changes in a small room over a year are impossible to verify, yet the entire world seems to believe preposterous claim of temperature increases of 1 K over the entire Earth. Solar irradiation received by the Earth provides a scientific argument if solar heat is causing global warming. But solar irradiance data over the past century is relatively constant, and therefore variations in Sun temperature have been dismissed as the cause of global warming. Hence, carbon emissions producing the preposterous 1 K per year are by default considered the cause of global warming.
In this regard, it is more likely the sun temperature is changing by a small amount to cause the 1 K temperature - if in fact, the temperature increase per year is 1 K. Today, the sun temperature is 5800 K. Based on Black Body relations, the figure below shows the change in Earth temperature T above that for the Sun at 5800 K when the the sun temperature is higher or lower than 5800K. For example, if the sun temperature is 5820 K or 20 K higher than 5800 K, the Earth temperature is 1 degree K higher. Since it highly likely the sun temperature fluctuates more than 20 K during a year, global warming is more likely caused by the Sun than carbon emissions and is much greater than the 1 degree K per year claimed by scientists.
www.nanoqed.org/resources/2019/Warming.jpg
By the Black Body argument, a higher rise than 1 K in Earth temperature is occurring, but although more realistic than the small 1 K estimate also can never be verified. Regardless, the constancy of solar irradiance at the top of the upper atmosphere over time challenges the foregoing black body argument. It therefore appears the ozone layer in the upper atmosphere is thinning [1] to allow more solar UV and EUV radiation to reach and heat the lower atmosphere, the lower atmosphere actually controlling the weather on Earth. If so, the ozone layer may be of far greater importance than carbon emissions, but data to support this argument is lacking.
Time will tell if global warming by carbon emission or loss of ozone is correct. More research on thinning of the ozone layer is recommended.
[1] C. Jackman, NASA Goddard Space Flight Center, “The Impact of Energetic Particle Precipitation on the Atmosphere,” presentation to the Workshop on the Effects of Solar Variability on Earth’s Climate, September 9, 2011.
- It's cosmic rays
Daniel Bailey at 06:22 AM on 4 December, 2019jmh530, the best available evidence we have is that there is no direct linkage between the sun’s output and cosmic rays impacting the Earth’s climate. Now that’s a broad statement, but let’s examine some more in-depth evidence on those individual components.
Scientists use a metric called Total Solar Irradiance (TSI) to measure the changes in output of the energy the Earth receives from the Sun. And TSI, as one would expect given the meaning behind its acronym, incorporates the 11-year solar cycle AND solar flares/storms.
The reality is, over the past 4 decades of significant global warming, the net energy forcing the Earth receives from the Sun had been negative. As in, the Earth should be cooling, not warming, if it was the Sun.
The scientists at CERN designed an experiment called CLOUD to evaluate the potential impacts of cosmic rays on clouds and cloud nucleation (Cloud Condensing Nuclei = CCN).
Per CLOUD director Kirkby:
"At the present time we can not say whether cosmic rays affect the climate."
Looking at the results of CLOUD, if cosmic rays were a significant factor in affecting our climate, the Earth should have been cooling, not warming. Instead 8 of the warmest 10 years have all occurred in the most recent 10 years.
Erlykin et al 2013 - A review of the relevance of the ‘CLOUD’ results and other recent observations to the possible effect of cosmic rays on the terrestrial climate
“The problem of the contribution of cosmic rays to climate change is a continuing one and one of importance. In principle, at least, the recent results from the CLOUD project at CERN provide information about the role of ionizing particles in ’sensitizing’ atmospheric aerosols which might, later, give rise to cloud droplets. Our analysis shows that, although important in cloud physics the results do not lead to the conclusion that cosmic rays affect atmospheric clouds significantly, at least if H2SO4 is the dominant source of aerosols in the atmosphere. An analysis of the very recent studies of stratospheric aerosol changes following a giant solar energetic particles event shows a similar negligible effect. Recent measurements of the cosmic ray intensity show that a former decrease with time has been reversed. Thus, even if cosmic rays enhanced cloud production, there would be a small global cooling, not warming.”
Modern CCN are pretty much insensitive to cosmic rays and changes in TSI from the Sun, compared to the very much larger anthropgenic and natural contributions (volcanoes, oceanic oscillations and wildfires):
"New particle formation in the atmosphere is the process by which gas molecules collide and stick together to form atmospheric aerosol particles. Aerosols act as seeds for cloud droplets, so the concentration of aerosols in the atmosphere affects the properties of clouds. It is important to understand how aerosols affect clouds because they reflect a lot of incoming solar radiation away from Earth's surface, so changes in cloud properties can affect the climate.
Before the Industrial Revolution, aerosol concentrations were significantly lower than they are today. In this article, we show using global model simulations that new particle formation was a more important mechanism for aerosol production than it is now. We also study the importance of gases emitted by vegetation, and of atmospheric ions made by radon gas or cosmic rays, in preindustrial aerosol formation.
We find that the contribution of ions and vegetation to new particle formation was also greater in the preindustrial period than it is today.
However, the effect on particle formation of variations in ion concentration due to changes in the intensity of cosmic rays reaching Earth was small."
And
"...solar cycle variations of ion concentration lead to a maximum 1% variation of CCN0.2% concentrations. This is insignificant on an 11 year timescale compared with fluctuations due to, for example, the El Nino-Southern Oscillation, variations in wildfires, or volcanoes."
Gordon et al 2017 - Causes and importance of new particle formation in the present-day and preindustrial atmospheres
And the coup de grace for cosmic rays, being proven to unable to significantly affect clouds and climate, is that CCN respond too weakly to changes in Galactic Cosmic Rays to yield a significant influence on clouds and climate.
Pierce 2017 - Cosmic rays, aerosols, clouds, and climate: Recent findings from the CLOUD experiment
Scientist Richard Alley pretty much killed the cosmic ray hypothesis here (the relevant part of the lecture starts at 42:00)
"We had a big cosmic ray signal, and the climate ignores it. And it is just about that simple! These cosmic rays didn’t do enough that you can see it, so it’s a fine-tuning knob at best."
To recap, the Laschamp excursion (the strongest cosmic ray event in the past 40,000 years) hammered climate for 2,550 years about 40,000 years ago. The flux of beryllium-10 produced by cosmic rays greatly increased as the Earth’s magnetic field weakened by 90%.
Here is the chart he’s referring to, showing how the flux of beryllium-10 produced by cosmic rays greatly increased as the Earth’s magnetic field weakened by 90% about 40,000 years ago.

From the AR5, WG1, Chapter 7, p. 573:
"Cosmic rays enhance new particle formation in the free troposphere, but the effect on the concentration of cloud condensation nuclei is too weak to have any detectable climatic influence during a solar cycle or over the last century (medium evidence, high agreement). No robust association between changes in cosmic rays and cloudiness has been identified. In the event that such an association existed, a mechanism other than cosmic ray-induced nucleation of new aerosol particles would be needed to explain it. {7.4.6}"
- Ice age predicted in the 70s
scaddenp at 10:31 AM on 28 November, 2019"S Could you please point out that I have stated it?"
It is entirely possible that we are misunderstanding each other. Michael Sweet was pointing out what was wrong with the idea that an ozone hole was going to lead to global cooling.
You replied:
Mr sweet,
This may enlighten you
Cooling of the Arctic and Antarctic Polar Stratospheres due to Ozone Depletion
Which correctly shows that loss of ozone leads to stratigraphic cooling (but not to climatic cooling). Your manner of comment suggested that you were trying to contradict Michael Sweet. If you were trying to support his argument, then indeed, we are cross-purposes. You seemed somewhat confused between tropospheric and stratospheric ozone and so I thought it might clarify matters if you explained how you thought it worked.
My understanding is this:
In the stratosphere, O3 reduces the energy reaching the surface because it traps incoming UV. (ie unlike N2, O2, and for that matter CO2, it is NOT transparent to incoming solar radiation). This warms the stratosphere but it is a cooling effect on surface climate. On the other hand, O3 is also a greenhouse gas so traps outgoing IR causing some warming. I believe the balance is towards a very small warming effect.
In the troposphere by comparison, UV is mostly absent and so the greenhouse effect is more important (but O3 levels are very low).
Reducing the O3 cools the stratosphere alright but it means there is more energy (UV) warming the surface and so no, the O3 hole is not a climate cooling mechanism.
- Brief overview of new IPCC report on oceans and ice risks
Daniel Bailey at 09:26 AM on 16 October, 2019"there is nothing skeptical here with all that about carbon dioxide levels causing climate change"
That the climate changed naturally before the impacts of humans became the dominant forcing of climate is uncontentious.
That the impacts of human activities are now the dominant forcing of climate is equally uncontentious, from a scientific basis.
Scientists (the actual skeptics) have evaluated all natural forcings and factors capable of driving the Earth's climate to change, including the slow, long-term changes in the Earth’s movement around the Sun (Milankovitch cycles or orbital forcings), and it is only when the anthropogenic forcing is included that the observed and ongoing warming since 1750 can be explained.
Natural vs Anthropogenic Climate Forcings, per the NCA4, Volume 2, in 2018:

Scientists have also quantified the warming caused by human activities since preindustrial times and compared that to natural temperature forcings.
Changes in the sun's output falling on the Earth from 1750-2011 are about 0.05 Watts/meter squared.
By comparison, human activities from 1750-2011 warm the Earth by about 2.83 Watts/meter squared (AR5, WG1, Chapter 8, section 8.3.2, p. 676).
What this means is that the warming driven by the GHGs coming from the human burning of fossil fuels since 1750 is over 50 times greater than the slight extra warming coming from the Sun itself over that same time interval.
In the early 20th century human activities caused about one-third of the observed warming and most of the rest was due to low volcanic activity. Since about 1950 it's all humans and their activities.
https://journals.ametsoc.org/doi/10.1175/JCLI-D-18-0555.1
https://onlinelibrary.wiley.com/doi/full/10.1002/wcc.522Further, the detection of the human fingerprint in the observed tropospheric warming caused by the increase in atmospheric concentration of greenhouse gases like CO2 has reached 6-sigma levels of accuracy.
https://www.nature.com/articles/s41558-019-0424-x
There have been many, many scientific studies over the past 175 years examining the properties of greenhouse gases, the radiative physics of carbon dioxide and the role it plays in the Earth’s atmosphere. One of the most comprehensive, recent and openly-accessible is the US 4th National Climate Assessment (Volume 1, released in 2017 and Volume 2, released in 2018). You can download the whole thing or by chapter:
https://science2017.globalchange.gov/
https://science2017.globalchange.gov/downloads/https://nca2018.globalchange.gov/
https://nca2018.globalchange.gov/downloads/FAQ’s:
https://nca2018.globalchange.gov/chapter/appendix-5/#section-1In short, human activities (primarily via the human burning of fossil fuels) have warmed the globe, which in turn are impacting the Earth’s climate.
Please demonstrate actual skepticism by reading the furnished sources before replying. - It's the sun
MA Rodger at 00:37 AM on 8 October, 2019ricieb1234 @1271,
Do note that the author of the BBC item quoted in the 'Myth' is David Whitehouse who is now known to be a fully paid-up member of the denialist squad. His take-away message in 2004 was:-
"This latest analysis shows that the Sun has had a considerable indirect influence on the global climate in the past, causing the Earth to warm or chill, and that mankind is amplifying the Sun's latest attempt to warm the Earth."
Yet this "latest analysis" informing the 2004 BBC article by Whitehouse concludes with the warning:-
"we point out that solar variability is unlikely to have been the dominant cause of the strong warming during the past three decades."
- It's not us
MA Rodger at 21:21 PM on 5 October, 2019richieb1234 @110,
The reflectiveness of cloud is the method by which SO2 provides climate forcing, this by providing aerosols to make the forming clouds shinier. But there is much complication. SO2 is not the only aerosol agent and such mechanisms are short-lived and local. Thus, say, SO2 emissions causing shiny clouds at high latitudes, especially during winter with long nights, will not have as much sunlight to reflect. And the longevity/altitude of the aerosol will differ by location.
The resulting cooling will be less localised.
And globally there is an unresolved issue here. The reductions in SO2 emissions which will follow from eliminating FF use and the resulting loss of its negative climate forcing has got some to worry that there will be a boost to AGW as we de-carbon our economies. Some work is saying this is not really much of a concern (eg Shindell & Smith 2019 [Abstract]) while on the other side of the debate we find Cowern (2018) who argues that such a boost is already happening and the strong warming in recent years is due to the reducing SO2 emissions.
- Increasing CO2 has little to no effect
jesscars at 12:51 PM on 13 June, 2019I have a couple of questions re. the historic vs future predicted relationship between CO2 and temperature:
If you look at the Vostok Ice Core Records, the relationship between CO2 and temperature is linear, and is approximately 1 degree change per 10 ppm change.[1]
1) Why is this not the expected predicted relationship of CO2 to temperature? Why does it go from 1 degree per 10 ppm to 1 degree per doubling, the first doubling being 300 ppm (then 600, 1200, etc.)? Why does the sensitivity of the earth's temperature to CO2 change so severely to have only 1/30th the sensitivity? What is the reason for this reduction in sensitivity?
2) Why does the relationship change from linear to logarithmic? There is a steady and consistent linear relationship of 1 degree for 10 ppm - why should this change to a logarithmic relationship of degree per doubling i.e. instead of 1 degree per 10 ppm, we now have 1 degree per 300 ppm, then per 600 ppm, then per 1200 ppm, and so on. What is the cause of the change of the nature of this relationship?
It seems to me that the "skeptics'" explanation - which assumes temperature is causal in the observed temperature-CO2 correlation - does not involve such erratic and unexplained behaviour.
N.B. The linear 1 degree per 10 ppm can be explained by the linear relationship of CO2 solubility in ocean water (at temperatures below 23 degrees, see link [2]).
As the temperature changes (measured by the atmospheric temperature), this causes the ocean temperature to change. Within the temperature range seen on the graph in link [2] i.e. below about 23 degrees, you would expect a similar amount of CO2 to be released or absorbed, per unit or degree of change, per volume of water, resulting in a linear atmospheric temp-CO2 relationship.
The Vostok Ice Core records also show an 800-year lag where temperature changes before CO2 does. This indicates that temperature is causing CO2 to change, not vice-versa. (The Shakun study only attempts to provide an explanation for this for the last deglaciation, not the entire duration of the Vostok samples (400,000 years), so really is inadequate.) This can be explained by the fact that the oceans take so long to heat or cool. So it takes hundreds of years for the warming or cooling to have an effect on the CO2 levels, as this has to happen via the oceans.
2) The causal mechanism to explain the temperature-CO2 correlation is explained by: natural causes (e.g. Milankovitch cycles, sun radiation cycles, circumpolar jet-streams, etc.) to be caused by ocean absorption of CO2, is expected
[1] http://joannenova.com.au/global-warming-2/ice-core-graph/
[2] https://i1.wp.com/www.geological-digressions.com/wp-content/uploads/2016/12/CO2-solubility.jpg
- It's the sun
Daniel Bailey at 09:02 AM on 25 April, 2019
Only if you're talking about the 1960s.

TSI has dropped off since then while temperatures continue to rise.
Actual scientists have unpacked the contributions of natural forcings to climate change; only by including the human-caused warming forcing can the upward rise in observed temperatures be explained.

And actual scientists have quantified the warming forcing from the GHG emissions from the human burning of fossil fuels and have found them to be over 50 times greater than the slight extra warming coming from the Sun itself since 1750

Your "friend" is no scientist.
- New research, January 21-27, 2019
nigelj at 06:23 AM on 4 February, 2019blaisct @4
With respect your understanding of the principles isn't correct. Therefore whether the logic is right or wrong is irrelevant.
The Beer Lambert Law is the linear relationship between absorbance and concentration of an "absorbing species". Not all gases absorb equally. Gases like oxygen molecule only absorb UV and break down in the very upper atmosphere above 80kms, and lower down its CO2 which absorbs long wave energy, and this is causing global warming near the surface which is what is relevant to us.
eesc.columbia.edu/courses/ees/climate/lectures/radiation_hays/
Shortwave radiation from the sun heats surface features. It explains some warming over the early part of last century, but not enough to set in motion some feedback effect causing hugely reduced albedo.
Regarding human caused changes in albedo since 1900. This doesn't explain global warming either. Urbanisation reduces albedo, but less than 1% of the world is urbanised. Deforestation increases albedo! So things essentially cancel out. Refer article below for a fuller review of the albedo issues:
www.skepticalscience.com/earth-albedo-effect.htm
Therefore greenhouse warming is the prime cause of global warming since the 1980's, and this in turn leads to reduced albedo in terms of reduced ice cover, and so some warming from SWR.
You say: "Albedo is a powerful variable in climate change. It is what causes all our weather, evaporates water and moves almost all weather systems for west to east."
I don't think so. I have only done some university geography, so not a climate scientist, but I was taught weather was caused by redistribution of heat from equator to poles etcetera, water evaporated if it was above zero degrees so is just basically due to the sun or greenhouse changes, and the flow of weather systems west to east was the coriolis effect and pressue differences. I guess the textbooks are all wrong and you are right (sarc). Or was your comment deliberate satire?
- Why does CO2 cause the Greenhouse Effect?! | Climate Chemistry
MA Rodger at 23:39 PM on 11 December, 2018dkeierleber @22,
(Sorry that this is a bit backwards in replying to your comment from the bottom paragraph up.)
I would agree with your final paragraph except to add that it concerns "the" greenhouse effect, thus it is talking about the Earth. Thus the major "physical processes" warming "the air" are Surface Radiation (396), Latent heat from Evapo-Transpiration (80), Incoming Solar Radiation (78) and Thermals ie heated by conduction fron the surface rather than "convection" which is how it is transmitted through the air (17).So in this context, the quote in the second-last paragraph from pp15-16 of Randall (2012) is saying that the vast majority (86%) of the heating experienced by the atmosphere originates from the surface. Most of this (70%) is due to radiation absorbed by GHGs.
The p25 quote in your 6th paragraph is only making explicit that the largest non-radiative part of atmospheric warming/cooling is evaporation which thus provides a balance (14%) to the net radiative flux. (The presence of the Trenberth Global Energy Flows diagram on p24 makes plain this meaning.)

The second quote from p25 is trying to say that there will be small amounts of this energy-transferred-that-result-in-a-local-heating-of-th-air which is then transfered away as warmth within air movements, its movement thus cooling some locations (that lose warmed air) and heat other locations (that recieve warmed air), "like the heating, ventilating and air conditioning system in a building." The point made is that such processes are small relative to the radiative fluxes.
Moving up to your 5th pargraph, the numbers you present are seen in the Trenberth diagram. But when @14 I called the absorption/emission of photons "rare," this was in slightly different terms, not energy as in Trenberth but as number-of-events. Consider that the energy held by a photon is inversely proportional to its wavelength. Thus a photon from the sun will be 30-time more energetic than a photon from the atmosphere. So the ratio of photons will not be 333/160 = 2 but 333*30/160 = 60.
And it was this sort of number I am describing when I say "the emitting/absorption of photons are a rare events and most absorbed photons will become added to the energy in the gas rather than being immediately emitted as another photon." This is because the average time taken to re-emit a photon is very long relative to the time a CO2 molecule has before it collides with another air molecule. We are talking parts of a seconds to emit a photon from a vibrating CO2 molecule at 15 microns (see Blauer et al (1973) p48) relative to parts of a microsecond between collsions (which can be more readily calculated).In your 4th paragraph, your reasons for "not buying" do not appear sensible. The first quote you make from p125 Siegel & Howell (1971) concerns photon absorption/emission and so do not concern the transfer of vibrational energy to/from other molecules. The three modes of gain/loss listed are 'spontaneous' (a photon emitted from an excited state) 'induced' (ditto but caused by a passing photon) and 'absorbed' (the capture of a photon causing an excited state or as on p128, "The absorption of a photon can cause a transition of some state of the atom or molecule to a state of higher energy.") The second quote in paragraph 4 is stating that only descrete wavelengths can excite a molecule, "bound-bound" meaning that the energy involved is not enough to rip electrons from the molecule.
In paragraphs 2 & 3, I see descriptions of doubt rather than reasons for doubt.
The first paragraph considers the GH-effect of Venus and is probaly best answered by this SKS post.
- Discussing climate change on the net
Eclectic at 13:22 PM on 30 November, 2018Sunspot @21 ~ intrigued by your earlier comment, I chased up the comments column of a Yahoo climate article.
The article was quite fair and reasonable (on AGW effects) . . . but Oh My . . . the comments column was a Niagara of 1- to 3-sentence denialist mini-rants. Maybe 98% denialist? Absolutely no way could that represent a randomized cross-section of opinion.
Is Yahoo being a magnet to half the crazy galoots in the USA? Do the crazy galoots simply join in there (having been rejected by their friends & relatives) in order to air their opinions & vent their anger? And yes, one could well believe that some of them are there as "paid actors" . . . or, in this modern automated age, perhaps many of them are simply Heartland-funded bots?
What is not clear to me is Yahoo's business plan, in all this nonsense. To gain reading clicks by stirring up the crazies, allowing them to vent in an echo-chamber . . . and keep them watching/clicking?
In comparison, the comments columns of WattsUp are almost half-sane. Yes, about a third of the posters are so intellectually insane that they totally dismiss the global warming mechanism of CO2/GHG's. And three-quarters of them are rabid political extremists, to whom the term charity (let alone the word tax) is anathema. A further one-fifth are such victims of their own Motivated Reasoning, that they say that around 90% of recent rapid global warming comes from 70-year and/or 1000-year oceanic cycles (or from cosmic rays causing clouding or unclouding . . . or whatever).
I don't bother closely reading the WattsUp articles ~ they are mostly trash & sour-grapes "spin". But I do skim through the comments super-fast, lookin for "names" with a track record of sane intelligence (names such as Nick Stokes, Mosher, and a few others also worth reading) ~ posters who are cool oases in that intellectual desert.
- Humans are pushing the Earth closer to a climate cliff
Doug_C at 06:50 AM on 17 August, 2018Bob Hoye @10
We are not in a cooling trend in North America, globally we are in a warming state of climatic transition which results in a disruption of local weather patterns.
You just have to look at the amount of heat that is constantly being added to the Earth's surface through the mechanism of radiative forcing from things like the massive emission of carbon dioxide by human activity.
Fortunately we have a meter for that located on this very page.
2.646 billion atomic bomb quivalent heat units have been added to the Earth since 1998 alone. Most of that absobed by the oceans in a band 30 degrees on both sides of the equator. A place where ice and snow cover is not growing.
Here in BC ice and snow cover is also not growing we are witnessing a rapid loss of alpine glaciers in British Columbia.
Near total loss of glacial ice expected in BC, Alberta by 2100
We did have greater than average snowfall here last winter resulting in much deeper snow packs. But this is duirng the winter months when insolation is at its minimum here. Snow falls here later in the year and melts sooner.
Resulting in a greater and greater occurance of catastrophic flooding.
Record flooding in southern BC
I see nothing to be encouraged about by the highly chaotic weather conditions we are being subjected to here in western NA or the increainsly catastrophics impacts of fossil fuel generated climate change.
The Earth is not cooling based on almost all the evidence, it is warming at a rate that is overwhelming most natural mechanisms to adjust in a way that will mitigate catastrophic impacts like the loss of coral reef systems.
https://www.nytimes.com/2017/03/15/science/great-barrier-reef-coral-climate-change-dieoff.html
Personally I have rarely seen the Sun in the last month and am glad that the large wildfire 3 kilometers to the north of my home has been put out. But much of this province is on fire with huge wildfire complexes that are joining together into incredible firestorms that cannot be fought. The same is happening right now in California. The smoke from BC reaches halfway across the continent and is causing unhealthy air conditions as far away as Manitoba.
BC smoke blankets Southern Manitoba
"Smoke from more than 500 wildfires burning in British Columbia has reached Manitoba prompting Environment and Climate Change Canada and Manitoba Health to issue a special air quality statement for the southern part of the province."
Far from being encouraged, for many of us the experience is of being part of a very large scale and long term disaster movie where the conditions become increasingly hostile.
- Trump should inspire us all, but not in the way you might guess
sauerj at 14:34 PM on 30 June, 2018@ villabolo #10
Thanks for the feedback. Very good point! Yes, from one person, I did encounter the reaction you describe.
Outcome of a small sample of verbal reactions: I have verbally given my "atom bomb" story to about 10 people (though I think it works better in written form, as in my FB note, linked above). Side Note: Most of these 10 people are either technical people (chemical engineers), or else folks already immersed in climate science & action (so, a very skewed slice of the overall population). It did "move" about half of them; "ho-hum" for another 1/3. But, for one notable person, my wife, it caused the exact same reaction that you described. She adoringly said, "You don't mean for me to believe that there are actually 10,000,000 atom bombs exploding all over the world every hour?" (so she got hung-up, right away, on step #1 of the story; without even getting to step #2, the thermal imbalance part (18k/hr); or step #3, man's consumption part (1k/hr)).To clearly describe the steps of this story (if you haven't yet read the FB note):
Step #1: The sun delivers to the earth 10mm hiro atom bombs of incoming energy per hour. All of this energy must leave for temperatures to remain constant [This latter part is another sticky, somewhat technical point, that I had to figure out for myself, as I was hung-up on the photosynthesis chemical energy (no-heat) part. But, eventually it dawned on me that even this chemical energy does become thermal energy, assuming equal bio-mass over time [when the chemical energy is converted to thermal energy by biological processes]. Presently, my write-up doesn't address this photosynthesis part of the energy balance story.]
Step #2: 18k hiro atom bombs per hour of the sun's incoming energy is restricted from getting out due to the increase in GHG's (primarily CO2). This part is easy to understand.
Step #3: 1k hiro atom bombs of energy is all of the energy that man consumes in 1 hour. … This puts #1 and #2 into perspective (which my write-up then goes on to give examples of perspective). This #3 perspective part is usually what gets a reaction out of people; here they start to put the scale of the thermal imbalance story into mental terms that they can viscerally relate to. And if they follow along so far, then, all of a sudden, the science becomes not just dry non-visceral words on the page, but a real, tangible kick in the gut, hopefully enough to ignite more impassioned energy toward climate action.My wife's reaction was not something that I had anticipated; it was completely different compared to my reaction in how this sequence (#1, #2, #3) profoundly (viscerally) affected me.
To fix this, I could try to explain the scale of what real, point-concentrated hiro atom bombs going off would be like. One option: Proportionally scale the sun's energy (10mm/hr bombs over the sunny side of the globe, 1/2 of its surface) down to 1 sq mile (the coverage of 1 real hiro bomb) and also down to 1 second (its blast duration, being conservatively long). How many hiro atom bombs of energy is the sun delivering to that 1 sq mile in 1 second of time? Answer: 0.0000283 equivalent bombs (or, maybe better said, 1/35000 of a real hiro bomb).
Another wording (I might try to figure out how to wiggle this into the document): "The sun delivers to a sq-mi plot of land in 10 hours what a real hiro atom bomb would deliver to that same sq-mi plot in 1 second." For me, that makes the sun's energy density sound like a lot; but, quite frankly, it is! But, obviously, NOT enough to decimate the land.Until I came up with the #1,#2,#3 atom bomb story, I was a bit foggy in having a deep technical understanding, in a visceral way, of the thermal imbalance, which is the fundamental basis for understanding what is causing global warming. I understood it in my head, but not in a scaled perspective sort of way, and also not in a way that I could convincingly explain it to others. Hansen has a picture of his grandchild (in his 'Storms' book) holding a 1-watt xmas tree light bulb, and he points out how this amount of thermal imbalance per sq meter is enough to cause huge instabilities to climate change. … This was a very endearing & tender picture, but this really didn't help me put the scale of the total thermal imbalance into clear perspective of scale. Was he trying to say that it was a lot of energy per meter, or that it wasn't a lot of energy per meter? … Now, with the help of the epiphany of my atom bomb story, I now know that 1-watt/sq-meter is not a lot of energy for that sq-meter, but is a lot of total energy over the whole globe (18k atom bombs/hr, and, more so, is 18x more than all the energy that man consumes) … [NOTE: 18k atom bombs is technically 0.6w/sq-meter (which I am getting from HERE).] But, without this, the lack of scale of perspective made it hard to put Hansen's story into relatable, useable or meaningful terms for me.
Although the atom bomb story (as stepped thru above) may not be effective for everyone, I have hope that it is effective for some people (maybe even many people). Enough so that it is one possible viable tool to help viscerally explain the fundamental science of global warming, yet still in a very scientific, factual way (no hyperbole). If it does work for anyone, it does so by giving people a meaningful scale of perspective that they can tangibly relate to and therefore internalize. … However, your constructive concern is very valid and is probably more of an issue than my small sample bias (w/ a skewed population) would lead me to believe. Thanks for the feedback!
- On climate change, zero-sum thinking doesn't work
Dan_the_Engineering_Man at 01:37 AM on 6 April, 2018This article " On Climate Change, Zero-Sum Thinking Doesn't Work" written by a guest Author on the Skeptical Science Website, was written by someone who is very politically charged and biased. But I wonder if the Author sees the larger picture? If so, it would be written without the Political Spin. I do not believe that Conservative Thinkers, who can be broken down as Republicans, Tea Party Patriots, Sons and Daughters of the American Revolution, NRA Members, Factory Workers, Small Business Owners and Workers, Hunters, Fishermen, Policeman, Firemen, Military Personnel both presently serving and Veterens, Mothers and Fathers, and many others including Billionaires like our President, get up in the Morning and want to ignore Science and destroy the Planet. I do not believe this at all. If we examine the Facts, Reality will guide us to the correct conclusions and the Path we should collectively take. The Political Spin ruins any inteligent examination.
When you look at a Mountain, there is a Tree line, the Trees can not grow above that Altitude. That is because CO2 is heavier than Air, and there is no CO2 at the higher Altitudes. CO2 is not a Greenhouse Gas.
I believe there is Climate Change, as China and the greater Asian Region of the Planet is rapidly becoming Industrialized. The people in Asian are going from riding Billions of Bicycles to riding in Billions of Automobiles, Trains, and Planes. China now produces more than 6 Times more Steel than the rest of the World combined. China is also leading in the Manufacture of Aluminum, all Chemicals, Paints, Paper, Cloth, everything. The Production of everything in China does not stop just because the demand for the products decreases. China keeps it's people working even if there is not further demand for it's products. There is more Steel Plate on the Ground in China, then the rest of the World can use in a Year, and yet Chinese Steel Mills continue to produce at record amounts. This massive uncontrolled industrial monster in China has no Enviromental Controls Agency, no OSHA Safety Agency, and No Agency to look at Energy Efficiency. This massive uncontrolled industrial monster in China is set on destroying any Industrial Factory outside of China. And when this Task is complete, and Industry outside of China is destroyed, China can raise the Prices of it's Products as it wishes.
The Waste Energy Heat from this massive uncontrolled industrial monster in China, is carried to the North Pole by Trade Winds. The Artic Ice is melting, but there are reports that the Antartic Ice is Growing. This fact causes Anti Global Warmers to cry Foul to those believeing in Global Warming. So who's observation is Correct? Both are Correct! But CO2 is not a Greenhouse Gas. In fact, the Sumation of all the Energy that Man has created, in all the Countries on the Planet, in one Year is less than the Energy that the Sun Transmitts to the Surface of the Earth in 1 Hour. This is simple Math any High School Student can do. The Sun imparts much greater than an average of 160 W of Energy per Sqaure Meter on the Surface of the Earth. 1/2 the Surface of the Earth facing the Sun is still 260 Tillion Square Meters. 260,000,000,000,000 X .160 KWatts X 24 Hours =
998,400 TWH of Energy of from the Sun in one Day on the Earth.
Man Produces 157,500 TWH per Year from all sources of Energy.
https://en.wikipedia.org/wiki/World_energy_consumption
Therefore, our Sun imparts more energy on the Earth in 4 Hours, than man uses in a Year. Man is not causing Global Warming. Man may be Poisioning Asia, polluting the Air and Waters in Asia, Killing the Wild Life, destroying Humanity in Asia, preventing the Native peoples from living off of their changing habitats, and man be causing Regional Climate Change, but Man is not causing Global Warming, and CO2 is one of the best gases man has prodcued.
- 2017 SkS Weekly Climate Change & Global Warming Digest #35
BilB at 08:06 AM on 4 September, 2017Good John Hartz article, and good to see terms such as "energy in the atmosphere" entering the conversation.
What is missing in this article is the reason why, or how, the "energy in the atmosphere" makes a difference.
It is all about density.
The 60's high school science that I grew up with, and take note here that this includes the bulk of the baby boomers who are commanding the bulk of the world's wealth and political power, was that storms are caused by the sun's energy warming air which rose carrying moisture with it to form rain. I now believe that this is demonstably a false understanding of how rain making works (I hasten to add that I am not a scientist and this is entirely guesswork on my part). The percep[tion that hot air causes storms has been utilised by the denialists to obfuscate the real atmospheric processes, as they concentrate on the notion that Global Warming will result in ever higher daytime air temperatures, which we know full well is not the case and Gabriel Bowen points to what really happens.
The one piece of knowledge that is missing from general public knowledge is that humid air is lighter than dry air, it is all about relative density. It turns out that high humidity air, although only a little bit lighter than dry air has a very large uplift capacity relative to warm air. In fact by my back of the envelope calculations it takes a 20 degree C difference in dry air to equal that humid air uplift capacity.
So what we see in the environment is thermal energy creating uplift and this level of uplift gives us the spotted fluffy clouds of a standard summers day where the uplift rises to a level where there is a temperature and density barrier which causes the moisture in that air mass to begin to condence into larger droplets and the air energy is expended in turbulent air movement and infra red radiation, but no rain formation. It only dawned on me recently what mists and clouds are about when I drove through a morning mist near my business premisis. A mist is where the moisture forms droplets large enough for the uplift effect of the density difference to balance out and the moisture cannot rise until more energy is delivered with the morning sun, else bigger droplets form causing dew (we often sense a warmth from such air as the latent heat of condensation warms the carrying air).
My conclusion is that rain clouds are formed not by thermal up lift but by humidity uplift. It was not until I realised this that I understood why there can by storms in sub arctic environments.
So the full story is that Global Warming delivers heat to the oceans (and the land) thereby increasing the average air moisture content. This moisture content moderates the average air temperature and the increase in average air temperature is predominately visible in the average night time temperature, ie as the average night time temperature increases it is seen as the time of the early morning at which the temperature begins to fall (later and later as Global Warming intensifies and invisible to most people who are generally asleep and do not experience the time of change).
Climate Change is predominately the impact of the increase in atmospheric energy in the form of atmospheric moisture, and the primary driver of how that makes a difference is the relative density of moist air over dry air. The density difference creates the atmospheric overturning effect and volume of the moisture both increases that effect and causes the increase in rain volume that we are seeing around the globe.
The simple message is that CO2 increase is the primary driver of Global Warming and moist air increase density difference is the primary driver of Climate Change.
It would be interesting to know if Judith Curry and her cohorts understood this important point.
- Surrendering to fear brought us climate change denial and President Trump
ubrew12 at 10:48 AM on 19 July, 2017At least in America, there's a culture divide as strong as any seen since the Civil War, and largely involving the same protagonists (one could even argue over the same issue: whether all people are created equal). Fossil money just attached AGW to that divide and it became part of people's cultural identity. My sister's an Evangelical Christian. It's not that she doesn't think, in her heart of hearts, that fossil CO2 is causing the current warming. It's that she's being told that until abortion is overturned, all other issues (even a sensible person's 'issues' with the current American President), take a backseat. So you get this situation, in Red State America, where they are telling you to give up your 'Global Warming Religion' and at the same time building up renewable power as quick as can be. That way they can serve the pulpit on Sunday and the planet the rest of the week.
- Increasing CO2 has little to no effect
vatmark at 06:18 AM on 30 April, 2017I had a look at the link to general circulation models. After reading that my conclusion is that it seems like we are not much wiser
"For all the millions of hours the modelers had devoted to their computations, in the end they could not say exactly how serious future global warming would be. They could only say that it was almost certain to be bad, and unless strong steps were taken soon, it might well be an appalling catastrophe."
This does not convince me that climate models are doing it right by using backwards calculations where emitted radiation is causing the temperature of layers below.
After reading this I don´t get much wiser either:
https://pubs.giss.nasa.gov/docs/2011/2011_Hansen_ha06510a.pdf
It seems like he is saying that if the thermal radiation emitted from the atmosphere, it causes the temperature to increase?
He says that observed heat from the earth is not in balance, the heat flux from the sun that heats earth is larger than the amount of heat that earth emit to space. I find that logical, the earth is not equally warm throughout, and then it has to emit less energy. Only when the system is equally warm in every point inside, it emits as much heat to space as it receives. If we compare to a steam engine and the troposphere is the waterfilled cylinder, then it has to have an even temperature from the surface all the way up to the tropopause before the heat flux is equal to what the sun deliver to the surface.
I really don´t understand this radiative forcing and radiative imbalance, how does it work? How can less heat emitted from the atmosphere cause more heat elsewhere? The more I read about it, the more confused I get.
Hansen wrote about satellite measurements showing an imbalance of 6.5W/m^2 averaged over 5 years. Then he says it was thought to be implausible and they made instrumentation calibrations to align the devices with what the models say, 0.85W/m^2.
He says that the forcings is known accurately, but when measured it is corrected to follow the models. They don´t correct the models according to measurements?
How can forcings be known accurately if they are not a result of measurements? Not any of the studies show how any numbers of forcing has been achieved. And I can´t find any descriptions of the heat flow the way I think it should be done, or rather, the way I like it. Just using measured temperature to find out how much heat there is in the different parts, and from there you can describe the heat flow. That is how we always have done it, and it works. Steam engine, it works perfectly for earth, why use anything else? My teacher must have been very smart, or dumb enough to keep it simple. I was directed here after talking to people in the march and they couldn´t answer my questions. I thought it was strange, so many people marching for science, but no one knew anything about heat, but they all carried signs about temperature increasing and climate problems. I always thought that the issue was about the atmosphere getting so hot that it came near to surface temperature, from top to bottom, because that is what it takes to heat something up usually. But this is just strange and now I think that it must be a good thing Trump won the election. I thought he said some stupid things, but he seems to act like he knows what he´s doing.
I guess I won´t be coming back here anymore. Good Luck with your campaign, you are going to need it.
- CO2 lags temperature
Adri Norse Fire at 00:17 AM on 16 February, 2017Well, I did not mean to sound pedantic. First of all I want to say that I am not a native speaker of English, I am using the translator to talk to you ... and that may cause some misunderstanding. Anyway, I apologize.
Rob Honeycutt
I am not working hard to deny anyone, what I say is what I have seen in documentaries and in magazines, that's all. I'm not an old scientist. But unlike you, Rob, I do not see that the establishment in which you believe has an indestructible foundation, this is not like the theory of gravity, there is a plenty of people who are also scientists who disagree with you In this subject or with the supposed orthodoxy to which you refer.
'' Why do you think you're dismissive of the science? ''
I do not despise science, I think that until now my arguments have not been ideological but scientific data that obviously are within the reach of all.
Tom Curtis
I want to remember that my first comment was a few months ago, having that in perspective; You're right when you say that my last answer does not exactly respond to his response, but I was thinking in the background of the whole conversation that was whether CO2 and therefore human industrial activity are causing the global rise in temperature.
''What is worse, you ask, "How do they know that CO2 does not come from other sources that also have low levels of radicarbon But or course, Daniel Bailey has already answered that question with 10 lines of evidence.'' He didn't and this answer was not addressed to him; That's why I said "sorry for my ignorance," because if you can not know how much low-radiocarbon CO2 comes from other natural sources due to lack of studies on the subject or for any reason, how can you faithfully calculate the amount Of CO2 emitted by human industrial activity? I mean, we can distinguish that something has different properties, but we do not seem to know how these properties work or whether they hold them through their natural cycles which is an imperative for the final calculation.
I did not say that CO2 or CH3 does not produce a greenhouse effect, but the feedback effect of CO2 and other minor gases is irrelevant to climate compared to other greenhouse gases.
If you like correlations so much why do not you look for some of the temperature and CO2 for the last 10,000 years? Does this correlation count as evidence?
http://www.lunarplanner.com/SolarCycles-images/Climate-Timeline-10000yrs.png
http://www.ferdinand-engelbeen.be/klimaat/klim_img/antarctic_cores_800kyr.jpg
And what about this chart?
http://kabarkampus.com/wp-content/uploads/2014/04/Dede-Prabowo-Wiguna_ilustrasi-1.jpg
http://s3.amazonaws.com/wboc-digital/production/sites/wboc-weather/wp-content/uploads/2016/04/28214154/Capture21.png
The question is whether we have the highest concentration of atmospheric CO2 in 800,000 years, without going further, why the current temperature is 1.5 ° lower than the medieval warm period?
''Finally, I will note that "recovery from the Little Ice Age" is a description of what the temperature does over a period ending about 1850. It is not an explanation of that warming.'' Indeed it is an assumption that the rise in temperature was related to the Little Ice Age. This also explains the warming of the 20th century. Someday I'll explain my crazy theory, but not right now. I apologize again.
John Hartz
Only me?
- It's the sun
michael sweet at 09:47 AM on 15 October, 2016Bill,
It strikes me that you are speaking with a great deal of confidence for someone who has not read very much about AGW.
In the Scientific Guide to Global Warming Skepticism, there is an illustration at the bottom of page 3 that shows why we know without doubt that the warming is due to carbon dioxide and not the sun. If the Sun was causing warming we would expect days to warm faster than nights, summer faster than winter, the stratosphere to warm with the troposphere, the same amount of heat to be returning to Earth as backradiation, the same heat escaping to space and several others. We measure that nights are warming faster than days, winter is warming faster than summer, the stratosphere is cooling as the troposphere warms, more backradiation, and less heat is escaping to space. You will have to counter all of these observations if you wish to support your claim that unmeasured TSI increase could be the cause of warming.
I suggest that you forget all the propaganda that you have read at WUWT and other skeptical sites and try reading the Newcomers Start Here post on the home page. If you continue to post here with claims supported only by your opinion you will not get very far. Your opinion as an engineer about TSI measurements does not count much against the observations I have summarized above. It is not necessary to have any TSI measurements to be sure that the warming is caused by carbon dioxide pollution and not the Sun.
Keep in mind that the warming caused by carbon dioxide pollution was predicted in 1896 by Arhennius. Arhennius predicted most of the observations that I listed above 100 years before they were measured. You are countering a 120 year old scientific prediction with an ad hoc explaination that has a great deal of evidence against it and no measured support.
- It's the sun
Bill N at 03:43 AM on 15 October, 2016Hey again @Eclectic. I decided to make a separate post on the stratospheric cooling issue to keep the TSI instrumentation optical stability postings separate.
My background for this issue: Masters degree in Physics. As an optical engineer, developed and/or utilized thermal modelling of spaceborne instruments and spacecraft that were heated by the Sun and cooled by their emitted IR radiation, determining then their internal and surface temperature environments under solar variations induced by spacecraft orbital and orientational changes.
Opinion on maturity of science: As far as I can tell, the science and modelling of solar induced warming of our Earth, especially when combined with the influences of greenhouse gasses present (manmade or natural), has not matured to the point to be able to definitavely conclude that the observed temperature distributions in our atmosphere indicate that manmade greenhouse gas emmisions are responsible for the observed global warming as opposed to a long term TSI increase. Heck, even a few years ago the "official" (IPCC) position was that solar TSI changes had essentially no influence on the Earth's temperature. Only recently then has the science matured to the point that it is now understood that long term TSI changes could indeed significanly change the average Earth temperature. Having only just found this out, claims then that the science has matured so rapidly since this discovery as to be able to distinguish between TSI based changes in our atmosphere and greenhouse gas based changes, seems highly dubious.
"Mixing" issue: Has the recent modelling included the effects of "chaotic mixing" of the stratoshere with the rest of the atmosphere. After all, this is long term warming we are talking about. Certainly the daily winds will "churn" the entire atmosphere to the point as to "swamp" layered atmospheric temperature predictions of one model vs another.
Greenhouse gas perturbation: Assuming that the above "mixing" issue has been properly accounted for, there is still the issue of greenhouse gas induced perturbation in the atmospheric temperature distribution. This will occur even if a solar TSI increase is causing the warming. So when modelling solar induced heating, the "atmospheric layering effect" of the natural greenhouse gasses present must still be included. My suspicion is that this is not being done by the folks attmpting to differentiate between solar and manmade greenhouse gas warming. It is simply a mistake then to model solar warming without including the "atmospheric layering effect" of the natural greenhouse gas that is always present. Once this effect has been properly included in the modelling, I strongly suspect that there will not be a significant difference between the predicted stratospheric cooling of the solar warming model and the manmade greenhouse gas model. As is well understood, long term geologic records show that natural greenhouse gas levels will indeed rise and fall with the Earth's temperature, regardless of the reason for the temperature change. So even if the warming is solar induced, don't forget to include the measured increase in greenhouse gas levels that go along with it.
Opinion: So IMHO, it can not be concluded at this point in our science and modelling, that the observed stratosperic temperatures indicate that the warming is due to manmade greenhouse gas increases as opposed to solar warming.
- These are the best arguments from the 3% of climate scientist 'skeptics.' Really.
Aaron S at 02:30 AM on 2 August, 2016Not all skeptics of climate models deny that the trace gas CO2 is a significant GHG and directly capable of about 1.1deg C warming. Rather some debate the sensitivity of Earth's climate to changing the abundance of CO2 and other GHG because of uncertainties about the feedbacks that define most of the IPCC anticipated global warming (Base Case- say A2 scenario). Your consensus argument is problematic to me. Science is dynamic and so are scientists views (hopefully), and thus the claim of certainty in climate science is also dynamic. Even if there is certainty now, new data could introduce uncertainty as it guids us towards reality.
Currently, climate sensitivity is being challenged by data because Galactic Cosmic Rays (GCR) seem to keep emerging as a valid mechanism for forcing climate (3 recent papers below). This is significant because the sun spot number (SSN) is a valid proxy for solar activity (2), which includes TSI and magnetic field strength. The sun's pattern as observed in an 11 year running average of SSN shows that the sun's activity more than doubled from 1900 to 2000, and the absolute value of the slope of the trend was just under 3x as great from 1900 to 1950 as the negative trend was from 1950 to 2000. Currently, we are decending from the sustained solar maximum into a solar minimum. Your list above avoids this, and seems more a strawman argument by suggesting one man's opinion represents that of skeptics (Mann's link to an article about natural climate change says little about data and nothing about new insights into GCR). This page seems to also ignore the potential for the same sort of lags for solar activity that science envokes for the hiatus in explaining less antartic warming than anticipated or the hiatus.
I have almost no doubt that humans are causing significant global warming from GHG plus the feedbacks (as indicated in the papers below). In my own unpublished (for fun) models, I can not recreate global temperature data (HadCrut4) without significant AGW. For me, it is an invalid position to deny this. However, the body of literature for GCR forcing climate indicates to me they are 'likely' a climate forcing mechanism despite what the IPCC suggests, and to be fair several key papers have been published about GCR and solar activity's role in climate since the last IPCC publication. Also, there remains significant uncertainty about how much influence GCR and solar activity play in climate, there remains uncertainty if they play a role at all. However, there are valid questions lurking in the data:
What is the threshold for literature about GCR to actually be considered in an IPCC climate model? Do you really think the current assemblage of climate models has the low case confidently in its range? What happens to the IPCC and climate researcher credibility if we enter a significant Maunder like solar minimum and realize the sun is a stronger driver than in any model?
http://www.nature.com/nature/journal/v533/n7604/full/nature17953.html
http://m.pnas.org/content/109/16/5967.full
http://m.pnas.org/content/112/11/3253.full - It's the sun
Tom Curtis at 01:24 AM on 23 December, 2015matt sykes @1160, the actual quote from the advanced version of the OP is:
"Unfortunately observational low-level cloud cover data is somewhat lacking and even yields contradictory results. Norris et al. (2007) found
"Global mean time series of surface- and satellite-observed low-level and total cloud cover exhibit very large discrepancies, however, implying that artifacts exist in one or both data sets....The surface-observed low-level cloud cover time series averaged over the global ocean appears suspicious because it reports a very large 5%-sky-cover increase between 1952 and 1997. Unless low-level cloud albedo substantially decreased during this time period, the reduced solar absorption caused by the reported enhancement of cloud cover would have resulted in cooling of the climate system that is inconsistent with the observed temperature record."
So the jury is still out regarding whether or not there's a long-term trend in low-level cloud cover."
(My emphasis)
Your version is a rather blatant misrepresentation of the text.
Despite that, I will bite. Dana elsewhere says:
"In reality, the CERN experiment only tests the bolded step in this list of requirements for cosmic rays to be causing global warming:
1) Solar magnetic field must be getting stronger
2) The number of cosmic rays reaching Earth must be dropping
3) Cosmic rays must successfully seed clouds, which requires:
4) Cloud cover on Earth must be declining"- Cosmic rays must trigger aerosol (liquid droplet) formation
- These newly-formed aerosols must grow sufficiently through condensation to form cloud-condensation nuclei (CCN)
- The CCN must lead to increased cloud formation
(My emphasis)
The alternative to their growing "...sufficiently through condensation to form cloud-condensation nuclei (CCN)" is that they simply evaporate away to quickly due to their small volume and large surface area. So, here is a cloud chamber in action:
So, do the rapidly forming tracks then gradual dissipation indicate that the liquid droplets are growing through condensation, or just fading away? How does just seeing this clould chamber in action make it obvious that they are growing through condensation rather than dissipating?
And that, of course, is in a supersaturated solution - not normal atmospheric conditions. So, yes, I think the jury is still out on whether or not cosmic rays can lead to the formation of clouds - and looking at cloud chambers does not resolve the issue. Certainly, at least, if you actually look rather than bringing your prejudice to the table.
- Why climate contrarians are wrong
robert test at 01:39 AM on 20 December, 2015Thank you for reprinting excerpts of the piece published in Scientific American. It is leading me to reread Whewell.
Unfortunately, the author here seems to me to completely misread Whewell treating his theory of rationality as much less important than it actually is and getting his essential ideas completely wrong. Whewell uses the term 'induction' but it means something other than our usual notion of inductive inference. It's closer to Pierce's notion of abduction.
The author has Whelwell sounding like an old Cartesian – to believe a theory it must be supported by a consilience of inductions. No, – Whelwell's claim is the opposite of this: a consilience of inductions is sufficient to warrant belief in the theory. Consilience is sufficient to verify a theory. Whewell makes a much stronger claim and offers a much more sophisticated analysis of scientific rationality than the author suggests.
But Whewell aside, the author makes a more egregious error. First, I completely accept the fact that we are causing global warming by emitting CO2 into the atmosphere. The evidence is abundant.
The author of this piece seems to conflate the evidence for warming with the evidence of the human cause of this warming.
He cites “multiple lines of inquiry—pollen, tree rings, ice cores, corals, glacial and polar ice-cap melt, sea-level rise, ecological shifts, carbon dioxide increases, the unprecedented rate of temperature increase—that all converge to a singular conclusion.”
But the conclusion is global warming. Only the last two "lines of evidence" i.e., increase in CO2 emission and unprecedented rate of warming are causally related to anthropological global warming.
Certainly the author is right to point to a convergence of evidence for human causation and I believe there is such a convergence. And the author is right in saying that opponents of AGW need to display a convergence of evidence supporting a different, better, and more coherent theory that explains the data.
Opponents of AGW have utterly failed. But so has the author of this piece.
Let me emphasize my position: AGW is well-supported by a convergence of multiple lines of evidence - just not the evidence that the author of the above piece provides.
The author of the above piece shows in the end that he understands the problem. Opponents of AGW have no coherent opposing theory – its the sun, its natural cycles, its cherry picking here and there. This is important
I know that there are many who write for this site that are capable of writing a piece, as eloquent as the one above, excerpted from Scientific American, but do a better job with the science and the evidence for human causation.
In short, is there anything like a Whewellian convergence of evidence showing multiple lines of evidence supporting the theory that that carbon dioxide is causing the warming? I would like to see this narrative better developed than it was here.
- The latest global temperature data are breaking records
dcpetterson at 04:23 AM on 17 June, 2015Wol, I think you're right, it's an argument that should be made. However, denialists are clever in their capacity to disunderstand fact.I've actually had this conversation with some deniers.
Yes, water has a higher heat capacity than gas. That means it's a good heat sink, and can absorb all that nasty heat without causing problems. Heat is vanishing into the oceans, where it is hardly raising ocean temperatures at all. This is just more reason why we needn't do anything about global warming--all that heat is vanishing down the ocean hole.
Believe it or not, that is the argument I've heard. Of course, you and I know that heating the oceans, even a little bit, is dangerous--it affects sea level, and chemical balance, and ocean currents, and changes zones where various ocean creatures can live, and changes precipitation, and on and on with dozens of dangerous consequences. The problem is that these are at least as hard to explain as the truth about (say) tropospheric temperatures, whereas it is very easy for deniers to just keep repeating how very little oceans have actually warmed up.
- There is no consensus
Stephen Baines at 06:31 AM on 19 December, 2014"The enormous evidence base that you cite does not preclude other factors causing the most recent warming."
Actually, it does preclude them as that list is really rather small. It would have to be something that affected the net heat balance of the earth by affecting incoming radiation (solar inputs, aerosols, clouds), the reflectivity of the earth (ice caps, land use changes) or the ability of the surface to cool (greenhouse gases). The only thing that has been changing in a way that should increase global heat balance over the last 40 years are greenhouse gases.
Your equivalent of H pylori would be to discover a new way for heat to be produced, absorbed or lost by the atmosphere in a large enough quantity to challenge the importance of those other factors. I'd argue the likelihood that such a missing component of the heat budget exists and has not been seen is virtually nil, because we can close the heat budget now.
"and whilst you are right that there is a lot of knowledge about paleo climate I have yet to see anything that comes close to proof that C02 changes are the main factor in those. "
First, what explains variations in paleo climate does not have to be the same thing that explains current climate change. I.e., The glaciations were not initiated by CO2, but they were exacerbated by feedbacks that increased CO2. Current warming is only really related to changes in greenhouse gases though.
Second, we will always know less about what drives paleo climate because we know less about the key factors that drive global heat balance in the distant past than we know about the present, for which we have precise measurements. The lack of certainty about past climate variations does not undercut what we have learned by studying current conditions. Still, there have been puzzles raised by past climate conditions that have seemed to challange the consensus, which has generated futher research to understand the factors underlying the energy budget better for those periods. I can't think of a current case in paleoclimate, however, that hasn't been reconciled with the accepted role of CO2 in climate once more was understood about conditions affecting the earth's energy balance.
"As I said before icecaps existed at both poles when C02 concentrations were 100 times the current levels."
A case in point. Actually, the high CO2 concentrations during large glaciations in the paleozoic were discovered by scientists trying to understand how the earth became deglaciated after essentially freezing over. Glaciation of the earth should have been hard to overcome because a white earth reflects a lot of sunlight, and therefore greatly reduced incoming energy. That lead many to doubt evidence that the earth was actually glaciated — because it still would be.
But, the glaciations alsostopped processes that typically removed CO2 from the atmosphere, allowing it to build up, which heated the earth and allowed the glaciers to melt. So paradoxically, the phenomenon you hold up as challenging a role for CO2 in climate, is actually understood by scientists to reinforce the idea that CO2 is important in climate.
- An externally-valid approach to consensus messaging
mancan18 at 10:15 AM on 24 June, 2014Classifying people into left, right, socialist, communist, greenie, or fascist is not going to reflect the scientific consensus along political lines. Such terms are lazy pseudo-intellectual classifications of people so that opposing political arguments in a debate can be easily dismissed using a stereotype.
With regard to global warming and climate change, it seems that people who believe that AGW is actually happening seem to have at least a rudimentary understanding of some aspect of the science, while those who don't believe that AGW is happening do so more for political or commercial reasons than for scientific reasons.
To the wider public, the AGW debate appears to be more political than scientific and may be the cause of the disinformation/ignorance gap. Also, the scientists and political groups arguing that AGW is happening spend more time on the indications and the impacts of AGW, rather than the basic science behind the theory which isn't articulated often enough in a manner that the wider public understand.
The whole global warming debate can be easily summed up in terms the public can understand:
* That CO2 is a greenhouse gas due to the interaction of the CO2 molecule and infrared radiation from the sun causing it to warm, just like microwave radiation in a microwave oven heats water molecules and cooks our food, or long wave radio waves being bounced off the ionosphere to make long range radio communications possible, or ultraviolet light causing sunburn, or ozone stopping ultra violet light making life possible on the planet.
* That CO2 is accumulating in the atmosphere mostly from burning fossil fuels and land clearing, and if the planet doesn't warm as a result, then some of our understanding of the basic science which forms the basis of our technological society is seriously flawed. This is the basis for the Global Warming argument.
* That warming of a fluid or gas increases the turbulence of the motion of the atoms of the gas or fluid. It is true in a container in a lab and it is true for whole planet. This increased turbulence will change the weather patterns which will change the global climate. This is the basis for the Climate Change argument.
Everything else is the mere observation of the data and the interpreting what it means. That is where the confusion occurs.
The basic science can be easily understood. despite all the noise of the current wider debate.
If the planet doesn't warm due to increasing greenhouse gases then that indicates a deep flaw in our scientific understandin and those who believe it won't warm believe in magic.
- Global warming is being caused by humans, not the sun, and is highly sensitive to CO2, new research shows
Tom Curtis at 12:30 PM on 11 January, 2014Climate Agnostic @12, if your point is the very narrow and technical point that it is theoretically possible that global temperatures could continue to rise after the forcing that caused that rise had started to fall, then I have already conceded that point. As it happens, that happens every year when the seasonal peak temperature occurs in August though the relevant forcing (NH summer insolation) peaks in July, and falls thereafter.
However, as I have pointed out @10, the merely theoretical possibility that the increase in insolation to 1950 was the cause of the increase in temperature to 2014 is inconsistent with observations. As a candidate scientific theory, it has been falsified. Therefore that merely theoretical, but in fact falsified possibility is irrelevant to this discussion. At most your point is that the statement:
"we know the sun can't be causing the current global warming because solar activity has declined slightly over the past 50 years"
represents a contingent (inductive) argument ie, one that is not guaranteed to be valid under all circumstances. But unless you wish to argue that all inductive arguments should be avoided, that is irrelevant. The number of circumstances under which the argument is valid far exceeds those under which it is invalid, including the current circumstances as shown @10. Therefore the only 'flaw' in the argument is that it provides less certainty than can be obtained by a more detailed argument.
Now, either you know that the Sun is not the cause of the continuing increase in global warming after approx 1960, in which case you are arguing a mere technicality; or you do not, in which case you are massively confused. The later appears likely in that you appear to think the possibility of ongoing warming from a declining forcing is independent of the lag in the forcing. That is false. If there is no lag, then the increase in temperature at any time will exactly correspond to the increase in forcing, so that at the peak of forcing, you will also be at the peak in temperature.
- Temp record is unreliable
Tom Curtis at 06:22 AM on 18 October, 2013dvaytw, in response to the statement that:
"... if anyone wants to claim that CO2 levels in the upper atmosphere are causing ground level increases in temperature, there would need to be much greater warming there, which is demonstrably not happening"
I would point out that, first, "skeptics" greatly exagerate the expected amount of warming due to CO2 (and other anthropogenic factors); second, scientists have always expected that other short term factors will cause fluctuations in the increase of temperature so that, over short periods it may be much less than is expected over the long term, or even negative; and that third, a very powerfull short term factor is known to be depressing the rate of temperature decrease, and in fact accounts for nearly all of the discrepancy between the actual temperature increase and that predicted by the models.
With regard to the exageration of the expected rate of warming, this is typically done with graphs such as this one by Murry Salby:
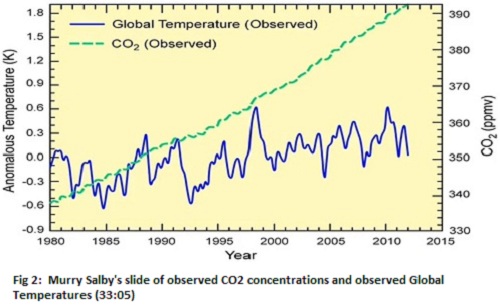
Such graphs may be created in ignorance, by simply scaling the (smoothed) CO2 and Temperature graphs to have a common standard deviation. Such a scaling ignores the fact that annual fluctations in CO2 concentration are too small to significantly effect global temperature, and so on short times variations in CO2 are not expected to match variations in temperature. As a result the scaling does not reproduced the expected temperature increase. That mismatch is exagerated if the match is done between annual (or worse, monthly) temperature variations and a smoothed CO2 curve as done above.
In some instances, however, including that of Salby, the exageration must be deliberate. That is because the same authors show graphs of the expected temperature increase as a function of CO2 concentration over the coming century. As a result, when they show the short term "prediction", they must know that they have changed the relative scales of CO2 concentration and temperature, thereby mistating the predicted increase in temperature from the increase in CO2. This can be seen by comparing the prediction at the scale used for centenial predictions with that used over the last few decades:
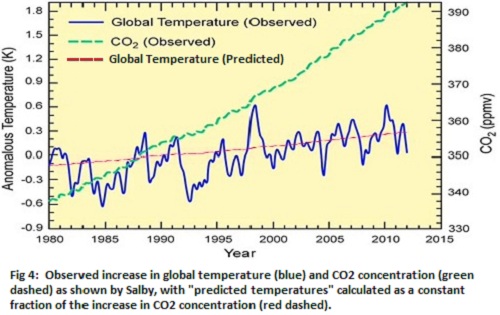
As can be seen, with an honest scaling, recent temperature increases have closely matched those predicted by the IPCC Assessement Report 4 (AR4). To avoid any misunderstanding, however, it should be clear that the "prediction" above is produced by simply using the same scale ratio between CO2 and temperature as is used in Salby's centenial comparison, and slightly understates the actual AR4 short term prediction, which was for 0.2 C per decade. Salby's graphic manipulations are discussed in more detail here.
With regard to the expected short term fluctuations, that can be seen in the temperature record up to 2005 (when the short term temperature trend met or exceeded IPCC predictions). During that period, however, there are many short term periods with zero, or slightly negative growth:

Climate scientists are not utter fools. They can read temperature graphs as easilly as anyone else; and could see, therefore, that a prediction of temperature increases without faltering (ie, monotonic increase) was already falsified, and would not be so foolish to frame their predictions in a fashion that was already falsified. The assumption that a short term low trend in temperature increase somehow falsifies AGW, however, tacitly assumes that they were such fools, for it assumes a "hiatus"not greatly different from "hiatuses" that occured before the predictions will falsify AGW.
Nor do climate scientists predict short term fluctuations merely to save appearances. In the CMIP5 model intercomparison for IPCC Assessment Report 5, using the scenario with the strongest warming (RCP 8.5), over 8% of 15 year trends with a start year of 1970 or later, and and end year of 2015 or earlier are smaller than the HadCRUT4 trend since 1998. Indeed, 4.48% are negative and there is one 15 year trend of negative 0.15 C per decade. The prediction of short term fluctuations and hiatuses comes from the models themselves. They are not ad hoc afterthougths. They do not typically show up in statements about predictions because they represent short term chaotic factors that have no influence on the long term trend. Consequently they do not coordinate in position across all models in the ensemble, and do not appear in the ensemble mean. Indeed, the lowest 15 year trend in the ensemble mean over that period is more than twice the HadCRUT4 trend since 1998; but that is because the ensemble mean has eliminated short term non-forced fluctuations while the real world has not. Climate scientists know this, indeed insist upon it. So-called "skeptics", however, blur the distinction whenever possible.
In this regard, it is worthwhile noting that the peak temperature of the 1997/98 El Nino was 0.6 C warmer than the La Nina years on either side of it (see first graph). That is the equivalent of three decades global warming. With ENSO introducing such large fluctuations into short term temperature trends, it is impossible that trends of less than thirty years should consistently show trends near to the long term trend.
Finally, there is, in fact, a known short term non-forced factor that accounts for nearly all of the discrepancy between predicted and observed short term trends. Given the comment in my last paragraph, it will come as no surprise that it is ENSO:

Very clearly, ENSO has had a strong negative influence on the temperature trend since 2006, and arguably since 1998. That ENSO is the major driver of the recent temperature "hiatus". In fact, three very clear lines of evidence demonstrate that beyone reasonable doubt IMO. They are the fact that if you only examine the trends in ENSO equivalent years, all trends are nearly the same and close to that predicted by the models; that if you adjust temperatures for known ENSO states,the result is a trend close to that predicted by the models, and finally, if you constrain a model to match the historical ENSO pattern, it reproduces the historical temperature record. I discuss these points in detail here.
It should be noted that ENSO is not the only known factor that helps explain the reduces recent trends. Tropical volcanism is known to have increased the aerosol load, a factor that should induce cooling if not for a countervailing warming trend. We are also experiencing unusually weak solar activity, which should also have the same effect. Other factors may also have influence, and scientists are examining these factors, and others to determine the relative importance of different factors. But ENSO is the main factor, without doubt. It is sufficiently strong a factor that, if CO2 forcing did not have a significant warming effect, we should be experiencing a significantly negative short term trend in global temperatures, not the weakly positive trend we are currently experiencing.
- Andrew Dessler on Why It's Stupid not to Act on Climate Change
Tom Curtis at 08:08 AM on 21 August, 2013Mark Bahner @23,
First, this point is an obvious attempt at distraction from the fundamental disanalogy within your example - ie, the estimated probability of the event within the next 100 years.
The difference between the devastation of an asteroid impact, and that of global warming is that the former is localized while the later is global. Thus, quoting the peak energy release is not a relevant comparison.
Consider a 1.6 km iron asteroid hitting Earth at 30km/s and an angle of 45 degrees.
It will release 1.84 million megatonnes energy. Never the less, at 1000 km, the most severe immediate effect will be to shatter glass. Its ejecta is likely to also cause a short lived episode of very cold years. Of course, within 600 km radius, devastation is almost complete.
In addition to providing almost total devastation to 0.2% of the Earth's surface, the devastation of a 1.6 km impactor would be very limited in time, with direct effects being over within days and indirect effects excluding damage.
An ocean impact is in many ways worse, with the tsunami at 1000 km being 11 to 22 meters, and an impact midway between the US and Europe causing a tsunami of about 3 to 6 meters on both shores. It does so, however, with 14 hours notice, so the actual loss of life should be minimal (4 hours at 1000 km). Further, the effect would only ever by felt in one ocean basin (indeed part of any single ocean basin)
It is ambiguous whether you are saying 1 billion would be killed by a 2 km impactor, or a 1 km impactor, but the extreme localization of the events make such estimates very dubious. A 1.6 km impact in Germany, for example, would kill almost everybody in Germany, and a significant population near Germany, but residents of Spain, Britain and Greece would be effectively untouched. The death toll would be 100 to 200 million. In contrast, an impact in the Antarctic would have a death toll only in the 100s. The 1 billion is clearly the upper end of a large probability range.
For comparison, the upper end of the probability range for AGW is currently about 6.25 billion. The lower end of the probability range is around 500,000 (approximately 3 times the estimate of the current annual death toll from global warming). The reason for the high potential death toll from global warming is that, unlike the very localized effects of a 1 km impactor, global warming is ubiquitious.
- East Antarctica Ice-Sheet more vulnerable to melting than we thought: new research
Riduna at 10:20 AM on 3 August, 2013It is certainly possible and may be likely for the polar ice sheets to disappear, causing sea level rise (SLR) of 22 +/- 10 metres over coming millennia. Of more immediate concern is what can be expected to occur over the course of this century. The Letter from C.P. Cook et al (2013) implies that what occurred in the Pliocene is a reasonable indicator to what may happen in the immediate future. That seems questionable, as is the suggestion that some 50% of future SLR could come from ice mass loss from the East Antarctic Ice Sheet.
SLR by 2100 is more likely to come from ice mass loss from West Antarctica (WAIS) where warm ocean currents are already melting ice at glacier mouths and attacking areas of the WAIS resting on the seabed. Atmospheric warming does not appear to contribute to ice mass loss from either the EAIS or WAIS, other than the “Peninsula”.
This is not the case in the Arctic where loss of ice from the Greenland Ice Sheet (GIS) and Canadian Islands is caused by rising atmospheric temperature and a warming Arctic ocean. The latter is caused by penetration of warmer sea currents and loss of albedo causing increased exposure to sunlight. Further, loss of land based ice is more likely to accelerate due to Arctic amplification contributed to by methane emissions and evidenced by temperature rise at over twice the global average.
By contrast atmospheric temperature amplification is not evident in the Antarctic which is insulated by relatively stable circumpolar winds, persistent sea-ice coverage and the loss of tropospheric ozone. All have the effect of maintaining the coldest atmospheric temperatures in the world. Warmer bottom currents from the tropics do reach the EA coast and there is evidence that these enable increased ice loss from some EAIS glaciers. However, the EAIS is entirely land based and, unlike the WAIS which is a marine ice sheet, relatively impervious to warm ocean currents.
Both the WAIS and EAIS are loosing ice mass but the latter is doing so at a much slower rate. For these reasons it is argued that SLR to 2100 is most likely to come from the GIS with exposure to Arctic amplification and WAIS which is vulnerable and exposed to warm ocean currents. EAIS seems unnlikely to be a major contributor this century.
Finally, is it legitimate to compare conditions during the Pliocene, which took hundreds of millennia to evolve, with present conditions which have taken just a few decades to evolve thanks to human intervention. Do present EAIS conditions equate to those which prevailed in the Pliocene?
- An accurately informed public is necessary for climate policy
MichaelK at 11:45 AM on 30 July, 2013After reading all of the above comments I can't help wondering why a 97% consensus paper is causing so much angst in the denial community? If we are to believe the public has moved on, and that publicity of the paper will only harden established positions, I would have thought the denial blogs would simply ignore it.
My own experience of engaging with climate contrarians is that they believe the basic science of global warming is still in dispute. And I don't blame them with headlines in the popular media declaring that CFCs/cosmic rays/solar activitity, in other words, anything other than CO2 is the cause. With so much misinformation in the public sphere, a recent survey of the scientific literature is something which had to be done.
I think what Hulme and Kahan are saying is that such a survey is not an end in itself and they are frustrated when it is used in an attempt to silence debate. Fair enough. Kahan calls for evidence based approaches to come up with carefully nuanced methods of climate change communication, but I was having trouble following exactly what he is advocating. Perhaps this from his blog of last Sunday is an example:
"I just instructed my broker to place an order for $153,252 worth of stocks in firms engaged in arctic shipping. I wonder how many of the people arguing against the validity of the Cook et al. study are shorting those same securities?"
- Empirical evidence that humans are causing global warming
Videre at 18:07 PM on 12 July, 2013Thanks for the help. I guess I was trying to keep my focus on this thread and just looking at the data.
Scaddenp, I am sorry for coming back to this thread, but it was the moderator who directed me to those other threads as having the answers to my questions about this thread, but when I read the other threads, I just had more questions about this thread so I just posted my observations from those other threads into this thread where it was relevant. I am really trying to get a handle on the maint points of this thread and the information given in this thread.
So if I go down the main points in the summing part at the bottom of the thread with my questions I get something like this:
1. More energy is remaining in the atmosphere. See here when he sent me to the geological pages and the energy balance it looks like more energy has come into the atmosphere lots of times, I think one of the threads says it was astronomical changes like orbits and the sun. So it just looks like there are a lot of things that have and can cause more energy to be in the atmosphere. I mean when he directed me to the CO2 lagging thread, its just weird that more energy was getting into the atmosphere at various times in the past even before the CO2 levels rose.
2. The next is the mechanism by which energy can be trapped in the atmosphere. I guess this makes sense as being a mechanism that can do it, but then the lag problem crops up again because if CO2 lags temperature then it just seems something else traps energy too to start the temperature going up. And I guess if the greenhouse effect traps the energy, while it might not go runaway, if it was high in the millions of years past and still the temperature went down and up and down then is there something else going on too that either gets rid of heat and traps it? Its just weird that if the greenhouse effect traps energy that it wouldn’t just keep trapping energy in the past. The other thing about trapping the energy came up when I looked at the fourth point below.
3. The next one is CO2 increasing 50% in the past 150 years. When the moderator told me to look at the history and I had already looked at the data over millions of years, i think it went back to about 60 Ma, which I thought meant 60 million years, there were a lot of ups and downs, not just going up like doubling like Glenn said. Plus if the ocean temperature is going up and CO2 was going up because of the less solubility of CO2 in water I guess that could explain the CO2 rising now too, like it might have millions of years ago. It made it even worse when I looked at the CO2 balance thread the moderator directed me to where I saw those other ins and outs of CO2 were like about 10 or 20 times as big as the fossil fuel burning and land use. I know scaddemp said those much bigger CO2 sources were more or less balanced, but I thought error bars on measurements in climate science must be like 5 or 10 percent or even larger sometimes and that just a few percent of those big numbers would be a lot larger than the fossil fuel burning contribution to CO2.
4. So the last one I wondered about too, and it is about the energy being trapped in the atmosphere is exactly the energy captured by CO2. So I looked at the link to the conference poster of Evans in 2006 and it had the radiation measurements for all the greenhouse gases but it took out water and wasn’t a peer reviewed paper so I looked at the IPCC last out report, I think its called AR4, which came out in 2007, after the Evans poster. On page 141 in Chapter 2 there’s a Table 2.1 that shows the CO2 radiative forcing in 2005 was 1.66 W/m2 and all the other gases, not CO2, add up to about 0.77 W/m2 so CO2 is about 63% of the total of those gasses. But water still wasn’t in there so I looked on page 204 still in Chapter 2 at the Table 2.12, which gives all the radiative forcings. A lot of them are negative, like ozone and aerosols and all, so if I add up all the negative ones (a big one is the cloud albedo effect) I got negative forcings of -2.1 W/m2 and adding up the total of the positive ones, not CO2, I got a positive 1.35 W/m2. The uncertainties are pretty big on the numbers too so these numbers have intervals around them like a factor of two. So what confused me is that it looks like the CO2 forcing is kind of small compared to the other effects. Just the negative ones look like they can cancel out the CO2 effect. It just seemed weird that so many other effects are going on but somehow it’s for sure that CO2 is the dominant thing.
So anyway, I just wanted to look at the post and the information in it and try to understand the main points, which I thought were all about the empirical evidence that humans are causing global warming by increasing CO2, but wound up having a lot of questions. Sorry if I crossed the threads but I thought they all related to this one, plus I think the moderator pointed some of them out to me as helping understand this thread.
- Another Piece of the Global Warming Puzzle - More Efficient Ocean Heat Uptake
Paul Pukite at 04:30 AM on 23 June, 2013I added an extra section on Watanabe's results to a blog post I had written on a proportional land/sea warming model.
http://theoilconundrum.blogspot.com/2013/05/proportional-landsea-global-warming.html
The gist is that I think it may be possible to infer this ocean heat uptake by comparing the land and ocean temperatures in a systematic fashion. There is a fractional value, f, that elates the land to sea surface temperature and which corresponds to the ocean heat uptake, i.e. lower values means that more heat is being sunk by the ocean.

I think Watanabe et all are correct in inferring that the ocean heat uptake is causing the plateauing of the global temperature. It is also clear that this cannot continue for the long term.
- Skeptical Science Study Finds 97% Consensus on Human-Caused Global Warming in the Peer-Reviewed Literature
s_gordon_b at 06:42 AM on 28 May, 2013Hi JasonB,
You wrote in reply to my post:
Perhaps it would be easier to understand your point if you could point us to some examples of where the study is being spun?
Ironically, in light of the methodology of the paper, the spin (more neutrally, I should call it confusion or conflation) starts with my "rating" of where Cook et al.'s abstract stands on AGW (emphasis below is mine):
"We analyze the evolution of the scientific consensus on anthropogenic global warming (AGW) in the peer-reviewed scientific literature, examining 11 944 climate abstracts from 1991–2011 matching the topics 'global climate change' or 'global warming'. We find that 66.4% of abstracts expressed no position on AGW, 32.6% endorsed AGW..."AGW is immediately defined as "the scientific consensus on anthropogenic global warming," not in the broadbrushed, imprecise, popular way that ranges from "we're a significant contributor, along with natural causes" to "we're the cause." In the next breath, we're told that "32.6% endorsed" that consensus. Ask anyone who reads climate science papers what the term "scientific consensus on anthropogenic global warming" means in the context of such a paper, and how many will say "simple: humans are a significant cause of global warming" vs "it refers to the consensus of the IPCC and pretty much all of the other major scientific review bodies that humans are the dominant (if not the only) cause of global warming, at least since the 1950s"? In climate science circles "consensus" has a precise meaning. And this is a climate science paper. This is why when I initially read about the paper - and based on my very high level of trust in SkS - I took the claim about support for "the consensus" literally, in the IPCC sense, and represented the paper that way on social media. It's also why I was stunned when I actually read the paper and got to the part where categories 1, 2 and 3 were rolled up together and rated as "the consensus." Not so. Two and 3, by definition, lacked the scope to indicate one way or another whether they support the consensus. Basically, just as most of all of the abstracts that were rated lacked the scope to comment at all on causation; 2 and 3 lacked the scope to comment on the consensus quantification of causation.
You continued:
Regarding the authors, again, they were asked to state whether each specific paper endorsed the proposition that anthropogenic GHGs are causing global warming, rejected the proposition that anthropogenic GHGs are causing global warming, or was neutral. If the author of the paper felt that their paper implied humans were having a minimal impact on global warming (e.g. by proposing an alternative as the main cause of global warming), or stated that human impact was minimal or non-existent, or stated that humans were causing less then half of global warming, then they would have categorised their own papers as rejecting the proposition.
I'm fairly confident that anyone who rejected the consensus view would have made damn sure their paper was counted as a rejection if it was at all possible to do so! And let's not forget that the authors of any papers who feel their paper should have been counted as a rejection are free to search for their paper in the results and alert us to the miscategorisation.
You're misunderstanding my argument. I'm not in any way suggesting that minimizing or denying papers were lumped into the "endorsing"/consensus-supporting abstract count. For example, if I wrote a paper that (to quote from the choices the authors were given) "... explicitly states humans are causing global warming or refers to anthropogenic global warming/climate change as a given fact," I would concur if it was rated as category 2. Likewise, I would concur with a category 3 rating if my "paper implies humans are causing global warming. E.g., research assumes greenhouse gases cause warming without explicitly stating humans are the cause." But I would concur in both these cases even if my paper had zero to say for or against the IPCC consensus on degree of causation. Indeed, if my paper had supported the consensus, I would have rated it 1.
Anyway, the bottom line is that the authors of 97.2% of the papers that took a position stated that their papers endorsed the proposition that anthropogenic greenhouse gasses are causing global warming. That's it.
Exactly. They "endorsed the proposition that anthropogenic greenhouse gasses are causing global warming." "Are causing" can be read the same way as "obesity is causing Type 2 diabetes": it's a contribuitng cause. But, again, only a fraction of the papers were designed to endorse or reject the dominant cause IPCC consensus implied in the abstract and in all manner of coverage that has followed. E.g.:
From the lead in Suzanne Goldberg's story in The Guardian (http://www.guardian.co.uk/environment/2013/may/16/climate-research-nearly-unanimous-humans-causes):"A survey of thousands of peer-reviewed papers in scientific journals has found 97.1% agreed that climate change is caused by human activity."
When I write (as a journalist) or read "is caused by" in the context of the climate change social debate (it is a debate, in civil society; otherwise there would be no need for this paper and the Consensus Project), my meaning/understanding is primary causation, if not "the cause."
There's no shortage of argument on this board about the semantics used in the study and surrounding it. Cook et al. could simply address this by releasing a clarification, unless they really believe it's scentifically sound to infer that category 2 and 3 papers do endorse the consensus. Alternately, they could go through all their past writings and redefine their use of the word consensus to mean that human activities are at least a significant contributor to global warming.
Quoting and answering me:
*I've looked everywhere, but I can't find where the numbers of abstracts assigned to each of the original Table 2 categories is or the category assignments by the study authors. Could you point me to that data?
http://www.skepticalscience.com/tcp.php?t=search
I had already gone there. I still don't see how I can use that page to get those figures. Why isn't the data simply published somewhere? It's such basic information for people who want to understand the study's findings.
Perhaps you should spend some time reading the earlier comments to avoid rehashing the same points over and over again.
I read plenty and found little beyond arguments about semantics. But now you've provided me numbers for category 1 in your earlier post, where you write:
... of interest to this discussion is the breakdown between papers that quantify the human contribution to global warming as >= 50% and papers that quantify the human contribution to global warming as < 50% (i.e. levels 1 and 7), since there is no interpretation required for those. The former represent 88% of all papers that quantify the human contribution to global warming (64 of 73).
I think you've made a fundamental error here. For a paper to unambiguously support the IPCC et al. consensus, it does indeed have to fall into category 1. But for a paper to unambiguously reject or deny it, it only has to fall into category 5, 6 or 7. That's 0.7 of 11,944 papers = 84 (maybe a few more, judging by the responses to some to the queries Popular Technology sent to known anti-AGW scientists whose papers had been rated). So the proper comparison, it seems to me, is 64 vs 84 or 64 out of 148 explicitly, unambiguously endorsing vs rejecting the IPCC consensus.
For me, the lesson of this study is that it's very hard to find robust support for the IPCC consensus just by doing a head count of papers on climate change, because very few papers, so far at least, have explicitly (or implictly, I suppose) sought to test that quantified consensus. Maybe this is analogous to the relationship between any large body of literature and the relatively uncommon major reviews and meta-analyses that attempt to put it all together and draw those larger conclusions of which consensuses are made.
- Skeptical Science Study Finds 97% Consensus on Human-Caused Global Warming in the Peer-Reviewed Literature
engineer8516 at 14:06 PM on 21 May, 2013@ Jason B.
Climate change is a sensitive topic and proponents of AGW do mostly support drastic cuts in emissions. I don't know why you took offense to that statement.
Anyway, 7,930 papers (66%) had No AGW position. 1,339 of these were then self rated and of the 1,339 36% were self-rated as no position on AGW. Since you worked on the paper...How many of the No AGW Position papers and self rated No AGW Position were on the topic of climate change?
You're wondering why I consider the overall percentage number to be relevant. It is interesting that 66% of the overall 12,000 and 35% of the 2,142 respondents had no stated AGW position in their paper. Why? If those papers are on the topic of climate change (I don't know if they are that's why I asked the above question) and the authors support AGW, then I would expect them to mention human CO2 emissions because a) humans are driving climate change through emissions and b) we're running out of time and scientists have to convince governments that humans are behind climate change so we don't kill ourselves.
and reason number 2 doesn't cut it for me. " 2) frankly, every scientist doing climate research knows humans are causing global warming. There's no longer a need to state something so obvious. For example, would you expect every geological paper to note in its abstract that the Earth is a spherical body that orbits the sun?" The paper itself and the UIC survey cited above refute this. I doubt you can find a geologist that doesn't believe that the Earth is a spherical body orbiting the sun. just my 2 cents.
- Skeptical Science Study Finds 97% Consensus on Human-Caused Global Warming in the Peer-Reviewed Literature
barry1487 at 13:58 PM on 21 May, 2013KR and Jason,
"Two comments, with the understanding that the "concensus on AGW" means AGW as the dominant force behind global warming:"
"If the abstract says anything that can be interpreted as "human activity is <50% responsible for global warming" it would have automatically shunted it into category 5, 6, or 7"
It seems I have been labouring under a misapprehension, then. But I wonder if I am alone in that. The email sent to original authors makes no mention of the consensus being about degree of warming. The Endorsement statement in the email only mention humans contributing, not being a primary source.
Endorsement: The second drop down indicates the level of endorsement for the proposition that human activity (i.e., anthropogenic greenhouse gases) is causing global warming (e.g., the increase in temperature). Note: we are not asking about your personal opinion but whether each specific paper endorses or rejects (whether explicitly or implicitly) that humans cause global warming:
Then they get the 7 rating options, 2 of which are quantified, and the other 5 are qualified. The Author reading the email it must infer that all 7 ratings are under the rubric of >/<50% human influence, rather than (as I did) view the remaining 5 ratings as qualitative, rather than quantitative options. Scientists must make an assumption about that because it is not expressly stated, and in the manner that it is stated in the email, it does not mention degree of human influence at all.
Neither is it in the abstract of the paper. In fact, apart from options 1) and 7), only one sentence of the paper does mention degree of human influence, in the last sentence of the introduction. I find this confusing. The abstract mentions of the consensus position infers a simple accept/reject AGW. Eg,
"Among abstracts expressing a position on AGW, 97.1% endorsed the consensus position that humans are causing global warming."
Throughout the paper, apart from the one sentence in the intro, the values are tied to the phrase "the consensus" or similar.
Read straight, this could easily include a human contribution of less than 50%, and options 2, 3, 5 and 6, are qualitative options, and nothing to do with >/<50% hmuan contribution. IE, If an abstract seems to minimize the importance of the human contribution and gives no qantification, then it is rated 5 or 6, and if it emphasises the importance of the human contribution, but does not quantify, then it should be rated 2 or 3. (It's a shame a breakdown of ratings results is not included in the study/supplementary)
My concern now is, that with different interpretations of the consensus statement (and different scientific societies and position statements also word the consensus differently, some only going as far as saying that human activity is contributing to global warming), the original Authors may have rated as I did, applying to all but options 1 and 7 a qualitative interpretation of abstracts.
Possibly I am just ignorant or not too bright. They said so at Lucia's, where I have been arguing, against them there, that the 97% result has come from a simple accept/reject AGW. I really do find it incredible that 97% of abstracts endorse >50% human influence, implicatively or otherwise.
BTW, are any of the authors commenting here? It would be great if they did and identified themselves (unless they prefer anonymity), so that they could clear up misunderstandings.
Hey, John Cook, come straighten us out.
- Skeptical Science Study Finds 97% Consensus on Human-Caused Global Warming in the Peer-Reviewed Literature
engineer8516 at 09:57 AM on 21 May, 2013First, I would like to commend you guys for putting the time and effort to do this. However, I think the 97% consesus is misleading.
The article states, "We found that about two-thirds of papers didn't express a position on the subject in the abstract, which confirms that we were conservative in our initial abstract ratings."
Thus, the 97% consensus is only for the papers that expressed a position on the topic of AGW. Therefore, out of the total sample size of 12,000, the number of papers that expressed support of AGW in their abstract was actually 32% . And 1% expressed disagreement or uncertainty with AGW. Thus, 67% of the abstracts didn't have a position.
The article further states,
"This result isn't surprising for two reasons: 1) most journals have strict word limits for their abstracts, and 2) frankly, every scientist doing climate research knows humans are causing global warming. There's no longer a need to state something so obvious. For example, would you expect every geological paper to note in its abstract that the Earth is a spherical body that orbits the sun?"
While the first one is true, it still doesn't tell us the author's position. The actual authors may or may not support AGW or maybe unsure. The second one looks like a personal opinion.
It seems illogical to just ignore the 67% of papers that didn't express an opinion in their abstracts. Especially since the keyword searches used to find the papers, "global warming" and "global climate change," are sensitive topics with proponents pushing for drastic emission reductions.
Also that UIC paper that is cited asked 2 questions in its online survey.
"1. When compared with pre-1800s levels, do you think that mean global temperatures have generally risen, fallen, or remained relatively constant?
2. Do you think human activity is a significant contributing factor in changing mean global temperatures?"
76 out of 79 climate scientists answered risen to question 1. The 97% consensus comes from the 75 out of 77 climate scientists that responded yes to question 2. But question 2 is subjective because it doesn't state what % is considered siginificant. Significant could be 10%, 20%, 50%, etc of observed warming. just my 2 cents.
- The educational opportunities in addressing misinformation in the classroom
Cal Engime at 02:06 AM on 10 March, 2013Water vapour has not been ignored. Scientists know that it is our planet's most abundant greenhouse gas, and that it plays an important role in global warming. In fact, the atmospheric water content over the oceans has been measured to be increasing by 0.41 kg per square meter every ten years since 1998.
But water vapour doesn't just go up and stay up—excess water in the atmosphere falls to Earth as rain or snow within a week. The amount of water the atmosphere can hold is almost purely a function of temperature. So what caused the warming that's causing increased evaporation?
CO2, the gas responsible for 25% of the greenhouse effect. CO2 emissions have soared in recent history, and unlike water vapour, it stays in the atmosphere for 50 to 200 years. We've only been directly observing CO2 levels in the atmosphere and global temperatures for a short period of time, but geological evidence extends these records hundreds of thousands of years into the past, and what we see are that the two main controls on Earth's thermostat are 1) the output of the Sun, and 2) CO2 levels in the atmosphere. Water vapour is the largest amplifier of the effect of CO2, but there's a large body of research establishing CO2 as the main cause.
- Dueling Scientists in The Oregonian, Settled by Nuccitelli et al. (2012)
KR at 08:18 AM on 6 February, 2013Richard C (NZ) - Stockwell and "solar accumulation theory" are off-topic on this thread, as it is discussing the interpretation of ocean heat content, not claims against climate based on thermodynamics.
I would recommend taking any such discussion to Solar activity & climate: is the sun causing global warming, and in particular to Tom Curtis's dissection of Stockwells errors.
- Water vapor is the most powerful greenhouse gas
Tom Curtis at 11:31 AM on 19 January, 2013
AlanSE @137:
1) Greenhouse effect: The explanation of the greenhouse effect at sierrapotomac.org is of poor quality, and will only confuse you if you are trying to understand it correctly. In particular, it describes the greenhouse effect as causing a greater absorption of heat. In fact, an increase in atmospheric CO2 would result in a greater increase in heat only while the Earth was not a radiative equilibrium. Once the Earth reached radiative equilibrium, there would be no further net gain in heat, but the greenhouse effect would still be enhanced relative to the condition with less CO2.
It also says,"The heating of the earth due to the radiant heat of the sun is called the greenhouse effect", which is egregiously wrong. The radiant energy received from the Sun at the Earth's current albedo is 239 W/m^2. In the absence of a Greenhouse effect, the temperature of the Earth's surface would rise till it emitted 239 W/m^2, ie, approximately 255 degrees Kelvin (-18 C). A low IR emissivity would raise the temperature slightly; while a less than even temperature distribution across the surface would lower it. In practice, the second is the stronger effect so that the mean global surface temperature would be less than 255 K.
As it happens, the Earth's global mean surface temperature is approximately 288 K (15 C). The higher temperature results in a much higher outward IR flux at the surface than the energy received from the Sun, and indeed, much higher than the outward flux at the top of the atmosphere. The difference between the outward flux at the surface and that at the top of the atmosphere is the atmospheric greenhouse effect. Trenberth et al (2010) give that difference as 156 W/m^2 (see diagram below), while Schmidt et al (2010) gives it as 155 W/m^2.

It is very important that the IR radiation at the TOA is less than that at the surface only because greenhouse gases absorb outgoing IR radiation; and because those gases are cooler than the surface, so that when they emit IR radiation it has a reduced flux. It is also important to recognize that the TOA flux can only be smaller because energy absorbed by the atmosphere is also transferred to the surface. Without the energy transfer to the surface both the reduced flux at TOA, and the flux at the surface greater than solar radiation absorbed would violate conservation of energy. As it happens, the energy equations do balance (see diagram above). The energy transfer from atmosphere to surface is in the form of back radiation, but could be in another form and you would still have a greenhouse effect.
2) Atmospheric Window: You appear to be confused by the "atmospheric window". "Atmospheric windows" are frequencies within the electromagnetic spectrum in which there is almost no atmospheric absorption, so that radiation in the window can go directly from the surface to space (or vise versa). As can be seen in the modtran image below, there is an IR atmospheric window between wavenumbers 800 cm^-1 and 1000 cm^-1, and another smaller window around 1100 cm^-1. As it happens, about 40 W/m^2 escapes from the surface to space through these "atmospheric windows", but they should not be confused with the total radiation to space (236 W/m^2, most of which comes from the atmosphere) or with the atmospheric greenhouse effect.
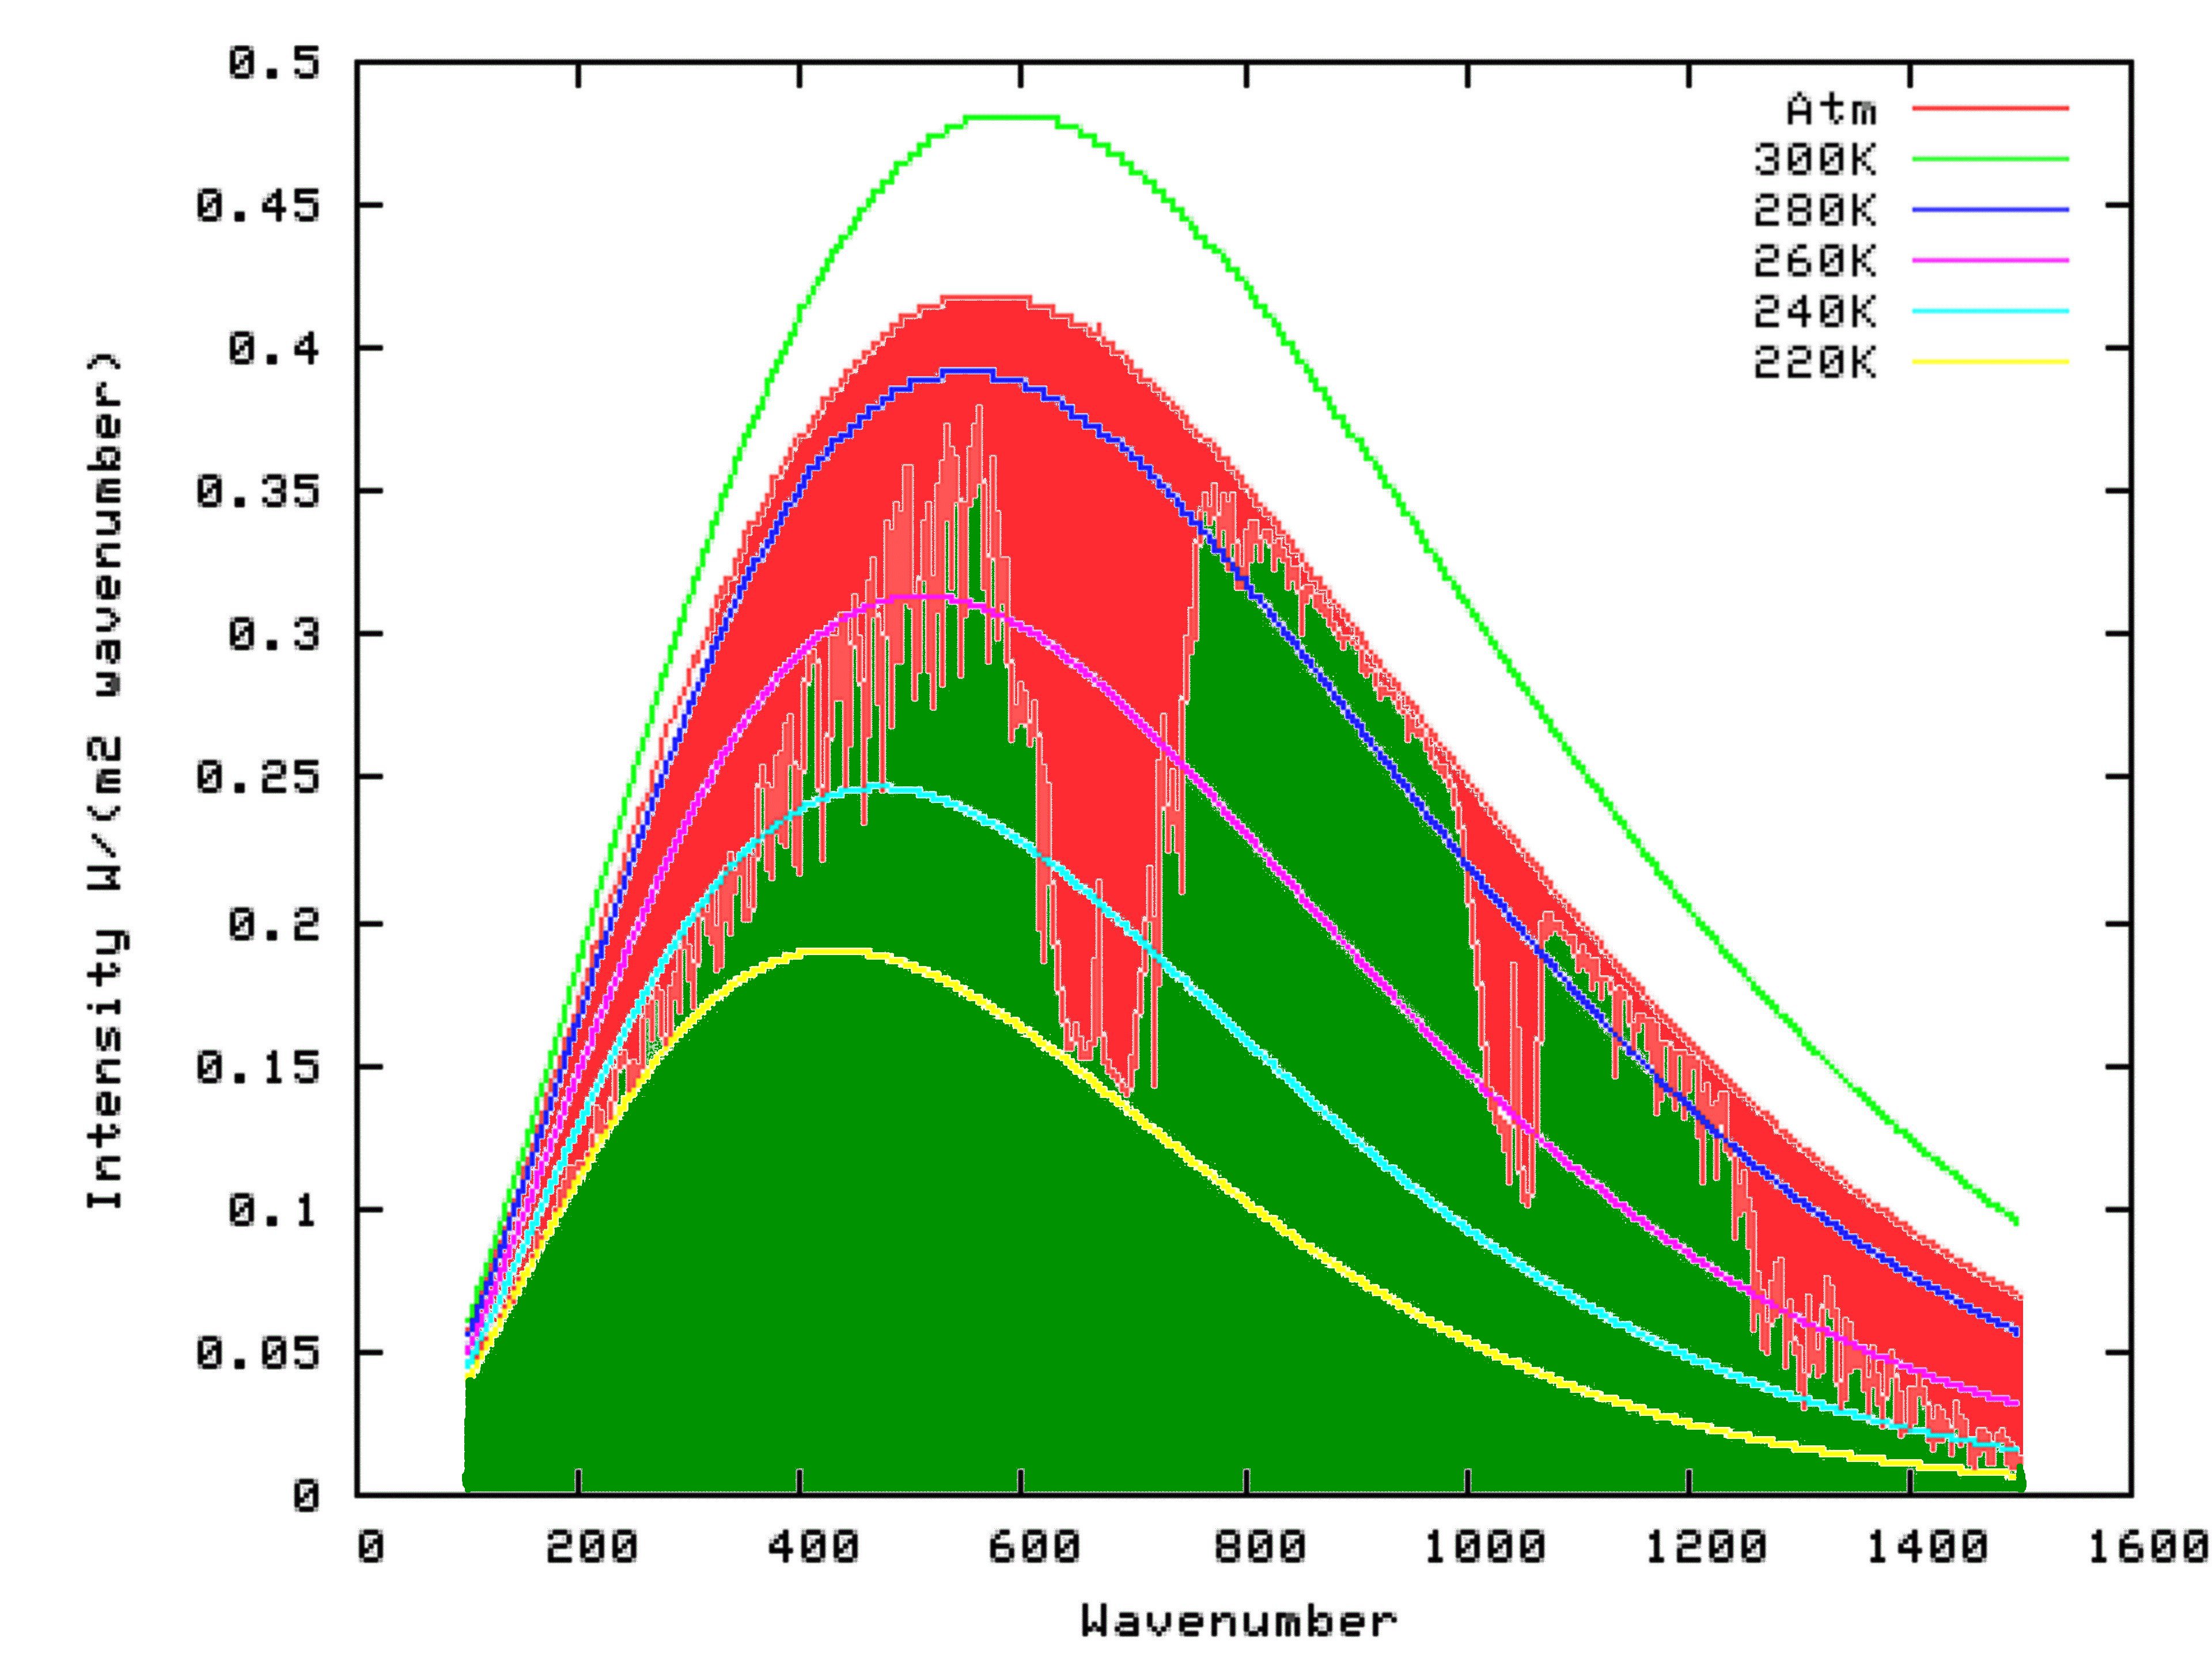
As noted in section one, the atmospheric greenhouse effect is the difference between the upward IR radiation from the surface and the upward IR radiation to space from the Top of the Atmosphere. Doubling CO2 concentration creates a radiative forcing of 3.7 W/m^2, ie, it reduces the IR radiation to space by 3.7 W/m^2. The reduced upward flux at the TOA creates an energy imbalance which warms the Earth until the imbalance ceases to exist. Ignoring all feed backs, that requires a warming of approx 1.1 C at the surface to accomplish; or in other words an increase in the upwards IR flux at the surface by about 6 W/m^2. Because equilibrium is reached (ignoring feedbacks), the upward IR flux at the TOA will have returned to 239 W/m^2, so a radiative forcing of 3.7 W/m^2 will have caused a total change in the net atmospheric greenhouse effect of 6 W/m^2. In practice, the net change will be approximately two to three times that amount, with much of the increase attributable to the water vapour feed back.
This may seem confusing, but only if you mistake radiative forcing, ie, the net change in TOA radiative flux before temperature adjustments with the net atmospheric greenhouse effect, ie, the difference between surface and TOA upward IR flux. Unfortunately, that is a mistake I made in my previous post @134. I apologize for any confusion I have caused as a result.
3) Increased CO2: Increasing CO2 in the atmosphere widens the large valley in outgoing radiation between 600 and 700 cm^-1 (see modtran graph above). To maintain equilibrium, the total area of the graph, which represents the total upward flux, must remain constant. Because the area is reduced near 600 and 700 cm^-1, it must be increased elsewhere, including in the atmospheric windows. As the upward flux in the atmospheric windows comes from the surface, this means the surface temperature must increase. Consequently your assumption that most of the warming would occur in the atmosphere (ignoring feed backs) is mistaken. - Misleading Daily Mail Article Pre-Bunked by Nuccitelli et al. (2012)
Dikran Marsupial at 20:42 PM on 14 December, 2012
Jack, tests of statistical significance are a useful sanity check in science; the basic idea is that you should not make a claim based on a particular set of observations unless the evidence is statistically significant. I'm sure we would all agree on that.
However The claim that global warming is occurring is not based solely on the observed trend in global mean surface temperature, there are many other lines of evidence, such as ocean heat content and others, and a good deal of basic physics. If the only evidence we had of global warming or the greenhouse effect were the GMST trend over the last fifteen years, you would have a point. But it isn't, so your conclusion is based on a misunderstanding of the science.
A lack of a statistically significant trend does not necessarily mean it isn't warming. I'd be happy to discuss this with your further. - It's El Niño
Bob Tisdale at 19:48 PM on 7 December, 2012doug_bostrom says at 142: “Bob, where's the heat pump? How does it function?”
I don’t know how you’re defining heat pump, doug.
But I’ll cut and paste my earlier reply to skywatcher, as an explanation of ENSO to see if it agrees with how you’re defining heat pump. I wrote:
The process through which the sun creates the warm water for El Niño events was described in my comment 139, where I replied to composer99:
El Niño and La Niña events are part of a coupled ocean-atmosphere process. Sea surface temperatures, trade winds, cloud cover, downward shortwave radiation (aka visible sunlight), ocean heat content, and subsurface ocean processes (upwelling, subsurface currents, thermocline depth, downwelling and upwelling Kelvin waves, etc.) all interact. They’re dependent on one another. During a La Nina, trade winds are stronger than normal. The stronger trade winds reduce cloud cover, which, in turn, allows more downward shortwave radiation to enter and warm the tropical Pacific.
If you’re having trouble with my explanation because it’s so simple, refer to Pavlakis et al (2008) paper “ENSO Surface Shortwave Radiation Forcing over the Tropical Pacific.” Note the inverse relationship between downward shortwave radiation and the sea surface temperature anomalies of the NINO3.4 region in their Figure 6. During El Niño events, warm water from the surface and below the surface of the West Pacific Warm Pool slosh east, so the sea surface temperatures of the NINO3.4 region warm, causing more evaporation and more clouds, which reduce downward shortwave radiation. During La Niña events, stronger trade winds cause more upwelling of cool water from below the surface of the eastern equatorial Pacific, so sea surface temperature to drop in the NINO3.4 region, in turn causing less evaporation. The stronger trade winds also push cloud cover farther to the west than normal. As a result of the reduced cloud cover, more downward shortwave radiation is allowed to enter and warm the tropical Pacific during La Niña events.
To complement that, here’s a graph to show the interrelationship between the sea surface temperature anomalies of the NINO3.4 region and cloud cover for the regions presented by Pavlakis et al.
That discussion explains why the long-term warming of the Ocean Heat Content for the tropical Pacific was caused by the 3-year La Nina events and the unusual 1995/96 La Niña. First, here’s a graph of tropical Pacific Ocean Heat Content. It’s color coded to isolate the data between and after the 3-year La Niña events of 1954-57, 1973-76 and 1998-2001. Those La Niña events are shown in red. Note how the ocean heat content there cools between the 3-year La Niña events. Anyone who understands ENSO would easily comprehend how and why that happens. It’s tough to claim that greenhouse gases have caused the warming of the tropical Pacific when the tropical Pacific cools for multidecadal periods between the 3-year La Niñas, Composer99.
As you can see, the warming that took place during the 1995/96 La Niña was freakish. Refer to McPhaden 1999 “Genesis and Evolution of the 1997-98 El Niño”.
McPhaden writes:
For at least a year before the onset of the 1997–98 El Niño, there was a buildup of heat content in the western equatorial Pacific due to stronger than normal trade winds associated with a weak La Niña in 1995–96.
Based on the earlier description, that “build up of heat content” resulted from the interdependence of trade winds, cloud cover, downward shortwave radiation and ocean heat content. Simple. As you can see in the above graph, the upward spike caused by the 1995/96 La Niña skews the trend of the mid-cooling period, and if we eliminate the data associated with it and the 1997/98 El Niño, then the trend line for the mid-period falls into line with the others.
HHH
skywatcher, so La Niña events provide the naturally created fuel for El Niño events. More ENSO basics: An El Niño releases that heat, which is stored as warm water, from below the surface of the West Pacific Warm Pool. The warm water travels east and spreads across the surface of the eastern tropical Pacific. The El Niño releases heat through evaporation into the atmosphere, which is why tropical Pacific ocean heat content drops during an El Niño. Additionally, the convection, cloud cover and precipitation accompany that warm water east, sometimes almost halfway around the globe. These changes in location of the primary source of tropical Pacific convection and the resulting changes in atmospheric circulation, not a direct transfer of heat, are what cause surface temperatures to warm in areas remote to the eastern tropical Pacific.
Further to this, as I replied to doug_bostrom in my comment 103:
On the other hand, are you aware of teleconnections? Are you aware that there’s no heat transfer with teleconnections? Example: Why do the tropical North Atlantic sea surface temperature anomalies warm during an El Nino, doug? Do you know? There’s no direct exchange of heat yet the tropical North Atlantic warms during an El Niño. Why, doug? Could it have something to do with the slowing of the trade winds in the tropical North Atlantic in response to the El Niño? That would result in less evaporation, which is the primary way the oceans release heat. If there’s less evaporation, sea surface temperatures warm, do they not? Also, when the trade winds slow in the tropical North Atlantic in response to an El Niño, there’s less upwelling of cool waters from below the surface and less entrainment of that cool subsurface water. That would cause the seas surface temperatures to warm too.
HHH
If you don’t like my explanation, skywatcher, refer to Wang (2005) ENSO, Atlantic Climate Variability, And The Walker And Hadley Circulation for a more detailed discussion. And if you’d like a discussion of teleconnections for the rest of the world, refer to Trenberth et al (2002) Evolution of El Niño–Southern Oscillation and global atmospheric surface temperatures.
A quick note about Trenberth et al (2002). They qualify the results of their global warming attribution with:
Although it is possible to use regression to eliminate the linear portion of the global mean temperature signal associated with ENSO, the processes that contribute regionally to the global mean differ considerably, and the linear approach likely leaves an ENSO residual.
The divergences between the Rest of the World data and the scaled NINO3.4 data during the 1988/89 and 1998-01 La Niña events are those ENSO residuals.
HHH
Would you consider ENSO to be a heat pump, doug?
- It's El Niño
Bob Tisdale at 19:34 PM on 7 December, 2012skywatcher at 138 says: “1: Where's the heat coming from? The oceans, globally, are warming, the atmosphere is warming, and yet the Sun is not getting any brighter. What's your energy source?”
The sun is the primary energy source, but sea surface and ocean heat content warming can and do also take place without the exchange of heat, which is the result of teleconnections. The process through which the sun creates the warm water for El Niño events was described in my comment 139, where I replied to composer99:
El Niño and La Niña events are part of a coupled ocean-atmosphere process. Sea surface temperatures, trade winds, cloud cover, downward shortwave radiation (aka visible sunlight), ocean heat content, and subsurface ocean processes (upwelling, subsurface currents, thermocline depth, downwelling and upwelling Kelvin waves, etc.) all interact. They’re dependent on one another. During a La Nina, trade winds are stronger than normal. The stronger trade winds reduce cloud cover, which, in turn, allows more downward shortwave radiation to enter and warm the tropical Pacific.
If you’re having trouble with my explanation because it’s so simple, refer to Pavlakis et al (2008) paper “ENSO Surface Shortwave Radiation Forcing over the Tropical Pacific.” Note the inverse relationship between downward shortwave radiation and the sea surface temperature anomalies of the NINO3.4 region in their Figure 6. During El Niño events, warm water from the surface and below the surface of the West Pacific Warm Pool slosh east, so the sea surface temperatures of the NINO3.4 region warm, causing more evaporation and more clouds, which reduce downward shortwave radiation. During La Niña events, stronger trade winds cause more upwelling of cool water from below the surface of the eastern equatorial Pacific, so sea surface temperature to drop in the NINO3.4 region, in turn causing less evaporation. The stronger trade winds also push cloud cover farther to the west than normal. As a result of the reduced cloud cover, more downward shortwave radiation is allowed to enter and warm the tropical Pacific during La Niña events.
To complement that, here’s a graph to show the interrelationship between the sea surface temperature anomalies of the NINO3.4 region and cloud cover for the regions presented by Pavlakis et al.
That discussion explains why the long-term warming of the Ocean Heat Content for the tropical Pacific was caused by the 3-year La Nina events and the unusual 1995/96 La Niña. First, here’s a graph of tropical Pacific Ocean Heat Content. It’s color coded to isolate the data between and after the 3-year La Niña events of 1954-57, 1973-76 and 1998-2001. Those La Niña events are shown in red. Note how the ocean heat content there cools between the 3-year La Niña events. Anyone who understands ENSO would easily comprehend how and why that happens. It’s tough to claim that greenhouse gases have caused the warming of the tropical Pacific when the tropical Pacific cools for multidecadal periods between the 3-year La Niñas, Composer99.
As you can see, the warming that took place during the 1995/96 La Niña was freakish. Refer to McPhaden 1999 “Genesis and Evolution of the 1997-98 El Niño”.
McPhaden writes:
For at least a year before the onset of the 1997–98 El Niño, there was a buildup of heat content in the western equatorial Pacific due to stronger than normal trade winds associated with a weak La Niña in 1995–96.
Based on the earlier description, that “build up of heat content” resulted from the interdependence of trade winds, cloud cover, downward shortwave radiation and ocean heat content. Simple. As you can see in the above graph, the upward spike caused by the 1995/96 La Niña skews the trend of the mid-cooling period, and if we eliminate the data associated with it and the 1997/98 El Niño, then the trend line for the mid-period falls into line with the others.
HHH
skywatcher, so La Niña events provide the naturally created fuel for El Niño events. More ENSO basics: An El Niño releases that heat, which is stored as warm water, from below the surface of the West Pacific Warm Pool. The warm water travels east and spreads across the surface of the eastern tropical Pacific. The El Niño releases heat through evaporation into the atmosphere, which is why tropical Pacific ocean heat content drops during an El Niño. Additionally, the convection, cloud cover and precipitation accompany that warm water east, sometimes almost halfway around the globe. These changes in location of the primary source of tropical Pacific convection and the resulting changes in atmospheric circulation, not a direct transfer of heat, are what cause surface temperatures to warm in areas remote to the eastern tropical Pacific.
Further to this, as I replied to doug_bostrom in my comment 103:
On the other hand, are you aware of teleconnections? Are you aware that there’s no heat transfer with teleconnections? Example: Why do the tropical North Atlantic sea surface temperature anomalies warm during an El Nino, doug? Do you know? There’s no direct exchange of heat yet the tropical North Atlantic warms during an El Niño. Why, doug? Could it have something to do with the slowing of the trade winds in the tropical North Atlantic in response to the El Niño? That would result in less evaporation, which is the primary way the oceans release heat. If there’s less evaporation, sea surface temperatures warm, do they not? Also, when the trade winds slow in the tropical North Atlantic in response to an El Niño, there’s less upwelling of cool waters from below the surface and less entrainment of that cool subsurface water. That would cause the seas surface temperatures to warm too.
HHH
If you don’t like my explanation, skywatcher, refer to Wang (2005) ENSO, Atlantic Climate Variability, And The Walker And Hadley Circulation for a more detailed discussion. And if you’d like a discussion of teleconnections for the rest of the world, refer to Trenberth et al (2002) Evolution of El Niño–Southern Oscillation and global atmospheric surface temperatures.
A quick note about Trenberth et al (2002). They qualify the results of their global warming attribution with:
Although it is possible to use regression to eliminate the linear portion of the global mean temperature signal associated with ENSO, the processes that contribute regionally to the global mean differ considerably, and the linear approach likely leaves an ENSO residual.
The divergences between the Rest of the World data and the scaled NINO3.4 data during the 1988/89 and 1998-01 La Niña events are those ENSO residuals.
- It's El Niño
Bob Tisdale at 00:49 AM on 3 December, 2012At comment 107, Composer99 quoted one of my earlier comments: “Are you aware that the global oceans can be divided into logical subsets which show the ocean heat content warmed naturally?”
Composer99 replied, “No, they can't. Ocean heat has to come from somewhere.”
Apparently you have never divided OHC data into subsets, because if you had, you would not make such a statement. Dividing the oceans into subsets shows the ocean heat comes from somewhere, but it’s not CO2.
For the sake of discussion, I’m going to borrow some graphs from an upcoming post. Here’s a comparison graph of Global ocean heat content and the ocean heat content for the Pacific Ocean north of 24S, which captures the tropical Pacific and the extratropics of the North Pacific (24S-65N, 120E-80W). The Pacific OHC (North of 24S) shows similar but somewhat noisier warming. That is, the decadal variations are similar. The warm trend of the Pacific subset is about 72% of the global trend, but that’s to be expected since the excessive warming of the North Atlantic OHC skews the global data. All in all, both datasets give the impression of a long-term warming that’s somewhat continuous. People might assume the warmings of both datasets were caused by CO2.
We’re going to separate the tropical Pacific (24S-24N) from the extratropical North Pacific (25N-65N), looking at the tropical Pacific first, but that requires a brief overview of how La Niña events produce the warm water that fuel El Niño events.
El Niño and La Niña events are part of a coupled ocean-atmosphere process. Sea surface temperatures, trade winds, cloud cover, downward shortwave radiation (aka visible sunlight), ocean heat content, and subsurface ocean processes (upwelling, subsurface currents, thermocline depth, downwelling and upwelling Kelvin waves, etc.) all interact. They’re dependent on one another. During a La Nina, trade winds are stronger than normal. The stronger trade winds reduce cloud cover, which, in turn, allows more downward shortwave radiation to enter and warm the tropical Pacific.
If you’re having trouble with my explanation because it’s so simple, refer to Pavlakis et al (2008) paper “ENSO Surface Shortwave Radiation Forcing over the Tropical Pacific.” Note the inverse relationship between downward shortwave radiation and the sea surface temperature anomalies of the NINO3.4 region in their Figure 6. During El Niño events, warm water from the surface and below the surface of the West Pacific Warm Pool slosh east, so the sea surface temperatures of the NINO3.4 region warm, causing more evaporation and more clouds, which reduce downward shortwave radiation. During La Niña events, stronger trade winds cause more upwelling of cool water from below the surface of the eastern equatorial Pacific, so sea surface temperature to drop in the NINO3.4 region, in turn causing less evaporation. The stronger trade winds also push cloud cover farther to the west than normal. As a result of the reduced cloud cover, more downward shortwave radiation is allowed to enter and warm the tropical Pacific during La Niña events.
To complement that, here’s a graph to show the interrelationship between the sea surface temperature anomalies of the NINO3.4 region and cloud cover for the regions presented by Pavlakis et al.
That discussion explains why the long-term warming of the Ocean Heat Content for the tropical Pacific was caused by the 3-year La Nina events and the unusual 1995/96 La Niña. First, here’s a graph of tropical Pacific Ocean Heat Content. It’s color coded to isolate the data between and after the 3-year La Niña events of 1954-57, 1973-76 and 1998-2001. Those La Niña events are shown in red. Note how the ocean heat content there cools between the 3-year La Niña events. Anyone who understands ENSO would easily comprehend how and why that happens. It’s tough to claim that greenhouse gases have caused the warming of the tropical Pacific when the tropical Pacific cools for multidecadal periods between the 3-year La Niñas, Composer99.
As you can see, the warming that took place during the 1995/96 La Niña was freakish. Refer to McPhaden 1999 “Genesis and Evolution of the 1997-98 El Niño”.
McPhaden writes:
For at least a year before the onset of the 1997–98 El Niño, there was a buildup of heat content in the western equatorial Pacific due to stronger than normal trade winds associated with a weak La Niña in 1995–96.
Based on the earlier description, that “build up of heat content” resulted from the interdependence of trade winds, cloud cover, downward shortwave radiation and ocean heat content. Simple. As you can see in the above graph, the upward spike caused by the 1995/96 La Niña skews the trend of the mid-cooling period, and if we eliminate the data associated with it and the 1997/98 El Niño, then the trend line for the mid-period falls into line with the others.
So far, there’s no apparent AGW signal.
Let’s move on to the extratropical North Pacific. That dataset cooled significantly from 1955 to 1988, more than 3 decades. Where’s the CO2 warming signal there, Composer99? Then in 1989 and 1990, there was an upward shift. It’s really tough to miss, because the North Pacific was cooling before the sudden 2-year warming and then it warmed after it. As you’ll note, the cooling trend before the shift is comparable to the warming trend after it. BUT, big but, the cooling period lasted for 34 years, while the warming period only lasted for 22 years. That means the North Pacific (north of 24N) would have cooled since 1955 if it wasn’t for that 2-year upward shift.
In summary, the ocean heat content data for the Pacific Ocean north of 24s (the initial graph) gives misleading impression of a relatively continuous warming; it’s misleading because, when the data is broken down into two logical subsets, tropics versus extratropics of the North Pacific, the data clearly shows that factors other than greenhouse gases were responsible for the warming.
- Climate of Doubt Shines a Light on the Climate Denial Movement
Billhunter at 18:02 PM on 29 October, 2012
It doesn't seem to me that an energy imbalance has been observed. Its hypothesized. If I am wrong about that I would be interesting in reading about it.
(-SNIP-) - How much has nuclear testing contributed to global warming?
vrooomie at 05:22 AM on 24 August, 2012
Tom Curtis, in your third 'graph, under the "Annual Yields" graph, you've mispelled 'from' to 'form.'
I understand though, having rented flingers, too..;)
Thanks for this article, and to Doug: I'm waiting for bated breath to hear what next the denialisti come up with, for the global warmings, as their cherished 'causes' fall like dominos.
Excessive planting of sunflowers, causing too much reflection of yellow light up to the troposphere?
Where I live--surrounded by ~25K acres of corn, alfalfa, and *sunflowers*, and in the county in which I live (where I'm one of two, *maybe* ten Progressives--it would be an easy sell.
You heard it here, first...;( - Newcomers, Start Here
Bob Lacatena at 23:40 PM on 21 June, 2012
bmac, 19,
[Please note that while most links are to Skeptical Science articles, virtually all include multiple references to peer-reviewed literature. But you're not going to understand the answer very often by taking one, single paper in isolation. Science is the body of work, as it is (well) understood by the people who do it every day. So you need the Skeptical Science articles to help provide introduction and context where you may be lacking in background knowledge.
But Skeptical Science articles are very heavily cross-linked to supporting material. Follow the links.]
There are so many fallacies in what you posted, both in the argument that you presented and the way the components that you posted, that I don't know where to begin. I will remember that your main question was on that puny 1-2 ppm CO2, but:...we know that the earth warms and cools in natural cycles...
This is the first "gotcha" that implies that (a) climate changes a lot (it doesn't) and (b) we don't understand those magical, mystical cycles. Both implications are dead wrong.
Internal Variability
It's a Natural CycleHas human activity been speeding up the warming...
This is like asking if you are still beating your wife. How do you answer? Human activity is not speeding up warming, it is causing warming. Without human activity the planet would be cooling right now. Solar activity is down, dimming aerosols are up.
Lean and Rind (2008)
Gillett et all (2012)
It's not the sun...and create a run-away greenhouse effect?
This is denial-alarmism for a you, a strawman created to make the opposing position look ridiculous, by exaggerating it to the point where it is ridiculous. No one is saying there will be a run-away greenhouse effect. No one has to. A plain, ordinary 3˚C to 5˚C of warming can be catastrophic to civilization and people, all by itself. It won't be a runaway effect, but it can be very bad.
Runaway Warming
VenusOver 90% of that increase is from industrial processes...
Industrial processes that do what? Make cars, televisions, and plastic toys? Make ships and trucks and airplanes that move the cars, televisions and plastic toys? This is another strawman, making any effort to separate what you use individually. You are a member of society, a complex, interwoven, technological-industrial society. You use everything society creates, and that includes the tanks and the planes that guard your borders, even if you never sit in them yourself.So we would have to devastate industrial production...
More denial alarmism. The only people who say that taking immediate, deliberate action will devestate economies are denial-alarmists, who are trying to frighten you away from thinking clearly.
CO2 Limits Economy
Renewable EnergyCan you cite me some scientific literaure that would support the idea that a 1-2 parts-per-million increase in carbon dioxide would have a significant impact on the thermodynamic properties of the atmosphere?
First, this contains yet another debate-tactic, the implication that human contributions are so small on an annual basis that it can't possibly matter.
CO2 is Just a Trace Gas
But what really matters isn't the 1-2 parts-per-million per year, it's the 337 gigatons that mankind has added (split between the atmosphere and the ocean, which is another huge, huge problem all by itself). That raises CO2 from 285 ppm to currently 400 ppm. That's not 1-2, that's 115. That's not a small percentage, that's a %40 increase.
"A significant impact on the thermodynamic properties of the atmosphere?"
The question you are asking is covered by the body of scientific literature on the subject. No, scientists didn't write one nice, neat paper to explain it to your friend because they thought he might ask. They've written hundreds of thousands of papers, discussing various details including everything from climate sensitivity to radiative properties.
In that light, I think that your question is best answered by reading (sorry, it's long, but really, it's necessary) Spencer Weart's The Discovery of Global Warming. This will tell you, in a rather easy to read format (given how dry the subject matter can be) how science developed, from the beginning to the near present, to the point where we understand fairly well (and continue to improve our knowledge, in spite of denial attempts to interfere with science and keep us in the dark):
- The radiative properties of gases in the atmosphere
- The climate components of the atmosphere and ocean
- The impact of the sun
- Climate sensitivity and feedbacks
- Past climate change
- Everything else
So... I'm sorry that the bottom line answer to your question is not "Hansen et al (2004) Everything Anyone Wants to Know About Climate Change in An Easy, 5 Page Peer Reviewed Paper." That's never going to happen.
But everything your friend said, including the things he falsely implied, is easily answered. The information is there, and the falsehoods need to stop. If deniers want to argue about things, let them argue about real things, not made-up strawman arguments intended to frighten people away from thinking clearly. - Modelling the Apocalypse
ranyl at 19:04 PM on 3 June, 2012
"Constant atmospheric carbon dioxide concentrations lead to continued warming for many centuries, whereas the elimination of carbon dioxide emissions leads to approximately stable or decreasing global temperature."
This is the caption from the blue line graph in the Nat.Geo publication, and this seems rather to totally unrealistic to me purely on the GHG front.
Why?
Well from the latest carbon models if CO2 emissions stopped today the fall atmospheric CO2 concentrations aren't falling by much for 1000's of years and as they do fall CO2 stored in the sinks is re-released delaying the fall even further, so stopping emissions today won't see any drastic fall in GHG in the atmosphere in the short term. The rate of drawn down from the recent models is ~0.2ppm per year so a fall of 20ppm in 100years, hardly removing the heater, and that doesn't take many things into account either...e.g. permafrost melt.
Also what about the CO2 that is always released when the earth warms up, ~14ppm a 1C, what has happened to that?
And does the albedo feedback just stop? Snow lines are moving north, the arctic is melting (~same size of the N.America Ice sheets when they were present), permaforst is melthing another source of CO2, the CO2 fertilization effect will equalise (see face trials it don't last long anyway) and decrease as soon as CO2 falls at all. Then there is the stopping of the fertilizer affects from man's agricultural practices which as been boosting the land CO2 sink considerably (this would all be lost actualy releasing CO2 as things equilibriated)and overall causing a slight cooling due to this and NO, methane and ozone interactions, and then of course there is the sudden lack of dimming as said which will be significant especially considering SO2 atmospheric concentration haven't actualy fallen world wide since 1980 and have started to rise again in th elast few years as India and China industrialise and finally ther eis the release of methane from melts permafrost and increasing wetlands.
And what about the warming already stored in the oceans, which most people put at another 0.5-7C to come? According to Hansen the earth heats up 6-80% of its full potential in 100years then the additional 20% takes 1000years or so, so how can warming stop immediately, especially as the heater isn't turned off by stopping emissions it is stopped but reducing atmospheric CO2 concentrations!
And lets no forget the CFC's. HFC's. NF3 additional GHJG which last for eons and eons.
Sorry but I find it totally incredulous that zero CO2 emissions from tomorrow would just stop warming in its tracks, and would suspect the model being used is grossly overestimating CO2 drawn down and not taking the stored oceansic heat content into context.
Bottom line is to prevent 2C we don't just need to stop emissions we need to actively build-up land and oceanic sinks to draw CO2 out of the atmosphere.
Remember which ever you look at it, when the sun was dimmer than today, the world's geography basicaly the same, a CO2 of 350ppm cuased the world to be 3-5C hotter, so how is stopping at 400ppm going to stop us warming to this full potential???
SO basically overall saying stopping emission will halt warming is not realistic and actually gives false hope.
We need to actively get to 350ppm by 2100, and the only way to do that is to stop all emissions for sure and by 2017!!!!!!, and then actively remove CO2 to get to 350ppm by 2100, which if the early Pliocene data is correct still means 1.8-2.4C by 2100.....in Hansens lastests papers this is more like 1.4-1.6C, but he has th eearly Pliocene only 2oC warmer as he uses deep ocean temepratures with a conversion factor whereas all other studies have 3-5C and CO2 concentrations of ~350ppm, upper limit 400ppm but with more specific CO2 proxies only 325ppm....
Sobbering, but entirely possible, just take everyone to realise it and also realise that 2C isn't dangerous because of potential tipping points but because the climatic shifts and severe weather events, drought s and floods have no mercy on crops or water availability! and a direct threat to us all not just those in other parts of the world. - Why Are We Sure We're Right? #1
KeefeandAmanda at 02:11 AM on 23 April, 2012
Well, when all the causal possibilities except one have been pretty much falsified, by the process of elimination that's pretty darn well close to being sure.
Here is what I mean:
I like to simplify and generalize things as much as possible when talking to people about global warming, especially when they are fake skeptics. Here is what I say:
To simplify and generalize things as much as possible, let's realize that apart from heat from the interior of the planet, there generally are only three possible ways to heat the planet's fluidic system (atmosphere and oceans taken together as a system - see
http://en.wikipedia.org/wiki/Fluid_dynamics
for an idea of what I mean): (1) More heat falling onto Earth from space (from the sun); (2) more of the heat falling onto Earth being absorbed - that is, decreased albedo or less reflected sunlight; (3) less of the absorbed heat radiating back out into space via increased greenhouse gas activity. (All talk of such things as cosmic rays, clouds, aerosols from volcanic activity or human pollution, etc. is covered by the general case of (2).)
Atmospheric heating by either of general cases (1) and (2) alone or together implies that, globally:
(A) the nighttime temperature rises slower than the daytime temperature;
(B) the arctic temperature rises slower than the equatorial temperature;
(C) the winter temperature rises slower than the summer temperature.
Atmospheric heating by general case (3) implies that, globally:
(D) the nighttime temperature rises faster than the daytime temperature;
(E) the arctic temperature rises faster than the equatorial temperature;
(C) the winter temperature rises faster than the summer temperature.
Guess what has actually has been happening on average over the past several decades? Conditions (D), (E), and (F) happened, the opposite of (A), (B), and (C).
Since (1) or (2) alone or taken together implies false conditions, the fake skeptic claim that only one or both of (1) or (2) has been causing the heating - that (3) has had nothing or essentially nothing to do with it - is falsified.
By the process of elimination, there has to have been very significant involvement of (3) to result in the heating, an involvement much more significant than the fake skeptics are willing to admit to. - Roy Spencer finds negative feedback
skywatcher at 10:54 AM on 22 April, 2012
Uncle Ben, you appear, from your writing here, to be someone who has based their entire opinion of this subject on your reading of a single, non-peer-reviewed, book. A book within which Spencer was free to publish whatever he liked, including the accusations of supression, heck he would have been free to attribute global warming to pink leprechauns were he in the mood! While books can indeed be informative, there is great freedom in writing a book to publish unsubstantiated or erroneous claims, a freedom that is generally restricted by the scientific peer-review process. Indeed, that is the purpose of peer review. Peer review does not eliminate all the bad science, but it weeds out the most obviously wrong/unsupported claims. It is a small step to go from Spencer's book to Gavin Menzies, who annoyed historians by publishing wild, unsupported claims about the Middle Ages exploits of the Chinese, and only a small further step to pure fiction a la Dan Brown.
As such, your writings here stand as a cautionary tale for those who would base their understanding of a sunbject on a single source (Spencer) or single line of enquiry (tropical cloud models). Fortunately, our understanding of climate science is based on a great breadth of empirical data of human fingerprints on climate, including empirical evidence of positive feedbacks. This evidence comes from a whole range of branches of science, including but not limited to physics, chemistry, palaeoclimate, oceanography and atmospheric science. It provides a coherent picture, without gaping holes in our understanding, such as demonstrated above with glacial-interglacial cycles. A picture supported by, but not dependent upon, the models, and a picture largely avoided by Spencer. - Why Are We Sure We're Right? #1
funglestrumpet at 02:33 AM on 22 April, 2012
Yet again the discussion centres on whether we as a species are responsible for global warming or not.
Just imagine for one moment that our certainties about AGW are in fact misplaced and Mr Watts, Professor Salby and that small number of like minded individuals who are of a similar opinion, are actually right about global warming and we are not the cause. It might be that the current warming is actually due to some as yet undiscovered aspect of the natural carbon cycle that has the effect of increasing atmospheric CO2 concentrations. Or, it might be that the IPCC, despite all its credentials, is wrong on the issue and the warming is due to the Sun. Alternatively, it might be due to a global increase in flatulence resulting from eating genetically modified crops. Would that mean that we should not do whatever we can to limit the warming that we are experiencing (especially if it is due to the latter)? I sincerely hope not.
I rather think future generations would wonder why we did not curtail our production of CO2 all the more if the warming were due to some other reason than that currently identified, especially if it were an unknown one. Regardless of its cause, we do know that cutting our CO2 production would act to combat the phenomenon and should really be given a far higher priority than it currently enjoys.
Until Mr Watts, or Professor Salby, or whoever else (but please not Monckton, I am already dangerously close to an overdose of that individual), can identify why the planet is warming if it isn’t due to our production of CO2 (the famous ‘A’ in AGW), then surely the safest course of action is to try to re-establish the conditions that we know produced a reasonably stable temperature in the past. In other words, we should be working really hard to achieve pre-Industrial Revolution CO2 levels. When Mr Watts etc. produce hard, peer-reviewed evidence of what they believe is causing the warming if it is not due to mankind, and, of course, what they recommend the remedial action should be, I see no other option, unless the free market takes precedence over saving lives, of course.
Perhaps Mr Watts might like to respond with an explanation as to why he does not support cutting our CO2 production, regardless of what is causing Global Warming, i.e. with or without the 'A'. - Shakun et al. Clarify the CO2-Temperature Lag
Michael Whittemore at 20:27 PM on 21 April, 2012
I see William has replied to a "comment" of mine, the first "one" I sent him. This is because he cant seem to be able to read all the comments put to him and formulate a response. I for one am not prepared to deal with someone with that kind of intellect.
But just so we can all see how he has twisted his stance, his first comment on this thread stated "To enhance or continue global warming is atmospheric CO2 really necessary to explain it?" Link to comment. Williams mentions nothing about LGM, he is simply stating that CO2 should not be needed to explain the global warming which is seen during the end of the last glaciation. This is the bases of the study by Shakun, that it was not a temperature rise that caused a global forcing, but increased concentrations of CO2 that did it.
Williams second comment in this thread clearly states that CO2 is not needed to explain any of the warming by saying "It is really the increase in sun light that triggered the whole thing. As more water vapor enters the atmosphere the warming continues [...] I do not understand how CO2 is needed to explain what happened Link to comment.
Even when Tom Curtis showed the science and pointed out that " [H2O] was even less able to trigger a self fueled runaway effect as [William was] suggesting" Link to comment. William just twisted his stance by saying "It seems to me that H2O levels alone are enough to explain the GHE effect part of the triggering the end of the ice age." Link to comment. This is the point when William changed his stance from CO2 had nothing to do with warming during the last glaciation, to CO2 had nothing to do with warming during the LGM. Every comment after this time is William trying to explain that CO2 did not cause the warming during the LGM period, which we all know is true.
Even in his fourth comment after the one stated above, you can see how he has twisted his stance but continues to make it sound like he has not, "CO2 may have played an important part but I do not see any evidence that it had to be CO2 that caused the ice age to end." Link to comment
Of cause by this time he has seen where he was wrong and understands that his stance has changed, so he states "Where am I going with all of this? No, nothing sinister. So far we are talking about just the first 2,500 years" Link to comment
My first comment to William I tried to explain that the warming seen in the north after the CO2 rise could not have been caused by H20 by saying "Due to the north's temperature increase lagging CO2 and the fact that the (AMOC) was not causing any warming up there, H2O can only really be seen as a regional short term positive feedback that could not have caused a global warming as is seen." Link to comment. Williams replay to this, "Right now I am talking only the 2,500 year period after the LGM [...] You made a comment about CO2. Considerations of its effects are a primary topic here but a full disscussion is I think beyond the scope of this thread." Link to comment. Personally I think this is the most ridicules comment so far from Williams, this thread is completely about CO2, it has absolutely nothing to do with H2O I can ensure that much. - Shakun et al. Clarify the CO2-Temperature Lag
Michael Whittemore at 15:50 PM on 14 April, 2012
William Haas @86
I am going to put it in a more simply way and see what you have to say. The orbital warming only happened in the far north at first, shown in figure 5. The initial warming is caused by the sun and all the feedback's that occur when there is an added forcing.
With the onset of the seesaw, both 30-60N and 60-90N start to cool while all of the other latitudes start to warm. With H2O only being a short time GHG that does not mix as well as CO2, H2O can not explained the increased warming seen in the far north. Due to the north's temperature increase lagging CO2 and the fact that the (AMOC)was not causing any warming up there, H2O can only really be seen as a regional short term positive feedback that could not have caused a global warming as is seen.
I personal think that if CO2 was not the powerful greenhouse gas the science community has shown it to be, then the (AMOC) would simply had come back on when the northern regions cooled enough. But due to them following CO2 increase (as expected) the (AMOC) could not be brought back on. - Solar Cycle Length proves its the sun
Doug Hutcheson at 19:21 PM on 29 March, 2012
tompinlb @ 17, you speak of "Archangel Russia with a change of 0.14 degC per decade" and then state "This station has experienced a rate of temperature change that is 300 percent of the average rate of change shown for HadCRUT3", yet earlier you made the point "the average for HadCRUT3N in this same table is shown as 0.47 degC per decade". I am confused, or misreading the figures, but 0.14 is not 300% of 0.47 in my book. Have I misunderstood something?
Your final sentence reads "They only make the argument, and provide the evidence to support the argument, that previous solar cycle length explains from 40% to 60% of the historic change in temperatures in the stations that they investigated". I think you are mixing up correlation with causation. They have identified a weak correlation between temperature change and previous sunspot cycle length, without suggesting any mechanism by which the previous cycle is implicated in causing the temperature change. The apparent correlation is a curio, no more. As stated in the paper: "This indicates a possible existence of a physical mechanism linking solar activity to climate variations", which is really no more definite than linking hem-lines with global warming, or even hem-lines with solar cycles.
They conclude "This indicates a connection between the behavior between the solar dynamo and temperatures on the Earth". Of course there is a connection! The forcing from TSI is already well explored and is taken into account when modelling future climate change, along with all the other known forcings. The observed influence of variations in TSI is slight and does not lag the solar cycle by 6 years, or 12 years, or any other arbitrarily selected time span.
I would reword the final sentence of your comment @17 like this: "They make the allegation, without providing satisfactory evidence to support the allegation, that previous solar cycle length explains from 40% to 60% of the historic change in temperatures in the small sample of stations that they investigated, without proposing any credible mechanism by which this may have occurred and without showing how this mechanism has affected global mean temperatures.".
If the authors had come up with a new theory that invalidated what we know already about forcings on climate, they would be in line for a Nobel Prize, instead of being relegated to publishing in a fringe journal.
I believe I speak for everybody on this forum in saying we would be thrilled to discover that AGW is not real and we can all sleep easy in our beds. The Solheim, Stordahl and Humlum paper has not done anything to refute AGW, unfortunately for us. - NASA scientists expect more rapid global warming in the very near future (part 2)
mdenison at 03:17 AM on 6 February, 2012
#7 renewable guy
The Solar Flux given the value above the atmosphere. However some of that is reflected by the Earth due to the albedo effect and the remainder (about 7/10ths) is spread over the surface of the Earth so we must divide by 4 to obtain an average flux for the whole planet. So multiply 1.5 x 0.7 x 0.25 and you are close to the 0.25 W/m2 variablity in the forcing quoted.
There is some discussion of this in other SkS articles. e.g. How we know the sun isn't causing global warming. Other sites like Real Climate discuss this too. - Clouds provide negative feedback
RW1 at 10:57 AM on 15 December, 2011
I'm a bit late on this.
We all agree that clouds both cool by reflecting the Sun's energy and warm by 'blocking' or delaying the exit of surface emitted energy, but this is rather trival to the fundamental question of the net cloud feedback, is it not? The biggest problem is in the current climate, the net effect of clouds globally averaged is to cool by about 20 W/m^2, as is even acknowledged in papers claiming to show net positive cloud feedback (i.e. Dessler 2010), and is consistent with net negative feedback from clouds. This discrepancy would have to be explained in the context of strong net positive feedback from clouds on incremental warming, would it not? Not only is this not explained either by Dessler or anyone else to my knowledge, but without knowing physically why the net effect of clouds is to cool by 20 W/m^2 in the current climate, there is no way to know if the assessments of net positive feedback on incremental warming are accurate, let alone even physically possible. Ultimately, the fact that no one purporting evidence of net positive cloud feedback can explain this or even tries to explain it in light of the conclusions of their work, is rather telling to me how weak and unsubstantiated the case for net positive cloud feedback actually is.
And while globally averaged, the water vapor concentration and water vapor feedback in response can further increase temperatures in a warmer world, it cannot be separated or isolated from the cloud feedback, as the two are constantly interacting together to maintain the current energy balance. This gets back to my point about the water vapor and cloud feedbacks already operating in a very dynamic manner in the current climate's globally averaged state from the forcing of the Sun.
From this, let's look at the fundamental question of climate sensitivity, net feedback, etc. from the basic constraints dictated by conservation of energy.
If the surface of the Earth is the warm by 3C, it must emit 406.6 W/m^2 from S-B (assuming an emissivity of 1 or very close to 1), which is +16.6 W/m^2 from the current global average of 390 W/m^2. Conservation of Energy dictates this +16.6 W/m^2 flux has to be entering the surface from the atmosphere on global average if it is to warm by 3C. There are really only two possible sources for this required energy flux into the surface, and that is either from the Sun via a reduced albedo or from increased atomspheric absorption (like from water vapor).
If the current averaged state of the atmosphere is only going to provide +6 W/m^2 (+1.1C) from 2xCO2 (3.7 W/m^2 directly from the CO2 'forcing' and the remaining 2.3 W/m^2 from the current average opacity of the atmosphere; 3.7 W/m^2 x 0.62 = 2.3 W/m^2), where is the additional 10.6 W/m^2 needed for the 3C rise coming from?
Can anyone explain and quantify the actual physics of how about a 1 C rise in temperature will change the atmosphere in a way that will further cause an additional 10.6 W/m^2 flux into the surface? If you think it will come primarily from increased water vapor, are you claiming that the water vapor absorption will increase by 10.6 W/m^2 from a 1 C rise in temperature (actually more than 10.6 W/m^2 because half of what's absorbed by the atmosphere escapes to space as part of the flux leaving at the TOA), and if so based on what data or physics? Or if you think the combined cloud feedback will cause a large portion of it, in what specific physical way? If by letting in more sunlight, how does increasing water vapor cause decreasing clouds or more transparent clouds? If by causing increased atmospheric absorption through more clouds, how is this specifically more than the incremental power reflected from the additional or thicker clouds? How is this rectified with the fact the net effect of clouds is to cool by about 20 W/m^2 in the current climate?
In general there seems to be a lot of hand waving in regards to this fundamental question and answers to it tend to only be vague, generalized statements like "it comes from the all the feedbacks" or "from downward LW", etc. This kind of sloppy and incomplete scientific reasoning is not good enough.
The required energy entering the surface for a 3C rise has to be coming from somewhere specific and from some specific physical process or combined processes that can be corroborated by some real, observable, quantifiable physics and data. I see mosly heuristic assumptions and more or less wild guessing dressed up as some kind of quasi 'best estimate' or 'educated guess'. - Is there a case against human caused global warming in the peer-reviewed literature? Part 1
Bob Lacatena at 16:11 PM on 10 November, 2011
63, cjshaker,
You have misunderstood or misrepresented the quote (which isn't by John Kerry, by the way). What he said was:"There was a massive study of every scientific article in a peer reviewed article written on global warming in the last ten years. They took a big sample of 10 percent, 928 articles. And you know the number of those that disagreed with the scientific consensus that we’re causing global warming and that is a serious problem out of the 928: Zero."
What you claimed he said was:...claims that NO peer reviewed articles cast doubt on AGW were incorrect.
Anyone can see the difference.
The actual quote was citing a specific study that took a snapshot in time of a portion of the available studies and found zero.
You are claiming that he said that no peer-reviewed articles exist at all (with the implication that such a statement must also have future predictive power, since An Inconvenient Truth was released in 2006, five years ago).
More importantly, you have still not even proven that statement to be false. Can you identify a peer-reviewed paper which has withstood scrutiny and is accepted to cast doubt on AGW?
By the way, as far as I can tell the quote is in fact from "An Inconvenient Truth" (that's right, he did say it, but it still doesn't at all say what your paraphrase says). - CERN - Saying Nothing About Cosmic Ray Effects on Climate
Albatross at 03:41 AM on 21 September, 2011
tblakeslee,
I am not sure whether or not you are issuing a plea or a challenge. And what you linked us to it is not a published science paper but an essay on a blog.
Even if the CGR hypothesis were very real and shown to be a theory and that CGRs do in fact modulate the global climate, then the changes would be very small and infrequent. Additionally, the GCR theory would then just become part of a whole suite of climate drivers, it would not in any way shape or form refute the known radiative forcing properties of GHGs, and thus would not in any way refute the theory (not hypothesis) of AGW.
Moreover, if the aforementioned happens to be true, then it does not explain the observed fingerprints that have been associated with warming on account from increased GHGs.
So I do not understand your eagerness to join those who deny the theory of AGW based on a hypothesis or a blog essay, when we have all these data, science and facts demonstrating that CO2 is driving a significant portion of the warming that we have witnessed over the past 100 years.
And I am not sure what predictions made by Landscheit are now allegedly coming to fruition you are referring to. One of them is ertainly not this one:
"a long period of cool climate with its coldest phase around 2030 is to be expected."
Besides, research has found that even if solar forcing were to decrease to a maunder-liek minimum for a long time, it would have a very minor impact on global temperatures. SkS has covered this here.
Now none of this is to try and claim that the sun is not important for regulating the earth's climate, of course it is. The point is that solar changes cannot explain the warming of around +0.8 C observed the past 100 years or so, and even if we went into a maunder-like minimum, the current and future levels of GHG forcing from burning fossil fuels and land-use change by humans will more than offset any negative radiative forcing or cooling. - Climate Communication: Making Science Heard and Understood
apiratelooksat50 at 23:41 PM on 15 September, 2011
1. Do you understand how carbon dioxide in the atmosphere works to keep the planet warmer than it would be without carbon dioxide?
b. yes, pretty much
2. If you answered "yes" to question 1, choose the answer below that best describes the process of CO2 warmth.
c. Greenhouse gases trap heat like a greenhouse roof.
3. Atmospheric CO2 is increasing rapidly and has been for a century. How do we know that this increase is caused by humans?
b. We don't really know, but we have been releasing massive amounts of CO2 through the burning of fossil fuels and use of concrete.
c. Studies show that features of the natural world, like the oceans, have stopped acting mainly as sources for CO2 and instead have been acting as sinks; at the same time, we are releasing massive amounts of CO2. We also have isotope studies.
(These answers are awkwardly worded. Need to be revised.)
4. How much credence do you give to the idea that working climate scientists would intentionally misrepresent climate science in order to make more money for themselves?
(This is a ridiculous question and the answers more so. It has no place in a survey of this type and shows definite bias.)
5. Natural climate cycles occur. The sun's radiated energy waxes and wanes. Earth's orbit wobbles and ovals. The continents move. La Nina and El Nino happen. How do we know that these natural cycles aren't responsible for 20th/21st century warming?
(The answers were inadequate for this statement.)
6. What do the IPCC and other international agencies predict about global warming if we do nothing to stop it? Check all that apply.
c. Plants and animals will be forced to adapt to changing conditions, and some species will become extinct.
e. The Earth will be on average 2-5C warmer in 2100.
f. The seas will rise up and drown coastal cities.
g. Many glaciers will melt, causing a loss of drinking water for tens of millions of people.
h. The changes will cause big migrations of people.
i. Over the next century, some areas will get more intense rainfall, and other areas will become very dry.
k. food and water prices will continue to rise rapidly.
7. What is more important, a healthy economy or a healthy environment? Note that choosing one does not mean you think the other is not important.
(They are equally important. We should strive for responsible consumption by developed countries, and cooperation between governments, industries, and citizens to achieve a sustainable world.)
8. If you believe that a rapidly warming planet is a problem, how will (not "how can") that problem be solved?
9. Do you think climate science should be publicly funded (as it is now)?
a. yes
10. How different will the world be for your grandchildren due to global warming?
d. different, but only a little different because the problem isn't really that bad.
(Some things will be better. Some things will be worse. Some things will not change.) - Climate Communication: Making Science Heard and Understood
DSL at 02:05 AM on 15 September, 2011
I'd like your students' answers to the following. This would serve better as a diagnostic near the beginning of the course.
1. Do you understand how carbon dioxide in the atmosphere works to keep the planet warmer than it would be without carbon dioxide?
a. yes, very well
b. yes, pretty much
c. err . . . sort of
d. not really
e. no clue
2. If you answered "yes" to question 1, choose the answer below that best describes the process of CO2 warmth.
a. CO2 naturally emits heat and thus warms the atmosphere.
b. Radiation from the planet's surface "bounces" around between "greenhouse" gas molecules before it eventually escapes to space.
c. Greenhouse gases trap heat like a greenhouse roof.
d. Since pressure causes heat, the weight of CO2 in the atmosphere causes the surface to warm.
3. Atmospheric CO2 is increasing rapidly and has been for a century. How do we know that this increase is caused by humans?
a. Humans cannot cause changes in the climate.
b. We don't really know, but we have been releasing massive amounts of CO2 through the burning of fossil fuels and use of concrete.
c. Studies show that features of the natural world, like the oceans, have stopped acting mainly as sources for CO2 and instead have been acting as sinks; at the same time, we are releasing massive amounts of CO2. We also have isotope studies.
d. We don't know because the measurements of CO2 are all flawed and do not match each other.
4. How much credence do you give to the idea that working climate scientists would intentionally misrepresent climate science in order to make more money for themselves?
a. It's ridiculous. Climate scientists make good wages, and any funding they get they have to use on projects. A few make money on books, but the books did not have a market until the so-called 'skeptics' began to resist the message of the science.
b. I can see how it might happen. After all, companies that make war machines profit from war, and they usually strongly support going to war.
c. I doubt it; government-funded scientists don't have to work from the profit motive.
d. Of course: it's all a giant hoax to rip off taxpayers.
5. Natural climate cycles occur. The sun's radiated energy waxes and wanes. Earth's orbit wobbles and ovals. The continents move. La Nina and El Nino happen. How do we know that these natural cycles aren't responsible for 20th/21st century warming?
a. I don't know.
b. The cycles with all of those listed are either too long, too short, or too weak to match current warming, though there may be other cycles we don't know about, and that fact invalidates climate models.
c. The cycles with all of those listed are either too long, too short, or too weak to match current warming.
d. We do know that it is natural cycles. The sun is causing the current warming trend.
6. What do the IPCC and other international agencies predict about global warming if we do nothing to stop it? Check all that apply.
a. The Mississippi River will be dry in 100 years.
b. There will be no summer ice in the Arctic by 2100.
c. Plants and animals will be forced to adapt to changing conditions, and some species will become extinct.
d. The Earth will be on average 10C warmer in 2100.
e. The Earth will be on average 2-5C warmer in 2100.
f. The seas will rise up and drown coastal cities.
g. Many glaciers will melt, causing a loss of drinking water for tens of millions of people.
h. The changes will cause big migrations of people.
i. Over the next century, some areas will get more intense rainfall, and other areas will become very dry.
j. People around the equator will burn to death.
k. food and water prices will continue to rise rapidly.
7. What is more important, a healthy economy or a healthy environment? Note that choosing one does not mean you think the other is not important.
8. If you believe that a rapidly warming planet is a problem, how will (not "how can") that problem be solved?
a. through individual action alone, using the mechanism of the free market.
b. through government-subsidized clean energy start-ups.
c. through direct government intervention.
d. through government regulation programs like carbon trading.
e. through cultural change, a movement to live differently.
f. it won't be solved. We'll just have to pick up the pieces after the worst of it and then build the world in a better way.
9. Do you think climate science should be publicly funded (as it is now)?
a. yes
b. yes, and funding should be increased
c. no
d. no - climate science should be subject to the forces of the market, like any other product
10. How different will the world be for your grandchildren due to global warming?
a. no different.
b. different, but better, because we will have solved the problem.
c. different -- worse, because people will be fighting for resources instead of working together.
d. different, but only a little different because the problem isn't really that bad.
e. different, but better because more territory and resources will be available in a warmer world.
Willing to share your answers, pirate? - Models are unreliable
Tom Curtis at 22:00 PM on 3 September, 2011
Eclipse @386:
1) Doug Cotton is certainly not in a position to judge this (see point 4), and indeed is completely wrong. Specifically, climate models very accurately predict the change in radiative forcing due to changes in greenhouse gas levels.

To give you an idea how accurate line by line models are in those predictions, here is a comparison of model data (dotted line) and observed data (solid line) over the Gulf of Mexico:

Global circulation models are not quite that exact, but more than exact enough to narrow the expected temperature rise per doubling of CO2 to the range of 1.5 to 4.5 degrees C. Copious physical evidence from diverse sources narrows that still further to 2 to 4.5 degrees C, with a most probable value of 3 degrees C.
2) An as yet unpublished paper that refutes a well established theory is worth no more than the paper it is currently printed on. In fact,from clues about the contents of that paper Cotton has left on this website, the paper is not only unpublished but unpublishable as it shows no knowledge of basic physical laws, including those relating to thermal conduction (the theory on which the paper is supposedly grounded), but also directly contradicts well determined measures of heat flux from the core to the surface. (I have linked you to my posts, but other posters have equally effectively rebutted Cotton's nonsense.)
3) Cotton just made that 99% figure up. In fact, the reduced rate of global warming is not unexpected given high aerosol emissions by China, a recent solar minimum lower than anything since 1910, and three strong La Nina's in just four years. But China is curtailing its emissions, La Nina's come and go, and the Sun is now well into its next solar cycle so expectations of anything but renewed warming are just wishful thinking.
4) Curiously I am responsible for this belief by Cotton. He came on this site saying the majority of thermal emissions from the Earth's atmosphere were from oxygen and nitrogen. This is an absurd falsity. When I demonstrated to him that he was wrong, he without pause or consideration switched to this new theory. He had just made a massive change in his theory but it made no difference at all to his conclusion, ie, that global warming is false. It is safe to conclude that Cotton want's to retain that conclusion, and no near detail of fact or logic will be allowed to prevent him from doing so. He is one of those unfortunate people of whom it can be said that he is always in error, but never in doubt. - How we know we're causing global warming in a single graphic
John Hartz at 03:33 AM on 28 July, 2011
I’m not particularly enamored with the following two sentences of John’s essay:
“If the sun was causing global warming, it would cause summers to warm faster than winter, days to warm faster than nights and the upper atmosphere to warm. Observations rule out the sun.”
Although the statements are correct in science-speak shorthand, they may not make sense to the average person reading the article. After all, the ultimate source of the infra-red radiation that is reflected back to Earth via the greenhouse effect is the sun.
Perhaps John should tweak these two sentences. - How we know we're causing global warming in a single graphic
Patrick 027 at 07:47 AM on 27 July, 2011
If the sun was causing global warming, it would cause summers to warm faster than winter,
Is this true sufficiently far from the Arctic? My understanding has been that the polar warming will generally tend to be greater in winter than in summer for either CO2 or solar forced-global warming, at least around where sea ice loss is occuring. - 2010 - 2011: Earth's most extreme weather since 1816?
Tom Curtis at 17:20 PM on 3 July, 2011
Eric (skeptic) @210:
1) The point about the size of the event is valid but irrelevant. Specifically, the events under discussion like those catalogued by Munich Re, where a tornado outbreak over three days spawning 300 tornadoes counts as a single "event".
2) Your definition of extreme sets to high a bar. Take for example the Moscow heat wave of 2010, with an expected return interval, which lay just above 4 standard deviations above the mean for July temperatures, giving it an Annual Return Interval on the assumption of a normal distribution of 1 in 10,000 years. According to your proposed definition, that only just qualifies as extreme.
As another example, the rains causing the Brisbane flood had an Annual Exceedance Probability of 1 in 400 for the whole event, and for the peak rainfall of 1 in 2000. That works out as lying between 3 and 3.5 standard deviations from the mean. This is a flood that sent twice the amount of water down the river as when Brisbane got hit by a cyclone in 1974, and as much as for Brisbane's breaking flood in 1893 (also cyclone related), but this was just from a line of thunderstorms. But according to you it is borderline as to whether it should count as extreme.
Or consider the Toowoomba flood. The rainfall for that flood had an AEP of just over 100, equivalent to a standard deviation of just 2.6. Consequently Toowoomba's "instant inland tsunami" does not count as an extreme event for you.
The clear purpose of your definition is to make "extreme events" as defined by you so rare that statistical analysis of trends becomes impossible. You as much as so so. In your opinion, " true extremes have small numbers of events which make it difficult to perform trending". But that is as good as saying your definition of true extremes is useless for analysis.
In contrast, an event with an AEP 2 SD above the mean (a 1 in twenty year event) is certainly extreme enough for those caught in the middle. Further, those events are predicted to increase in number with global warming. So why insist on a definition of extreme which prevents analysing trends when the theory we are examining makes predictions regarding events for which we are able to examine trends?
Why, indeed, is global warming "skepticism" only ever plausible once you shift the spot lights posts so that the evidence all lies undisturbed in the darkness. - The greenhouse effect is real: here's why
Gwinnevere at 17:42 PM on 19 June, 2011
Hello (no41) MoreCarbonOK;
Yes. It is definitely man-made.
The reason that any one of us — capable of performing basic calculations in mathematical physics
(apart from reading the many convincing linked/argued documentations in Skeptical Science on the many details from many research groups)
— can know why we certainly are on the right path in addressing Global Warming to Anthropogenic causes, is this one — please, MoreCarbonOK, and do tell your friends about it too:
With a general human evolution of technology
(illustrating image as below, details in AGW, the energy curve basic function as y=a[1–1/(1+[x/b]^n)], n=2, its derivative gives the effect [power] transient [ocean heat absorption, value 0,878 W/M² period 2000-2010, fairly in accord with other sources (Hansen group 2005), also in line with a more simple evaluation from Stefan-Boltzmann-radiation law, provided a correct interpretation], its integral gives the carbon-dioxide concentration [yielding a 98% match with measured values up to 2009, and further], both latter as long as t is added by fossil-carbon)
Fossil-Carbon curve (black) from WIKIMEDIA COMMONS and RENEWABLE ENERGY — Critical Evaluation of the U.S. Renewable Energy Policy, 2009, respectively
http://commons.wikimedia.org/wiki/File:Global_Carbon_Emission_by_Type_to_Y2004.png
http://www.renewableenergy.typepad.com/
it is IMPOSSIBLE to omit an additional temperature component (t) from a general fossil-carbon combustion temperature (T) from an emitted (combusted) amount (m) of the fossil carbon into the local atmospheric mass locale (M), account taken upon a general emissivity or absorption coefficient (a), simply expressed as
t/T=a(m/M) giving t = Ta(m/M)
[Temperature and Energy are proportional — as in the familiar General Gas Law: pV=kT=E giving T=E/k].
With account taken for thermal resistance
(R=t/P, P the irradiating power from the Sun: t catalyzes a thermal resistive increase from the already given irradiating Solar power)
the expression enhances to yield for a double
t := 2Ta(m/M)
[Of course, as long as a T exists (for fossils roughly around 2000-2200 °C), also a t inevitably will follow. But with no T (or a very low negligible value of it), also no t will be added: zero AGW].
With the given industrial fossil-carbon curve and its adopted mass-scale to fit the general energy-curve (E), m/t can be calculated [adopted value from 2005 as (average yearly scale base) 10.17094 T12 KG/°C, T for 10^+, with the reported yearly ca m=7 T12 KG fossil carbon to the measured total GW of ca t=+0.7°C], and (with a general Earth-based a=0.7, meaning ca 0.3 albedo) also M can be calculated [value 3.52138 T16 KG to be compared to the total atmospheric EarthM=5.3 T18 KG].
With simple figures [density at STP (Standard Temperature and Pressure) everywhere the same] M holds only at most h=60 meters above the solid Earth-surface to account for the measured t(AGW)-curve
— which (hence) excludes any AGW-debate on higher lying atmospheric layers (type Christy’s arguments, but also Lindzen’s »climate sensitivity»): these may (and do) contribute, but have no significance in the AGW-basics.
With a 50 pixel graphical square unit to draw from, and taking a more or less »simple» ocean (two-complex) period of type (cosx)+(cos3x) [coefficients must be added to get a scaling match to the other given curves] together with the basic t|E-smoothed fossil-carbon component, in all
y = 6[1-1/(1+[x/10]^4)] + 0.222(0.9[(2cos (pi x/1.48)) + 0.5(cos (3pi[x-0.1]/1.48))]),
or the corresponding now-year-based connection as
t(NASA)
= –0.4
+ (1.765)[1–1/(1+[(YEAR–1815)/212.7]^4)]
+ 0.0653(0.9[(2cos pi (YEAR–1880)/31.48)+0.5(cos 3pi[YEAR–1880-0.1]/31.48)])
we have the dotted (5) from the already known and well recognized sources (as) in
http://www.universumshistoria.se/AAAPictures/AGW1.htm
[The NASA-curve is reduced to 65% horizontally to match the time scale of Fossil-Carbon; The Fossil-Carbon vertical scale is then reduced to 33% to match (a closest possible approximation to) the (t|E)+(SeaPeriod) = NASA-curve vertical scale].
And as we clearly can see, the predictive power is unmistakable — however no account taken upon additive (radiative forcing) components (making the figure even worse); There is, obviously, only one known agent to account for the measured Global Warming:
industry. Safely. Exactly. Precisely.
While humanity is bound to the E-part of the t|E-function, it is necessarily not so to the t-part if, and only if, a solution is found in reducing the fossil energy source. (Meaning: we cannot stop human evolution, but possibly we can find another energy source than fossils to feed our [unstoppable] technological evolution, thereby removing a further t-increase).
Christy and Lindzen give wrong arguments (causing public chaos) because they do not account for the (unnoticed but simple) math-base (t/T-form) making up (an unmistakable equivalent to) the measured NASA-curve: the industrial fossil-carbon driving the whole (land-marine max height=60 meter) measure.
Radiative Forcing high above the Earth surface is explicitly not within the basic AGW-proof (the t/T-form giving a max h=60M), and therefore makes no contribution to the clarification of the AGW-quest itself. (Debates on the subject, not distinguishing the different aspects, make dead-end discussions).
AGW is no natural variation.
Hence, AGW cannot be explained by the general math referred to as Arrhenius’ expressions (often termed »radiative forcing» and associated with the higher atmospheric layers).
To explain (mathematically) for AGW, hence, a strict isolated mathematical-physical complex must be found (»no Arrhenius math»), including all the seven (7) known ingredients to the observed (A)GW-complex [and too, it must include »Arrhenius curves» as a special case if given specific offsets — so is also the case, indeed]. That is what the simple t/T-connection does — with a seemingly fine alignment to already presented figures.
wkg/Gwinnevere - How would a Solar Grand Minimum affect global warming?
KR at 00:04 AM on 18 June, 2011
Ken Lambert - "The point is that a constant elevated TSI above an 'equilibrium' value will equate to a linearly increasing amount of energy as measured by the area under the forcing curve."
Certainly, if the sun were constantly rising in TSI, perhaps on it's way to a red giant status, that would be true. It is not - why is this relevant to a discussion of a finite drop in TSI in a Grand Minimum?
A step rise in TSI (all other things remaining equal) will cause a rise in temperature and hence TOA radiation until the imbalance is addressed - at which point there is no continuing change in temperature or energy in the climate system, as it has reached a new equilibrium.
The data shown in the graph Albatross posted clearly demonstrates that something other than TSI is in play, due to the divergence of the TSI and temperature trends - and that something else is primarily GHG's.
As Tom Curtis pointed out, your statements in this regard are far more topical on the Solar activity & climate: is the sun causing global warming or It's the sun threads. - It's the sun
Bob Lacatena at 05:32 AM on 16 June, 2011
826, Tor B,
Until his work is published in its entirety, and available to all, it is only so much blather, and very unlikely to undergo scrutiny, since no one else to date has been able to accomplish what he claims, and quite to the contrary, a number of existing studies demonstrate the opposite. [See the #2 denial argument, It's the Sun.]
At this point, all you can do is to claim that he claims that he's submitted the masterful diagnosis which overturns all of modern climate science. Forgive me if I don't sit up too straight in my chair.
At the same time, he will also need to explain other things, like why CO2 is not causing any warming (considering that the mechanism is very well understood, and it would be a huge surprise if that mechanism is totally and completely misunderstood by all atmospheric physicists around the globe).
Sorry, but your post is only so much "trust me, I know a guy who knows the truth, just wait" hand waving, and as such is a wholly inappropriate claim to make. - Solar Hockey Stick
Arkadiusz Semczyszak at 18:14 PM on 18 April, 2011
For Dana1981 - who likes “simple calculations”.
The Sun - current solar “hockey stick” - what does this mean for the present warming?
We know already - with my comment above (63) and Berenyi Péter (75), that the The sun - to change its activity - it works on the climate of delay - “lag”.
Thus, TSI decline after 1985 is no argument that this “is not The sun”.
Well, but for example, Lockwood - indeed - cites: “... the current grand maximum has already lasted for an unusually long time ...”.
Despite this adds:
“However, the popular idea (at least on the Internet and in some parts of the media) that solar changes are some kind of alternative to GHG forcing in explaining the rise in surface temperatures has no credibility with almost all climate scientists.”
Why?
“In other words, the feedback must essentially double the GHG forcing if they are the cause of the GMAST rise. On the other hand, our best estimate of the first term on the right-hand side of equation (10.1) is 0.23 W m−2 (ΔITS=1.3 W m−2). If the analysis of Scafetta (2009) were correct and 65 per cent of the observed warming were due to solar effects, then the first term on the right-hand side of equation (10.1) plus the feedback would need to supply 0.65×5.15=3.35 W m−2. In this case, the feedback must supply 3.35−0.23=3.12 W m−2, which means that they need to explain an amplification of the solar input by a factor of 13.5.”
Full agreement.
However, as it was before?
The like changes in temperature - as now - most probably, we observed in the Holocene (especially the middle Holocene), the above-defined variability of the Sun. At least once in the Holocene (perhaps several times), comparable to the "... solar input by a factor of 13.5. ... "certainly has been achieved!
Connection - allegedly our GHG - and react to changes in the TSI for temperature changes in the Holocene, gives absurd results.
professor Shaviv: “According to the IPCC (AR4), the solar irradiance is responsible for a net radiative forcing increase between the Maunder Minimum and today of 0.12 W/m 2 (0.06 to 0.60 at 90% confidence). We know however that the Maunder minimum was about 1°C colder ...”, “This requires a global sensitivity of 1.0/0.12°C/(W/m 2 ). Since doubling the CO 2 is thought to induce a 3.8 W/m 2 change in the radiative forcing, irradiance/climate correlations require a CO 2 doubling temperature of ΔT x2 ~ 31°C !!”
Well, unless we accept the data - changes in TSI - from this analysis: Jeffrey A. Glassman, PhD, However, the balance of feedback for a doubling of CO2 would be only slightly positive or even negative.
It is true that a simple calculation?
Of course, the only alternative is a combination of solar and GHG (as one of the effects of second-order) to explain the change in temperature in the mid-Holocene or MCA / LIA.
Frank et al., 2010.: “ ... a 50-year CO2 response lag—such timing is consistent with modelled CO2 response to a temperature step change. [for pre-industrial 1050–1800 period]”
The temperature is delayed to the sun - an increase in TSI. Changes p.CO2 delayed against temperature.
According to ice cores, however, changes in CO2 in this period were small (c. 10 ppmv). Nevertheless, the effect of Sun + CO2 (+ other "second-order effects") - similar to today!
How? Something does “not fit” in these "simple calculations" ...
The concentration of CO2 in the atmosphere - especially his change - had to be bigger than it used to show the cores. I would suggest to "throw away" data by ice core CO2 (and those by cores from the bottom of the ocean - as well). I propose to also adopt the proposed by me - many times here - the deep ocean CO2 + higher sensitivity of soil (respiration) on temperature ...
I recall the most recent reference is apropos of the latter: Suseela et al., 2010.: “Soil respiration is the largest flux of carbon dioxide to the atmosphere, releasing more [several times - 98 +/- 12 PgC / 8-9 Pg C ] carbon than fossil fuel combustion.” “... even a small warming-induced increase in carbon dioxide emission from soils could act as a positive feedback to climate change.”
Karhu et al. 2010.: “Compared to the method used for current global estimates (temperature sensitivity of all SOC equal to that of the total heterotrophic soil respiration), the soils studied will lose 30-45% more carbon in response to climate warming ...”
Dorrepaal et al., 2009.: “Climate warming therefore accelerates respiration of the extensive, subsurface carbon reservoirs in peatlands to a much larger extent than was previously thought ...”
The steady increase in "strength "of the sun for a long time = constant small increase in temperature = increase in soil respiration + deep ocean - for example by upwelling = 80-90% current rise in CO2 + other effects of second order = continued increase in the temperature ...
The stronger the sun is the increase in volcanic activity - a decrease of ozone in the stratosphere - the reduction in marine algae (possibly caused also by warming) - the increase in frequency of El Nino - another feedback causing a natural increase in CO2 ... - It warmed just as fast in 1860-1880 and 1910-1940
KR at 06:28 AM on 14 April, 2011
Adam - Blaming Arctic temperatures on the sun should be carried to the appropriate It's the sun thread:

Soon is not known for his quality of science, and appears to have neglected the last 30 years of data in his graph.
See again the CO2 is not the only driver of climate thread: by asserting that CO2 (and CO2 forcings only) don't match the temperature record, you're really pushing a Strawman argument. CO2 is part of the picture, not all of it, but it's become the dominant changing forcing causing recent warming. - Pre-1940 Warming Causes and Logic
ranyl at 03:16 AM on 24 March, 2011
Interesting if complex discussion.
It strikes me that looking at the NH (not global) reconstructions being posted, that there is a clear..ish 1000year cycle going on, with the peak of the lastest warm period at about 1900-1980, this is unlikely to be due to the changes in the sun's intensity as this it appears from the above this might have very little affect unless significantly amplified by another factor for which there is little to no definitive evidence. That leaves us ocean current changes for the warming from 1900-1940, plus the other factors listed in the blog post (human, low volcanoes, a little sun etc) which all tend to exaggerate the effect.
After 1940's matters become complex as sulphur emissions rapidly rise to cause a cooling particularly in the NH, so natural variation is now altered by increasing CO2 and sulphur emissions, balancing each other to a degree and producing a period of limited variance and a mild cooling trend as would be in keeping with the 1000yr cycle. Also of course there is the longer cycle of precession causing a longer term cooling to the NH.
So it seems that natural warming to MWP levels in the NH should have been expected for the 1800-190o.
The worrying aspects are that the CO2 additions bit likley add some to pre-1940 warming, however since then for 30-40years, therefore until 1980 CO2 warming was masked by SO2 cooling, which means that the recent warming after 1980 is primarily the earth coming into equilibrium with with the CO2 rise until then, i.e. ~335ppm, we added another 60ppm in 30 years, and all that heating is about to realised, and keep in mind a significant amount of that warming is being masked by SO2 from India and CHina still.
No wonder the CS from the past is so much higher, they didn't have any coal powered stations to mask it with SO2 for such a long period of time.
CS is a difficult beast and has to be totally dependent on initial conditions (why CS to CO2 can be masked with a radiative blocker in the air, or reduced if there is less ice to melt!) and also prone to hystersis type changes as ice burdens rise and fall, snowball to greenhouse and full glacial to inter-glacial, from inter-glacial 100,000yr to inter-glacial 41,000yr, to NH ice free, to whole globe ice free. There is no way CS to a release of CO2 is the same during all these periods and why values for it vary from 1.5-12C or more.
Where is CS now?
Not sure but at present there potential of a large and rapid albedo accelerant the Arctic ocean, and warming this will not only affect the arctic it will influence weather patterns and ocean currents world wide. There is also the permafrost and the Greenland and WAIS ice sheets to consider meaning CS at present has a large very sudden albedo change potential and several large geologiclaly fast albedo changes to come, meaning CS under these initial conditions is very unlikely to be low, indeed if Pliocene records are right, then an equilibrium CS of 7.5-12-5C is very likely which 4.5C per 100years doubling is the lower limit of CS not the highest.
So the warming episode of 1900-1940 seems natural yet amplified by CO2 to a small degree, then CO2 effects are masked until mid-1980's and then its take off to a new climatic paradigm for the earth, the choice that needs to be made is how to prevent that climatic shift coming from being too large for even informed planned adaptations to be effective? - Crux of a Core, Part 2 - Addressing Dr. Bob Carter
Icarus at 12:05 PM on 9 March, 2011
My review of the first few minutes of that video went like this:
Professor Carter gets off to a bad start by asking "is the climate warming?" in the context of the last 16,000 years. No-one is suggesting that anthropogenic global warming was occurring 16,000 years ago, so this is a pointless diversion from the question of whether the planet is warming today, as a result of anthropogenic greenhouse gas emissions since the start of the industrial revolution, approximately 250 years ago.
Then he looks at the last 10,000 years - same problem.
Then he looks at the last 2,000 years - same problem again.
Then he looks at the last 700 years - same problem again.
Finally he looks at the last 100 years and acknowledges that in the only timescale that matters for anthropogenic influences, yes the global climate is warming.
Does this sound like an unbiased and honest approach so far? Indeed not. Any reasonable person with a little understanding of climate science would already be suspecting an attempt to deceive the uninitiated.
It gets worse. The professor then cites the last 8 years of temperature 'stasis', clearly implying that anthropogenic global warming should be a continuous, monotonic process which erases all natural interannual variability in global temperature, and that any failure of each year to be warmer than the preceding year must be a refutation of anthropogenic global warming. Well, anyone who knows anything about climate knows that the oceans continue to circulate, the sun continues its regular ~11-year cycle of varying irradiance and so on. It's simply a nonsense to imply that these things are going to cease to exist just because human activity is causing long-term global warming, and Professor Carter knows this, so already (only 5 minutes into the first video) we know for certain that his intention is to deceive, not to present an honest assessment of the topic.
His next point is to say that 100 years is "too short a period of time over the dataset" to be statistically significant, but this again is nonsense - climate scientists work with 30 years of data on the basis that this is a long enough period for long-term global temperature trends to be distinguishable from natural interannual variability. 100 years is certainly long enough and the professor knows it - again, an attempt to deceive.
He continues by pointing out other places in the 2,000-year record where global temperature rise is comparable in rate and magnitude to the rise of the last century. What is the significance of this? No-one is arguing that the climate never changed before as a result of natural forcings, so this has no bearing on whether or not human activity is causing warming now, as a result of greenhouse gas emissions. Another red herring. Nor does the current warming have to exceed previous warmings in either rate or magnitude in order to be anthropogenic.
The professor says "Is warming happening? It depends". Well, no, it doesn't depend - warming *is* happening on the only timescale that is significant for the issue of *anthropogenic* influences, i.e. since the start of the industrial revolution. The intention is clearly to mislead the audience.
The next illustration displayed by the professor shows the last 5,000 years or so, highlighting previous warm periods. He says "there is nothing unusual about the late 20th Century warm period", as if comparing the rate or magnitude of recent warming to past climate changes is enough to confirm or refute its anthropogenic origin - it isn't. Nothing about past climate changes has any bearing on whether or not we are causing the current warming - it only has relevance for the *consequences* of that warming, how easily we will cope with it and so on.
The professor actually claims that "it's not going to get warmer next, it's going to get colder", on the basis that it has been colder in the past (during the several ice ages of the last 400,000 years), but in making this claim he completely ignores the fact that human activity has dramatically increased the atmospheric concentration of global warming gases and that this will inevitably continue for decades to come.
I could go on, but really we've seen more than enough already. Professor Carter is clearly only interested in hoodwinking his audience by presenting them with arguments which he knows are misdirections, because he knows that all the palaeoclimate he is presenting has no bearing whatsoever on the issue of recent anthropogenic warming.
[Note: I haven't attempted to 'tone down' my review of Carter's shoddy video - I hope it's acceptable here] - Climate Emergency: Time to Slam on the Brakes
MarkR at 21:31 PM on 8 March, 2011
"I wonder if SkS should switch entirely to how we move public opinion and therefore the politicians? The scientific case is iron-clad (despite the protestations of a few posters)."
I completely disagree with that... Very few sites provide SkS' level of analysis with such accessibility. IMO SkS is about using the scientific method to cut through the rubbish.
That's been done very well for the physical science: SkS has clearly pointed out that it's not the Sun causing global warming, but on the other hand that 7 metres of sea level rise isn't going to happen tomorrow.
In terms of actions, it's a lot harder. But taking the approach of explaining the effects of different policies based on peer reviewed work so that those with a political bent can make informed decisions is where SkS should be IMO.
That's what James' article here is about: explaining the evidence behind claims of climate sensitivity and why this should be factored into any risk analysis for the future. - Dispelling two myths about the tropospheric hot spot
Tom Curtis at 17:42 PM on 27 February, 2011
Albatross, I'm happy to give you my thoughts as a layman, but I have exactly zero expertise in this area, so I don't know how much help that will be. I was interested, however, to note that the articles you linked to tended to confirm my initial thinking on the topic. Here goes:
The key aspect of a thunderstorm is the updraft driven by the latent heat of condensation. Clearly, the warmer the air below, and the cooler the air above, the easier it is to generate and sustain the updraft.
The key difference between aerosols from wood fires (and coal fires without scrubbers) is that its major component is black soot. Because it is black, it absorbs solar radiation warming the air around it, but cooling the air beneath it. In this it contrasts with sulfates, dust and salt which reflect sunlight, cooling both the air around it and below (but warming the air above it). This means that absorbing aerosols will tend to warm the air immediately above the cumulus layer, and cool the air in the cumulus layer, thus forming a barrier against the formation of updrafts. In contrast, reflecting aerosols will cool both layers equally with no resulting consequence for the ability to form updrafts.
Both types of aerosols will act as cloud condensation nuclei, thus causing water to precipitate out slower. Your second reference says this will encourage thunderstorms at low concentrations, and your third says it will encourage it at low concentrations, but cause the clouds to evaporate too soon at high concentrations (because of increased surface area of the smaller drops). That makes sense to me, but carries me further than I can be sure logic won't lead us astray.
So, based on that, I would say the key difference is the type (absorbing or reflecting) or aerosols that dominate in forest fire smoke or over the North Atlantic. In that respect, India's aerosols have a very high black carbon content for anthropogenic aerosols (about 25%) because so much of it is caused by cooking fires. China does not, because of the use of high sulfate fuels (like Australian coal).
Would this effect the hot spot? I don't know. Most sulfates precipitate out within few weeks or origin, particularly black carbon. Because of that, most of the impact of sulfates is regional. But, about 1% of sulfates enter the stratosphere where they can take years to precipitate out and have global effect. That means neither Indian nor Chinese aerosols would be particularly prevalent in the tropics. On the other hand, forest fires in the Amazon, Indonesia and equatorial Africa have become prevalent and may have the effect you describe.
As to the Hot Spot itself, evidence at the moment favours its not existing, but theory strongly favours its existance. Whether observations come to the rescue of theory or not, who knows?
I don't think it is that important anyway. After all, solar forcings (and reduced cloud or aerosol albedo forings) predict a stronger hot spot than do green house forcings because they have a stronger effect in the tropics. So, to the extent that a missing hot spot is a problem for AGW, it is more of a problem for its competitors. Further, a missing hot spot may mean a weaker water vapour feedback, but it certainly means a weaker lapse rate feedback (it is after all, just the consequence of the lapse rate feedback). That means a missing hot spot is not likely to result in significant changes in estimates of climate sensitivity, and certainly won't change those based on paleoclimatology. Consequently, my feeling is that the issue is technically interesting, but almost irrelevant in terms of policy considerations.
Finally, the missing hot pot is probably down to a hungry thief. (Sorry, couldn't resist.) - It warmed just as fast in 1860-1880 and 1910-1940
Bibliovermis at 10:24 AM on 17 February, 2011
expect a bigger change between the second and third rates if we'd added something to this experiment
Ceteris paribus. ("All other things being equal or held constant.")
Solar activity was not identical so such a direct comparison is not applicable. Solar activity was decreasing during the period 1975-2005 and increasing during the period 1910-1940, except 1920-1930 (roughly rounded).
Solar activity & climate: is the sun causing global warming? - Monckton Myth #10: Warming in the Pipeline
muoncounter at 02:00 AM on 13 February, 2011
#15: "To simply ignore the effects of solar... "
No one is ignoring the effects of solar (where did I hear that before?) See How we know the sun isn't or any of the threads that show all the forcings are used in warming calculations.
"As always, a little reading and research shows that climate scientists aren't ignoring these obvious questions." - It's cooling
MJ Liberto at 00:14 AM on 21 January, 2011
I am very curious to understand why the effects of the sun are not calculated into the global warming scenario. Our sun is already middle aged and will eventually fry the earth if science does not find a way to distance them. Shouldn't all factors be taken into consideration when looking for an accurate analysis and figures on what is causing the earth and its oceans to warm?
More than 100 comments found. Only the most recent 100 have been displayed.
More than 100 comments found. Only the most recent 100 have been displayed.


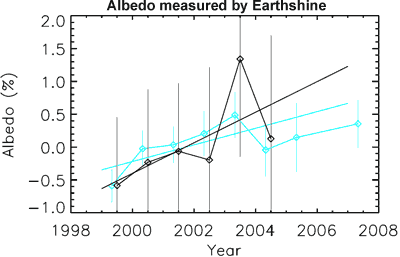
THE ESCALATOR

(free to republish)