Climate Science Glossary

Term Lookup

Enter a term in the search box to find its definition.

Settings

Use the controls in the far right panel to increase or decrease the number of terms automatically displayed (or to completely turn that feature off).

Term Lookup

Settings


All IPCC definitions taken from Climate Change 2007: The Physical Science Basis. Working Group I Contribution to the Fourth Assessment Report of the Intergovernmental Panel on Climate Change, Annex I, Glossary, pp. 941-954. Cambridge University Press.

Home Arguments Software Resources Comments The Consensus Project Translations About Support

Bluesky Facebook LinkedIn Mastodon MeWe

Twitter YouTube RSS Posts RSS Comments Email Subscribe


Climate's changed before
It's the sun
It's not bad
There is no consensus
It's cooling
Models are unreliable
Temp record is unreliable
Animals and plants can adapt
It hasn't warmed since 1998
Antarctica is gaining ice
View All Arguments...


Username
Password
New? Register here
Forgot your password?

Latest Posts

Archives

What has global warming done since 1998?

What the science says...

Select a level... Basic Intermediate

Every part of the Earth's climate system has continued warming since 1998, with the ten record temperature years all occurring since 2010.

Climate Myth...

It hasn't warmed since 1998

For the years 1998-2005, temperature did not increase. This period coincides with society's continued pumping of more CO2 into the atmosphere. (Bob Carter)

At a glance

This date-specific talking-point is now something of a historical curiosity, but we'll leave it in the database for now because it's such a good illustration of the simplistic yet reckless mindset of the serial climate change misinformer. And indeed, we could (out of sheer mischief) have revised this myth by replacing "1998" with "2016". In fact, that's what we started to see in the climate change misinformation stream, © the Usual Suspects. But 2023's record temperatures put a stop to that.

Anyway, as first predicted over a century ago, Earth's surface, oceans and atmosphere are all heating up. That's due to our increasing greenhouse gas emissions, but over the years the warming has occurred at varying rates. This should in no way come as a surprise. Other physical phenomena periodically act either to suppress or enhance temperatures.

A prime example of such a phenomenon is the effects of La Nina and El Nino. This natural climatic oscillation features variations in winds and sea surface temperatures over the tropical eastern Pacific Ocean. The cycle can at times strongly influence temperature and rainfall patterns right around the world.

In a La Nina year, temperatures are suppressed, whereas an El Nino year sees them enhanced. This is noise on the long-term upward trend. That's why climatologists work with multiple decades, not just a few years in isolation, in order to get a grasp on what is going on.

The year 1998 featured a massive El Nino. The temperature spike it caused was a huge outlier, like a pinnacle towering over the landscape of the temperature record. In the following years there was a return to more typical conditions, with an erratic but upward warming pattern. That sequence of events gave deniers a brief opportunity to insist that global warming had “paused” or had even stopped.

You only need to remember one thing here. Those who create and spread misinformation about climate change don't care about reality. Public confusion is their aim. In this instance, the misinformation exercise involved deliberately selecting a limited block of years starting with the massive El Nino of 1998 and using that very warm starting-point to insist that global warming had stopped. They knew this would likely work for a few years and that the public would quickly forget why that was the case. Mother Nature had handed them a gift. It was an irresistible bunch of low-hanging fruit to exploit: little wonder the tactic is known as 'cherry-picking'.

Talking about reality, what actually happened? Well, as of 2024, a couple of decades down the line, the top ten warmest years have all been since 2010, whatever observation-based dataset you choose, with eight of them being in the 2015-2023 period. 1998 is nowhere to be seen any more. By modern standards, it simply wasn't warm enough.

Please use this form to provide feedback about this new "At a glance" section, which was updated on May 27, 2023 to improve its readability. Read a more technical version below or dig deeper via the tabs above!


Further details

Even if we ignore long term trends (something deniers often do in order to make a point) and just look at the record-breakers, as of early 2024 the top ten warmest years have all been since 2010, whatever dataset you choose, with eight of them being in the 2015-2023 period. In this top ten grouping, 1998 is nowhere to be seen any more. It was not warm enough.

The myth of no warming since 1998 was largely based on the satellite record estimates of the temperature of the atmosphere.  However, as discussed in the video below by Peter Sinclair, even that argument is no longer accurate.  The satellites show warming since 1998 too.

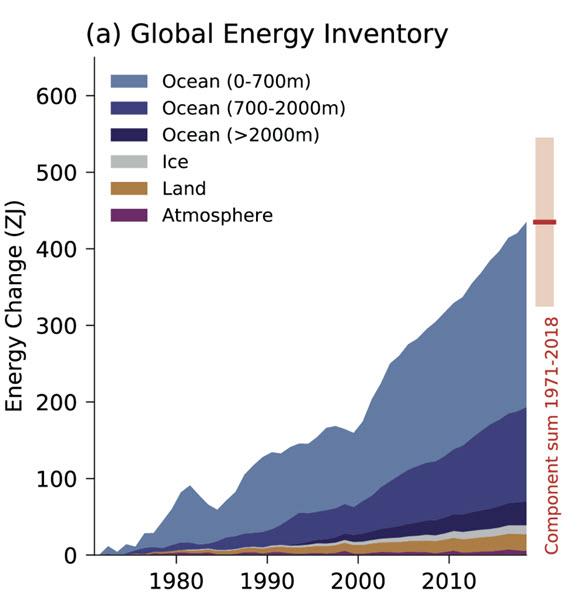
There's also a tendency for some people just to concentrate on atmospheric or surface air temperatures when there are other, more useful, indicators that can give us a better idea how rapidly the world is warming. More than 90% of global warming heat goes into warming the oceans, while less than 3% goes into increasing the atmospheric and surface air temperature.  Records show that the Earth has been warming at a steady rate before and since 1998 and there is no sign of it slowing any time soon (Figure 1). 

Fig 1

Figure 1:  Global Energy Inventory: observed changes in the global energy inventory for 1971–2018 (shaded time series) with component contributions as indicated in the figure legend. Cross-Chapter Box 9.1 Figure 1 (part a) - From IPCC AR6 WGI Chapter 9.

Even if we focus exclusively on global surface temperatures, Cowtan & Way (2013) shows that when we account for temperatures across the entire globe (including the Arctic, which is the part of the planet warming fastest), the global surface warming trend for 1997–2015 is approximately 0.14°C per decade.

Ultimately, every part of the Earth's climate system is warming, and has continued warming since 1998.

Last updated on 8 March 2024 by John Mason. View Archives

Printable Version  |  Offline PDF Version  |  Link to this page

Argument Feedback

Please use this form to let us know about suggested updates to this rebuttal.

Further reading

Tamino further explores the warming trend since 1998 in Garbage is Forever and Wiggles.

I've kept my original treatment of the subject as other websites hotlink to the images. My original treatment uses similar arguments to Fawcett and Jones 2008 although their analysis is much more rigorous (as you'd expect in a peer-reviewed paper).

Further viewing

Fact brief

Click the thumbnail for the concise fact brief version created in collaboration with Gigafact:

fact brief

Comments

Prev  1  2  3  

Comments 51 to 64 out of 64:

  1. Jeffomatic, well, i wouldn't say that the oceans are not storing heat; look at the response to comment #40. And I would not say that "temperature is not showing it" either; see for example fig. 4 in this post or here if you like statistics more. Although we all may agree with Trenberth that "it's a travesty" that we can not track the details of the heat flow through the climate system, neverthless we can see that more heat is here.
  2. Jeffomatic writes: In fact, it's April 04, 32 F. outside and snowing right now! That kind of anecdote is not particularly useful. On the same date here in northern New England (where there's normally still snow on the ground at this point) it was in the mid-70s F (after having been an astounding 83 F the previous day).
  3. A number of people make comments about the Earth heating up without considering the massive thermal capacity of the Earth. In the following example I have exaggerated in every possible way to see what is required to raise the temperature of the planet by just one degree. I have used a very simple model of the Earth made of uniform material with reasonable conductivity If the Earth absorbed all the Suns radiation that landed on it and absolutely no heat ever escaped. How long would it take for the temperature to rise by 1 degree centigrade. Formula used Pxt =cm(temperature rise) P=1367W/m2x(crosssectional area of Earth) t =time in seconds C = specific heat capacity = 1000 (you can tweek this number if you like) m = Mass of Earth =6×10power24 When calculated it turns out to be 1080 years.
  4. how many degrees has the ocean's surface temperature risen by since 1950?
  5. amymarshall95 asks "how many degrees has the ocean's surface temperature risen by since 1950? " The US agency NOAA has data on sea surface temperatures here. For the most recent 12 months (May 2009-April 2010) they averaged 0.54 C above normal. For the 12 months of 1950, they averaged -0.09 C below normal. So SST has risen by about 0.6 C since 1950. Kelly O'Day has a very nice website with R scripts for analyzing climate data. Here's Kelly's example of a script for plotting historical SST data:
  6. suibhne writes: "A number of people make comments about the Earth heating up without considering the massive thermal capacity of the Earth. [...] I have used a very simple model of the Earth made of uniform material with reasonable conductivity If the Earth absorbed all the Suns radiation that landed on it and absolutely no heat ever escaped. How long would it take for the temperature to rise by 1 degree centigrade." Aha! Perhaps this explains why you've found the concept of AGW so difficult to accept. If you were under the misapprehension that the entire mass of the earth had to change temperature at a uniform rate, then of course it would be impossible for humans to raise the planet's temperature by 2-6 degrees C. Of course, in that model, the glacial/interglacial cycles, and shorter-term temperature fluctuations like the Younger Dryas, MWP, and LIA would never have happened, either. The earth's temperature would have to be effectively constant over time. So that's an indication that you might be misunderstanding something, right? So, here's a question for you, suibhne: where do you think the error is in your assumptions? You might also want to think about what happens when you cook a turkey in your oven. Does it cook at a uniform rate all the way through, or does it cook more rapidly on the outside and more slowly on the inside?
  7. I think John Cook and Peter Sinclair's contribution to communicating climate science to the educated layman has been indispensable. However, there comes a point of diminishing returns where the best mode of communication to the remainder of the public might not be an entirely rational one. Politicians have realised since time immemorial that mindless rhetoric and appeals to the core values and fears of the people are far more effective than hard facts. Deniers understand this better than the 'good guys' and it may be necessary to take the gloves off to reach the multitude of people. So perhaps the best way to communicate with these people is not by explaining climate change in technical terms, but to emphasise the effect of climate of migration patterns, the increased chance of their beach residence being flooded by increased storm intensity and to emphasise our need for energy security with the onset of peak oil.
  8. 304 is the number of consecutive months we have now had with temperatures greater than the mean for the 20th Century. Thats every month in the last 25 years. Every single year from 2001 onwards has been warmer than every year prior to 1998. According to the NOAA, May 2010 was the hottest May on record. Also: June was the hottest on record July was the hottest on record new records this year for: The warmest March and the warmest April The warmest January to April period The warmest January to May period The warmest March to May period The warmest Jan through June period Warmest 13 month.......................... . The NSIDC gives us the latest Arctic sea ice maximum on record (March), and The rate of Arctic sea ice decline through the month of May was the fastest in the satellite record. 2005 had (by far) the lowest Arctic sea ice extent on record at the time. It is now the 4th lowest (and likely to become 5th this year) 1997 was (at the time) the warmest year on record. It is now 12th. http://greenfyre.wordpress.com/2010/07/06/303/
  9. Phil Jones NEVER said that there had been no warming since 1995; He only said that 15 years was too short a time span to have 95% statistical certainty for the warming trendline. It was actually 92%+ statistically significant. If you ask the same question, starting with 1994 instead of 1995, you get 95% statistical certainty. And that number is more or less arbitrary as a benchmark, anyway.
  10. "Of satellites and temperatures Guest post by Ned There are a variety of rumors floating around the "skeptic" blogosphere involving claimed problems with satellite temperature measurements. Unfortunately, there is a great deal of confusion on this point." http://www.skepticalscience.com/news.php?n=307 "Global Warming has stopped" video good clear debunking of this meme http://www.fool-me-once.com/2010/07/global-warming-has-stopped.html Global cooling -"3 levels of cherry picking in a single argument" http://www.skepticalscience.com/news.php?n=270
  11. Mizimi @ 15 "If that trend continues in a linear fashion, then by 2108 the GMT will be 15.8C assuming all other things remain equal. Not impressed" Why not? Thats well within projections of climate scientists. If the global mean temp is now 14C, and we have already increased temp by 1C in industrial times, and you add your 1.8C difference to that, you get 2.8C change since the industrial revolution. In addition, you are assuming constant rate of CO2 emissions. Without mitigation efforts, CO2 emissions will increase over the coming decades. Current projections for global temp rise average about 3C and within a range of 2-5C . The lower end are conservative estimates. We will likely see 2C even with mitigation efforts. These projections do not take into account any amplification from releasing of methane from melting Tundra or the seabed. We are now experiencing the warming and climate change from emissions of 30 years ago. You haven't seen the effects of our current emissions yet. 2.8C change in GMT will bring catastrophic climate change. At 1C change, the glaciers, ice caps and sea ice are already melting, seasons and weather have changed and extreme weather is increasingly frequent, to name just a few observable signs of global warming that is already upon us. 1000 year heat wave in Russia is a sign of how the climate is changing. No you can't attribute any weather event to climate change, but these extremes are more frequent. The last decade had twice as many record highs as record low temperatures. The record high to record low ratio has been increasing for three decades in a row.
  12. I don't know if Bob Carter would be high on my list of good sources of climate information. "Climate scientists continue to respond to badly flawed, politically driven, papers by those who deny the strong evidence for humans affecting climate in ways that portend major future disruptions". "Such papers have confused the public debate, but increasingly scientists are stepping up to provide strong refutations. Last year, John McLean, Chris de Freitas and Bob Carter, published a paper in the Journal of Geophysical Research using a mathematical procedure that eliminates long term trends to claim that there is no long term trend in global temperatures." http://rabett.blogspot.com/2010/03/too-bad-to-be-believed.html "How Low can you Go?" April 3, 2010 http://tamino.wordpress.com/2010/04/03/how-low-can-you-go/ McLean, de Freitas and Carter rebutted... by McLean, de Freitas and Carter that is not clearly shown in this graph and only discovered through analysis of the original data is that the mean values of the weather balloon and satellite data during their period of overlap differ by nearly 0.2°C. Splicing them together introduces an artificial 0.2°C temperature drop at the boundary between the two. In other words, they "hide the incline". http://www.skepticalscience.com/news.php?n=171 and http://theidiottracker.blogspot.com/2010/03/idiot-of-week-bob-carter-data- pervert.html
  13. In post 61, sailrick projects temperatures based on 2 or 3 times warming feedback of water vapor on top of the increase from CO2 (sensitivity). Sailrick claims a 30 year delay of temperature rise to CO2 increases. Did the oceans expand enough over 30 years to show that kind of heat storage? Finally sailrick acknowledges that extremes are increasing. But that means that the negative feedback is already kicking in (even before it should). Catastrophic warming from water vapor feedback (multiples of 2 or 3) only works if the water vapor is evenly distributed, not concentrated so as to produce record rains.
  14. @Eric (skeptic) #63 Bear in mind that increased water vapour (leading to increased clouds and precipitation) would also be in the (generally) much bigger gaps between any clouds. Some confuse water vapour (invisible and a powerful greenhouse gas) with condensed water vapour (steam) which makes up clouds.
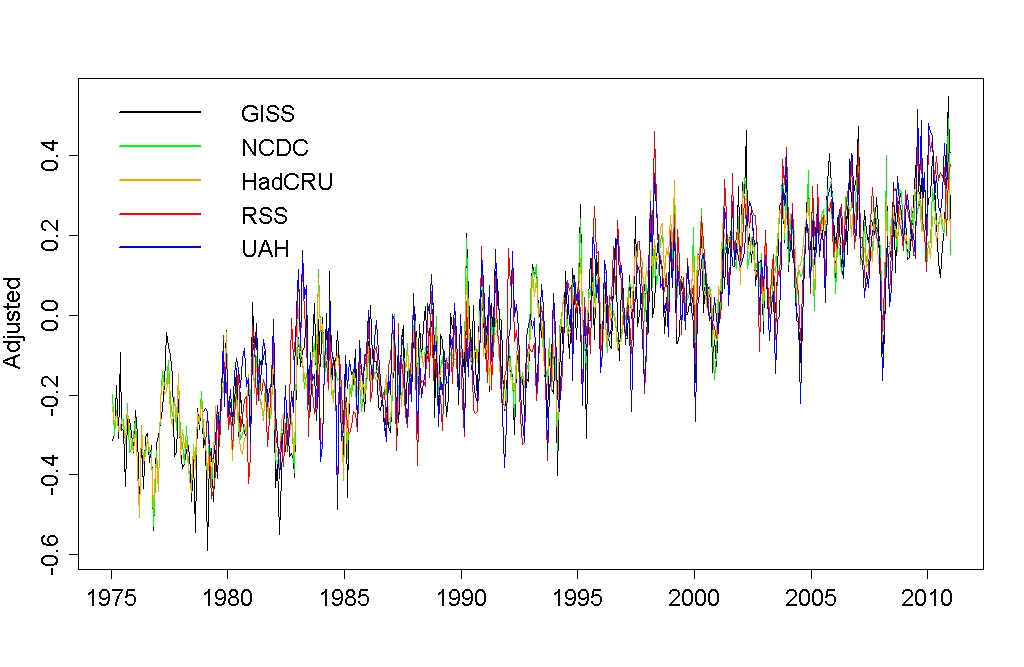
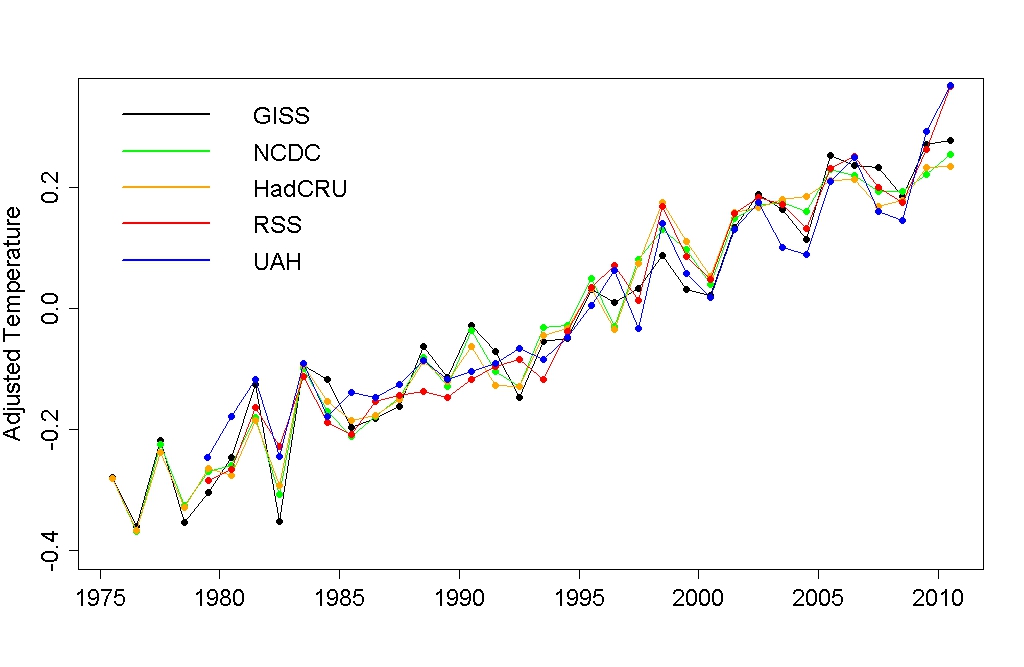
  15. This is a response to fydijkstra in another thread, where he claimed there has not been any warming since 1998. fydijkstra, there has been warming since 1998, as this graph demonstrates: Second, 1998 was an exceptionally warm year. Using it as a starting point to determine a trend is cherry-picking at its best (not to mention the fact that the time frame is too short to indicate statistical significance). In spite of this, the graphs still show modest warming. However, look at what happens if we measure trends right before or after 1998: It's clear that starting in 1998 gives an erroneous idea of the actual temperature trends, which is why contrarians like to do so. That is what we call cherry-picking.
  16. When ENSO-adjusted, why is 2006 the hottest year on record? But NASA GISS shows 2005 as the hottest year on record. Which year is the hottest 2005 or 2006?
  17. The new images here should remove any doubt that those still clinging to the 'it hasn't warmed since 1998' mantra are truly in deep denial. The above is temperature anomaly for the period 2000-2009. The clincher is the companion image, both available full scale here, which represents 1970-1979, when things were a lot bluer. Be sure to check the color scale.
  18. A really nice temp chart is here at NASA Earth Observatory
  19. I recently heard that NASA and the National Oceanic and Atmospheric Administration reported that 2010 tied with 2005 as the warmest year on record. I can't believe there hasn't been more said about this in the media, particularly with so many climate change deniers citing cold snaps in some parts of the world as being evidence of global cooling.
  20. The 'further reading' links at the top of the first page are broken: "Tamino ... Garbage is Forever and Wiggles." If they've been recovered can you update the pointer?
    Response: [Daniel Bailey] Garbage is Forever can be found here while Wiggles can be found here. A compendium of recovered Open Mind posts from Tamino thought lost can be found here.
  21. "2005 was the hottest year globally, and 2009 the second hottest." According to majority 1998 was warmest on record (Hadley, RSS, UAH) and 2005 not even close. 2010 was the second warmest and tied only in UAH. GISS record years are just artifacts due to homogenization and unjustified interpolation. Again, "Skeptical" Science does cherry picking and pickes the only dataset which shows any warming on this ENSO-neutral interval which is 1998-2010.
    Response: [DB] Incorrect. According to the WMO, which uses data from NASA,NOAA/NCDC and MET/UEA, the year 2010 was jointly ranked with 2005 and 1998 as the warmest year on record. Hansen 2011 indicate we have reached the levels of the Holocene Maximum/Altithermal. Removing ENSO and other exogenous factors from the records yields (using monthly averages) this, from Tamino: And now this, using annual averages:
  22. protestant, you need to look at Monckton Myth #2: Temperature records, trends and El Nino to learn more about the different datasets and how global their coverage is. You also need to look at Are surface temperature records reliable?, before backing up your accusation of "unjustified interpolation".
  23. protestant, I notice you still haven't retracted or backed-up your accusation of "unjustified interpolation", so, to help you out, please look at the following comment. You can reply there to retract or back-up your accusation.
  24. GISS record years are just artifacts due to homogenization and unjustified interpolation. Again, "Skeptical" Science does cherry picking and pickes the only dataset which shows any warming on this ENSO-neutral interval which is 1998-2010. As far as I can see, every statement in here is incorrect. If you are going to make a claim like this, then please present data to support it. This appears to be channelling of some pseudo-skeptic site (like other of your posts). Tell me, how many articles on such site would we have to refute before you realized that you were being suckered and stopped reading it? I'm curious.
  25. In my opinion, the evidence is just not there and more data is needed. For example, scientists have always led us to believe that tree rings are a sign of global warming as they represent temperature changes over the years. Yet there is simply no evidence to support this! It is caused by Lunar Cycles and Solar Flares (of which there is to be the largest one on Monday night). For anyone else who is interested in this kind of thing, I would suggest this website: http://blindedbyscience.co.uk It's an informative read for skeptics and anyone, like me, who questions what we are told about climate change and global warming.
    Response: [Daniel Bailey] Welcome to Skeptical Science! There is an immense amount of reference material discussed here and it can be a bit difficult at first to find an answer to your questions. That's why we recommend that Newcomers, Start Here and then learn The Big Picture. I also recommend watching this video on why CO2 is the biggest climate control knob in Earth's history. Further general questions can usually be be answered by first using the Search function in the upper left of every Skeptical Science page to see if there is already a post on it (given the plethora of posts [I get paid extra for using big words and alliteration :-) ] odds are, there is). Or you can search by Taxonomy. If you still have questions, post them on the most appropriate thread & someone will attempt to help you. Please adhere to the Comments Policy when composing your comments and remember to use the Preview function before submitting. I'm afraid the vast majority of your comment is simply incorrect. The warming of the globe is an accepted fact. That humans are causing a good part of it is accepted at over a 90% scientific certainty level.

Prev  1  2  3  

Post a Comment

Political, off-topic or ad hominem comments will be deleted. Comments Policy...

You need to be logged in to post a comment. Login via the left margin or if you're new, register here.

Link to this page


The Consensus Project Website

THE ESCALATOR

(free to republish)


© Copyright 2024 John Cook
Home | Translations | About Us | Privacy | Contact Us