Climate Science Glossary

Term Lookup

Enter a term in the search box to find its definition.

Settings

Use the controls in the far right panel to increase or decrease the number of terms automatically displayed (or to completely turn that feature off).

Term Lookup

Settings


All IPCC definitions taken from Climate Change 2007: The Physical Science Basis. Working Group I Contribution to the Fourth Assessment Report of the Intergovernmental Panel on Climate Change, Annex I, Glossary, pp. 941-954. Cambridge University Press.

Home Arguments Software Resources Comments The Consensus Project Translations About Support

Bluesky Facebook LinkedIn Mastodon MeWe

Twitter YouTube RSS Posts RSS Comments Email Subscribe


Climate's changed before
It's the sun
It's not bad
There is no consensus
It's cooling
Models are unreliable
Temp record is unreliable
Animals and plants can adapt
It hasn't warmed since 1998
Antarctica is gaining ice
View All Arguments...


Username
Password
New? Register here
Forgot your password?

Latest Posts

Archives

Does cold weather disprove global warming?

What the science says...

Select a level... Basic Intermediate

A local cold day has nothing to do with the long-term trend of increasing global temperatures.

Climate Myth...

It's freaking cold!

"Austria is today seeing its earliest snowfall in history with 30 to 40 centimetres already predicted in the mountains. Such dramatic falls in temperatures provide superficial evidence for those who doubt that the world is threatened by climate change." (Mail Online)

At a glance

Late November-early December 2010 saw a memorable, bitterly cold snap in the UK that many residents will still remember. According to the UK Met Office on the night of November 27-28:

"Last night saw November minimum temperature records fall across the country. Most notably both Wales and Northern Ireland recorded the coldest November night since records began. In Wales, temperatures fell to -18 °C at Llysdinam, near Llandrindod Wells, Powys. Northern Ireland recorded -9.5 °C at Lough Fea. Scotland recorded a minimum temperature of -15.3 °C at Loch Glascarnoch, whilst England recorded -13.5 °C at Topcliffe in North Yorkshire."

Brr! But it pays to have a bit of a look around. Did you know that during the very same night, parts of Western Greenland hit plus 13 Celsius? That's more than 30 degrees Celsius warmer than Wales!

The reason for that remarkable difference in temperature was the weather. An elongated and slow-moving area of high pressure was situated in the North Atlantic, extending up into the Arctic. As a consequence, because air flows around high pressure systems in a clockwise direction, on the high's left flank warm air was being dragged up into normally chilly Western Greenland. But down its right flank there came cold Arctic air, surging southwards towards Europe, hence those unusually low temperatures.

It's easy to confuse current weather events with long-term climate trends. It's a bit like being at the beach, trying to figure out if the tide is rising or falling just by watching two or three individual waves roll in and out. The slow change of the tide is masked by the constant churning of the waves. Watch for 20-30 minutes and you should get a much better idea.

In a similar way, the normal ups and downs of local weather can often mask slow changes in global climate. To find climate trends you need to look at how weather is changing over a longer time span. Looking at high and low temperature data from recent decades shows that new record highs occur nearly twice as often as new record lows. New records for cold weather will continue to be set (although that -18C for Wales in November 2010 will take some beating), but global warming's gradual influence will make them increasingly rare.

Please use this form to provide feedback about this new "At a glance" section. Read a more technical version below or dig deeper via the tabs above!


Further details

Since the mid 1970s, global temperatures have been warming at around 0.2°C per decade. However, weather imposes its own dramatic ups and downs over the long term trend. Hence the contrasting example given above where temperatures on a late November 2010 night were 30C apart in Western Greenland and Wales - and not in the geographical order one would naturally expect!

Record cold temperatures can thus occur even as global average temperatures continue to rise. Nevertheless, who hasn't heard someone on a cold day mutter, "what happened to global warming?!" Americans in particular will recall the snowball-waving stunt by former senator and conspiracy theorist James Inhofe on the floor of the U.S. Senate in February 2015. This is the childish level of debate that we often have to put up with.

But it's human nature to remember unusual events such as record heat waves and freezing cold spells. Mentally calculating long term statistical trends doesn't come quite as easy as recalling that cold morning a few winters ago or that sweltering heat wave last summer. However, we can learn something about climate trends from those record hot and cold days.

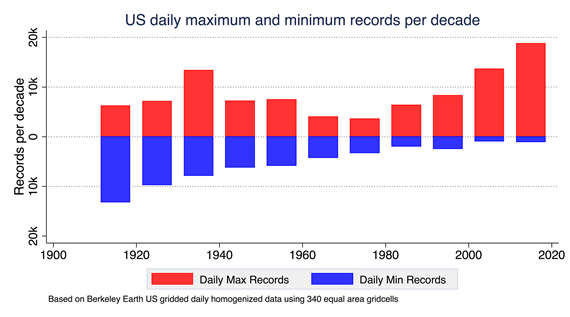
A record daily high or low temperature means that the temperature was warmer or colder on that particular day than on the same date throughout a weather station's history. In a world with no overall temperature trend, as time passes, the number of record high and low temperatures would tend to diminish. This is because as the years roll on and records accumulate, it becomes increasingly difficult to break a record. But we live in a warming world. An abstract presented at a conference a few years ago (Hausfather et al. 2021) examined record high and low U.S. temperatures since 1910. Figure 1 shows the number of record high temperatures (red bars) and record low temperatures (blue bars). If temperatures weren't warming, we would expect the number of record highs and lows to be roughly equal. Instead, the highs and lows diverge over time with gradually more record highs than lows.

Changes in the occurrence of record-setting daily maximum (TMax) and minimum (TMin) temperatures per decade in the US.

Figure 1: Changes in the occurrence of record-setting daily maximum (TMax) and minimum (TMin) temperatures per decade in the US based on Berkeley Earth US gridded daily homogenized data using 340 equal area gridcells. (Hausfather et al. 2021, AGU Fall meeting)

To examine this further, the ratios of record highs versus record lows were calculated for each year. During the 1960s, there were more record lows than highs. However, when the global warming period began in the 1970s, the ratio of highs to lows began to increase. Over the last decade in their dataset, daily record high temperatures occurred many times more often than record lows.

Looking ahead, Fischer et al. (2021) found that record-shattering extreme heat events were likely to be encountered more often in the coming decades. They note, however, that such drastic record-breakers would be “nearly impossible” in the absence of global warming. In an interview with Carbon Brief, the lead author stated that extremes in a changing climate are like an athlete on steroids – who suddenly breaks previous records in a step-change manner. The following year saw a UK heatwave that did precisely that, with temperature records going down like ninepins and the first 40C daytime maximum recorded from there.

So, while we can still expect cold days and even record cold days, in a warming world there's a much greater chance of daily record highs instead of lows. This tendency towards hotter days is expected to increase as global warming continues through the 21st Century.

Cartoon summary
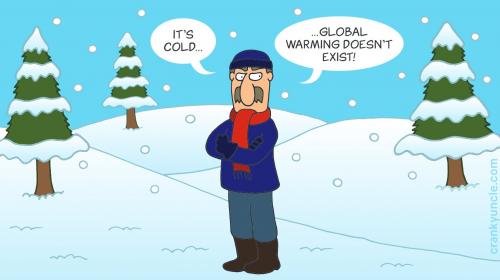
Cranky Uncle cold weather cartoon

This Cranky Uncle cartoon depicts the "Anecdote" fallacy for which the climate myth "It’s cold!" is a prime example. It uses personal experience or isolated examples instead of sound arguments or compelling evidence. It pairs up nicely with the "It's dark ... the sun doesn't exist" cartoon using the same fallacious reasoning. Please see the accompanying blog post for more information about the cartoon collection.

Last updated on 3 September 2023 by John Mason. View Archives

Printable Version  |  Offline PDF Version  |  Link to this page

Argument Feedback

Please use this form to let us know about suggested updates to this rebuttal.

Further viewing

Climate Denial Crock of the Week - "It's cold. So there's no Climate Change" (January 2009)

ClimateAdam (aka Dr. Adam Levy) has his own way to explaine why this claim is nonsensical:

Further reading

NASA explore this subject in more depth in What's the Difference Between Weather and Climate?

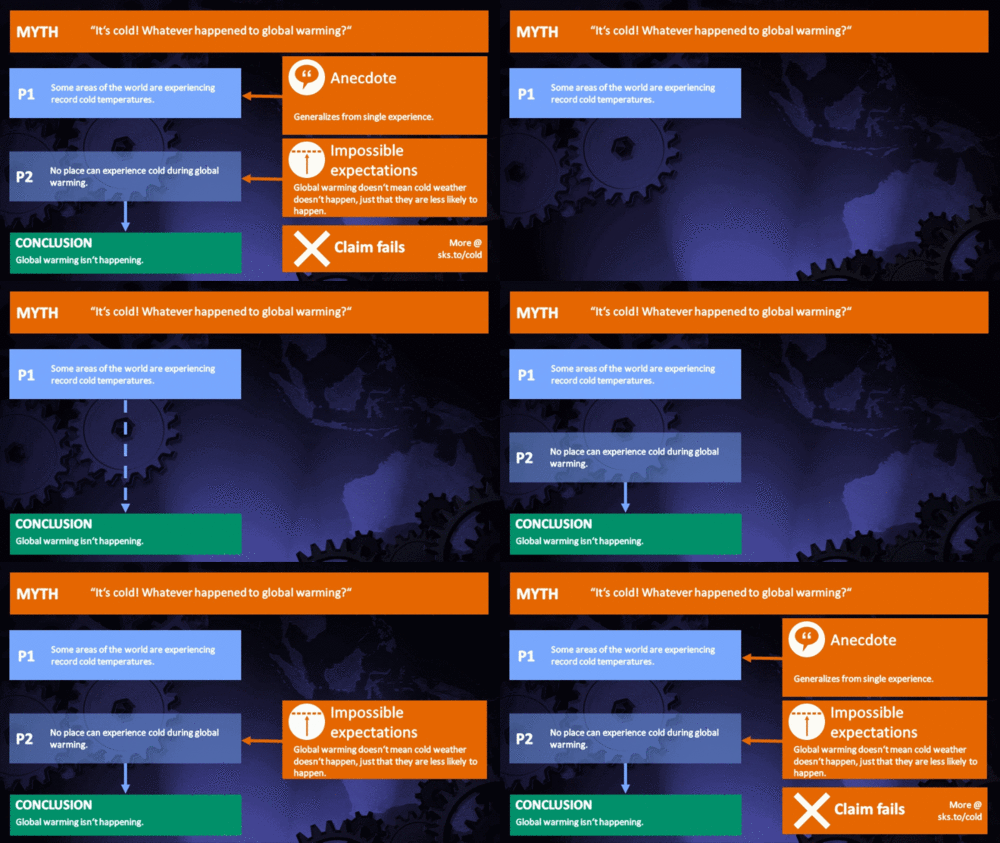
Myth Deconstruction

Related resource: Myth Deconstruction as animated GIF

MD Cold

Please check the related blog post for background information about this graphics resource.

Denial101x videos

Here are related lecture-videos from Denial101x - Making Sense of Climate Science Denial

Comments
Prev  1  2  3  4  5  

Comments 101 to 110 out of 110:

  1. Tom, 98. In looking back into the numbers (121K ago), they look like they were referring to what amounts to the last half of the interglacial as the "terminal phase." That said, this fell at the midpoint (the high point) of the interglacial. [I was confused because "terminal phase" is a term commonly used for the abrupt and extreme warming which marks the very beginning of an interglacial, but the end of a glacial period.] But the period discussed in the article was still seven thousand years before the earth had descended into the next glacial period. The melt was not the cause of the coming glacial, nor was it even a sign of an impending descent into a glacial period. It merely came at the point of peak temperatures, which also marks the beginning of the decline (which is triggered by changes in the earth's orbit, axial tilt, etc.), so the person quoted described it as a terminal period. You're interpretation of what was said is still incorrect. Melting Arctic ice is neither a cause nor a sign of impending cooling.
  2. Sphaerica, thank you for at least partially admitting your error. I do wonder though at the idea that 121,000 years ago was " seven thousand years before the earth had descended into the next glacial period." Without referencing, that appears to contradict what I recall the quite well established record suggests.
  3. The Eemian interglacial period began about 130K ago and ended 114K ago. 121K is almost dead smack in the middle of that. The article was about sea level rise. If you go find the paper, I'm sure that you'll find it was about sea level rise. You are choosing to infer some correlation between ice melt, sea level rise and the onset of a glacial period. No such correlation is stated by either the article or the study in question, so it fails to support your position that the earth is going to start cooling.
  4. Tom Loeber, as already noted, your link (and the actual paper) does not back-up your interpretation. As Sphaerica writes, the melting mentioned in the paper is not stated as causing a rapid cooling, therefore your statement that "recent evidence that melting of the caps immediately preceeded major swings of the climate into major ice age conditions is another thing suggesting that warming leads to cooling" is not true. Not only is the "evidence" not recent (the paper being nearly two years old), it merely shows that ice-sheets melt when temperatures rise, leading to a rise in sea-level. And you don't need to read the paper to know that glaciations follow inter-glacials at regular intervals.
  5. Check out this video of Joe Bastardi to see how "accurate" he is. In it he criticizes the NSIDC for inaccurate graphs of the sea ice, compared to several other graphs. The actual issue is that Bastardi cannot read the graphs and is completely wrong. Bastardi also calls the ice area "close to average" when in fact it is close to the record lowest level. The NSIDC corrected him and he apologized. Anyone who cites Bastardi as a reliable source needs to learn how to read graphs.
  6. Let's also not forget Bastardi's inability to recognize a temperature anomaly map early last year. Typing from an iPad, so I'll have to link the hard way: http://climateprogress.org/2010/03/24/accuweather-joe-bastardi-anti-science-meteorologist-sea-ice/
  7. Sorry my link has been deleted. Apparently Accuweather does not like it when they are transparently stupid. Today Bastardi is showing a temperature chart of January over the USA and claiming that it shows the globe has cooled.
  8. Thanks for linking to the paper JMurphy. I just read it "Our discovery of an ecologically sudden demise and back-stepping signature in reef-crest deposits from the Yucatan is therefore compelling evidence for a sea-level jump with a similar rise rate during the late stages of the last interglacial. This jump implies that an episode of ice-sheet instability, characterized by rapid ice loss, occurred late during an interglaciation that was warmer than present." Wanted to see that video, Michael. Perhaps you could just post a direct link to it? I don't know. Watched that video Truevoice and I don't see how your and the article's conclusions match the evidence.
  9. Well, Tom Loeber, I hope you now realise that it doesn't state what you thought it did ? More about Joe Bastardi from ClimateProgress.
  10. Interesting, JMurphy. I read that article but have yet to look at the video. I find comments 15 and the last, 36, to be most cognizant without relying on character assassination which seems to make up the gamut of the rest of the comments. Appears the reason why he is still employed as he is relies on a reputation for largely having been correct in his analyses and predictions. Should we totally discount him for some mistakes when he has largely been proven correct? Regarding that last comment, #36, I use B99 in my truck and my Mercedes that is made from waste vegetable oil. I also ride my bike as much as possible for any short commutes. I am developing a wind mill that I think will bring the cost down as well as increase the areas that are feasible for reaping electricity from the wind. After all is said and done, me thinks actions speak louder than words. I have found that many cater to the idea that words speak louder than actions, incredible as it may seem.
    Response: [muoncounter] Further off-topic excursions will be deleted.
  11. Please note: the basic version of this rebuttal has been updated on September 3, 2023 and now includes an "at a glance“ section at the top. To learn more about these updates and how you can help with evaluating their effectiveness, please check out the accompanying blog post @ https://sks.to/at-a-glance

Prev  1  2  3  4  5  

Post a Comment

Political, off-topic or ad hominem comments will be deleted. Comments Policy...

You need to be logged in to post a comment. Login via the left margin or if you're new, register here.

Link to this page


The Consensus Project Website

THE ESCALATOR

(free to republish)


© Copyright 2024 John Cook
Home | Translations | About Us | Privacy | Contact Us