


 Arguments


Is Antarctica losing or gaining ice?
What the science says...
| Select a level... |
 Basic
Basic
|
 Intermediate
| |||
|
Antarctic sea ice extent has expanded at times but is currently (2023) low. In contrast, Antarctica is losing land ice at an accelerating rate and that has serious implications for sea level rise. |
|||||
Climate Myth...
Antarctica is gaining ice
"[Ice] is expanding in much of Antarctica, contrary to the widespread public belief that global warming is melting the continental ice cap." (Greg Roberts, The Australian)
At a glance
Who discovered the great, South Pole-straddling continent of Antarctica? According to the National Geographic, Captain Cook came within an estimated 80 miles of it in the late 1700s, but the three first 'official' discoveries all took place in 1820 by Russian, British and American teams of seafarers respectively.
Since that initial discovery, Antarctica has attracted and inspired researchers and explorers alike. It's a challenging place, fringed by sea-ice that, unlike the Arctic, has not steadily declined but whose extent fluctuates on a seasonal basis: it's currently (February 2023) at a very low coverage, but it can and does recover from such dips. Antarctic sea-ice is no great problem, with the exception of albedo-loss in low extent years: if it all melted, it would have no effect on global sea-levels. It's the stuff on land we need to focus upon.
The land of Antarctica is a continent in two parts, divided by the 2,000 m high Transantarctic Mountains. The two parts differ in so many respects that they need to be considered separately. East Antarctica, that includes the South Pole, has the far greater landmass out of the two, some 4,000 by 2,500 kilometres in size. Although its massive ice-sheet, mostly grounded above sea level, would cause 52 metres of sea level rise if it completely melted, so far it has remained relatively stable. Snow accumulation seems to be keeping in step with any peripheral melting.
In contrast, in the absence of ice, West Antarctica would consist of islands of various sizes plus the West Antarctic Peninsula, a long mountainous arm pointing northwards towards the tip of South America. The ice sheet overlying this mixed topography is therefore grounded below sea level in many places and that's what makes it far more prone to melting as the oceans warm up. Currently, the ice-sheet is buttressed by the huge ice-shelves that surround it, extending out to sea. These slow down the glaciers that drain the ice-sheet seawards.
The risk in West Antarctica is that these shelves will break up and then there will be nothing to hold back those glaciers. This has already happened along the West Antarctic Peninsula: in 1998-2002 much of the Larsen B ice-shelf collapsed. On Western Antarctica's west coast, the ice-sheet buttressing the Thwaites Glacier – a huge body of ice with a similar surface area to the UK - is a major cause for concern. The glacier, grounded 1,000 metres below sea level, is retreating quickly. If it all melted, that would raise global sea levels by 65 centimetres.
Such processes are happening right now and may not be stoppable - they certainly will not be if our CO2 emissions continue apace. But there’s another number to consider: 615 ppm. That is the CO2 level beneath which East Antarctica’s main ice sheet behaves in a mostly stable fashion. Go above that figure and the opposite occurs - major instability. And through our emissions, we’ve gone more than a third of the way there (320 to 420 ppm) since 1965. If we don’t curb those emissions, we’ll cross that line in well under a century.
Please use this form to provide feedback about this new "At a glance" section. Read a more technical version below or dig deeper via the tabs above!
Further details
Arguments that we needn't worry about loss of ice in the Antarctic because sea ice is growing or even that sea ice in the Antarctic disproves that global warming is a real concern hinge on confusion about differences between sea and land ice, and what our best information about Antarctic ice tells us.
As well, the trend in Antarctic sea ice is not a permanent feature, as we'll see. But let's look at the main issues first.
- Sea ice doesn't play a role in sea level rise or fall.
- Melting land ice contributes to sea level rise.
- The net, total behavior of all ice in the Antarctic is causing a significant and accelerating rise in sea level.
Antarctic sea ice is ice which forms in salt water mostly during winter months. When sea ice melts, sea level does not change.
Antarctic land ice is the ice which has accumulated over thousands of years in Antarctica by snowfall. This land ice is stored ocean water that once fell as precipitation. When this ice melts, the resulting water returns to the ocean, raising sea level.
What's up with Antarctic sea ice?
At both poles, sea ice grows and shrinks on an annual basis. While the maximum amount of cover varies from year to year, there is no effect on sea level due to this cyclic process.
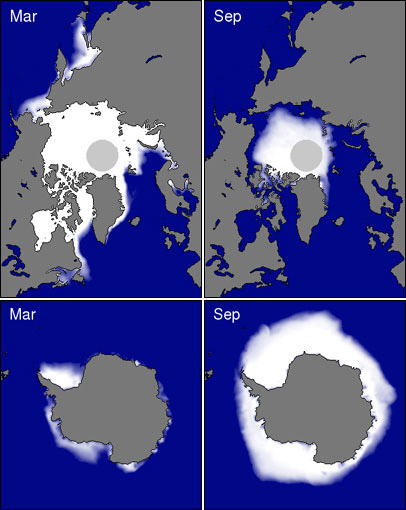
Figure 1: Coverage of sea ice in both the Arctic (Top) and Antarctica (Bottom) for both summer minimums and winter maximums. Source: National Snow and Ice Data Center
Trends in Antarctic sea ice are easily deceptive. For many years, Antarctic sea was increasing overall, but that shows signs of changing as ice extent has sharply declined more recently. Meanwhile, what's the relationship of sea ice to our activities? Ironically, plausible reasons for change may be of our own making:
- Ozone levels over Antarctica have dropped causing stratospheric cooling and increasing winds which lead to more areas of open water that can be frozen (Gillett & Thompson 2003, Thompson & Solomon 2002, Turner et al. 2009).
- The Southern Ocean is freshening because of increased rain and snowfall as well as an increase in meltwater coming from the edges of Antarctica's land ice (Zhang 2007, Bintanja et al. 2013). Together, these change the composition of the different layers in the ocean there causing less mixing between warm and cold layers and thus less melted sea and coastal land ice.
Against those factors, we continue to search for final answers to why certain areas of Antarctic sea ice grew over the past few decades (Turner et al. 2015).
More lately, sea ice in southern latitudes has shown a precipitous year-on-year decline (Parkinson 2019). While there's a remaining net increase in annual high point sea ice, the total increase has been sharply reduced and continues to decline.
How is Antarctic land ice doing?
We've seen that Antarctic sea ice is irrelevant to the main problem we're facing with overall loss of ice in the Antarctic: rising sea level. That leaves land ice to consider.

Figure 2: Total Antarctic land ice changes and approximate sea level contributions using a combination of different measurement techniques (IMBIE, 2017). Shaded areas represent measurement uncertainty.
Estimates of recent changes in Antarctic land ice (Figure 2) show an increasing contribution to sea level. Between 1992 and 2017, the Antarctic Ice Sheets overall lost 2,720 giga-tonnes (Gt) or 2,720,000,000,000 tonnes into the oceans, at an average rate of 108 Gt per year (Gt/yr). Because a reduction in mass of 360 Gt/year represents an annual global-average sea level rise of 1 mm, these estimates equate to an increase in global-average sea levels by 0.3 mm/yr.
There is variation between regions within Antarctica as can be seen in Figure 2. The West Antarctic Ice Sheet and the Antarctic Peninsula Ice Sheet are losing a lot of ice mass, at an overall increasing rate. The East Antarctic Ice Sheet has grown slightly over the period shown. The net result is a massive loss of ice. However, under a high-emissions scenario, ice-loss from the East Antarctic ice-sheet is expected to be a much greater in the decades after 2100, as reported recently by Stokes et al. (2022). That’s a scenario we must avoid at all costs.
Takeaway
Independent data from multiple measurement techniques (explained here) show the same thing: Antarctica is losing land ice as a whole and these losses are accelerating. Meanwhile, Antarctic sea ice is irrelevant to what's important about Antarctic ice in general.
Last updated on 14 February 2023 by John Mason. View Archives


Sigh, let's have some data here. FIrstly, evidence that Antarctica is melting from erosion of base by warm water is found here. Recent estimates of geothermal flux and its role (tiny) is found here. A commentator did the maths on upper bound of geothermal flux here
And for the role of reduced salinity in sea ice, see papers and discussion
Why is Antarctica sea ice growing.
Jetfuel, show me where there is any seaice in places with rapid ocean currents.
Also Shepherd et al. (2012), which you quoted, show you exactly what the contribution of Antarctica ice melt is to sealevel. Didnt you read it? Why would assume that rates of melt will stay the same as the world warms?
"but why is the increased atmospheric moisture level going to result in increased perception in the desert of Antarctica?"
Try this paper.
The Potsdam Institute for Climate Impact Research has today posted a press release titled, Antarctica could raise sea level faster than previously thought.
The lead paragraph of the release:
The OP should be updated to reflect these new findings.
Since 70 meters of SLR=All of Antarctica melting, The 20 years from 1992 thru 2011 cumulative melt of .00006 of the 70 meters of potential SKL worth of land ice on Antarctica: .00006*7000 cm = .42 cm. At that rate per 20 year period, by 2100, there would be .42 * 4.5 = 1.89 cm. There is a lot of exponential increase in the rate of melt to get to 37 cm from less than 2 cm. In the end, even 37 cm is only .005 of Antarctica melted. The moon was at perigee this week and in some local areas tides along the US eastern seaboard were 16 cm higher than normal highs. A prelude of the effect of exponentially increasing melt through 2060?
Jetfuel,
1) Yes the rate of melting of Antarctic land ice is increasing. Simply projecting previous rates into the future is not a useful calculation.
2) A permanent increase in sea level, even a small one, is not comparable to the temoprary increase in tides represented by the position of the moon. In a similar way, a daily variation of +/- 20 degrees F between midnight and noon is normal temperature variation, but a permanent difference of 4-6 degrees worldwide can trigger an ice age or eliminate all glaciers and ice caps.
I think there is a thread dealing with arguments that ciimate change isn't that bad. Perhaps this would be better discussed there.
Why isn't projection of the recent past into the future useful? Taking the last 20 years and extrapolating 85 years ahead gives only 1.89 cm of SLR from Antarctica melting. Lots of graphs about ice on this and other websites give a % loss per decade change listed right on the graph. Now, since the article quoted just above says that there "could" be 37 mm of SLR, you can't say that extrapolation "could" not be useful?
Don't compare water levels with temperature. When a sea level rises 6 inches above a level seen in a year, and that represents 1000 years of SLR rate, there is no air temp comparison
Jetfuel @256, if you look around there are lots of correlations, and lost of data we can project. For most such data, simple projection of trends will not successfully predict future behaviour, or will do so only for a short period. Project daily maximum local temperaure for the last few weeks more than a few weeks and chances are you will be making ridiculous predictions. The key to science is finding which, which regularities and which trends are reliably projectable. Noticing a correlation between use of the word "hemline" and global means surface temperatures, for example, means nothing without providing a physical theory as to why the correlation exists, and why it will persist.
Your projection of current trends in SLR, for example, includes no factors except sea level, and time. Therefore the underlying physical theory is (at best) that sea level is a linear function of time. There are many very good reasons to think a better model is that sea level is a function of global mean surface temperature. If you project your model, and a model which says sea level is a function of GMST into a future with global warming, they will give different results. Assuming your projection is better on the basis of "why not" amounts to assuming on no better basis that sea level is a linear function of time, or that temperature has no impact on sea level.
Even assuming sea level is a linear function of GMST is a very simple model, and will make different (and poorer) predictions than models that project sea level rise to be a complex function of GMST (ie, has different rates of increase with temperature for different contributing factors), or ones which make rate of increase of sea level a function of temperature.
Because there are many projectable functions for any observable variable, simply projecting a linear trend for such variables is the refusal to do science. If you want to know what is likely to happen, you need to actually test which physical model makes reliable projections. When you do that, you get the projections made by the IPCC.
If you want example of why ice retreat is non-linear, look at what happens to rate of mountain glacier retreat if a lake forms. You can get an order of magnitude increase in rate.
I wouldnt expect EAIS to melt much in next 100 years but much of west Antarctica is below sealevel and when sea water can get underneath the glacier then rate of calving goes up very quickly. I cant see how you could possibly expect linear rates from albedo change either.
If you want acceleration, then look at a suitable time interval.
Source:
Frankly, I would go with results from the scientists that actually study this and published their results for the world to see rather than naive trends.
I did some research on smithsonian.com and found out that Antarctica is much larger than the US lower 48 in area. The Ross Ice shelf is about the size of Texas. It lies on a shallow sea and the shelf is less than a km thick. It has always been melting from underneath. The study of Ice shelf loss recently done over a long period found that 85% of all ice shelf loss was from along the penninsula. There, the sea is warmer, has more currents, and the shelves are numerous, small, and farther from the S. pole. The shelf sits on the ocean anyway and won't add much to sea level rise because it is not on land. Right now, these shelves are surrounded by possibly the most extensive sea ice ever since records started being kept. The ice shelves are mostly the thinnest ice cover thickness areas of Antarctica, sit over the ocean, and are a small fraction of Antarctica'a huge area. They also get heavy snowfall and if they were to melt significantly, there would be an abrupt end to the melt as the area that has ocean under ice would be used up, leaving the vast majority of Antarctica's land ice still totally protected from the warm water of the sea being underneath. Really nothing new here, as this water has always been underneath the ice.
I fail quite to understand what point you are making here? Sealevel rise from Antarctica comes from the loss of ice sheet, not ice shelves. The main issue with the loss of ice shelves is the buttressing effect on glaciers. Where shelves have been lost, glacial calving rates have gone up. If you want to see what is the real issue, start with this paper. It is discussed in the NASA press release here.
Two arguments support growth of Antarctic sea ice which hit 19.7M sq km Sept 14th. One is the loss of Arctic ice has exposed the ocean surface there to release more heat than previously. When it was covered with ice, it's ability to give off heat was less. The second argument is that the increased ice covered area at the southern polar region is reflecting more of the sun's energy than ever before. These same two arguments can be used in reverse: The Antarctic ice area is covering more sea water than ever and allowing it to retain it's heat, and at the Arctic, the less than average amount of sea ice is reducing reflectivity of the sun's energy. The overall combined total of southern and northern sea ice, is very high this year and last year, and therefore ice/water solar reflectivity is on average, near it's recorded peak. With the Arctic sea ice looking like it will not dip below 5M sq km this summer, there will be an increase again in multiyear ice there.
The recent articles I've read downplaying this record Antarctic sea ice are using what happened in 2012 as the overriding factor. Right now, the sea ice ring around Antarctica is now an average of 750 miles in width, and is actually widest and most massive at the Ross Ice Shelf. The Ross Ice Shelf is noted in 2012 as being in danger of dissipating to unleash the West Antarctic Ice Sheet into the Ross Sea. For warm water today to flow under nearly 1000 miles of sea ice, then enter the Ross Sea, and then traverse through a thin water layer area the size of Texas, under a km thick of ice, then still be warm enough to melt the underside of a 2000 foot thick glacier's edge? I would be more inclined to believe the heat source is the Earth's core, not warm ocean water from Madagascar's beaches that has made that arduous journey described above.
jetfuel... Can you please provide sources for these?
Geothermal heat and ocean heat are both things that are measured. I pointed you to papers on both here and here. You seem to be simply ignoring measurements in those comments and going argument from Personal Incredulity and rhetoric ("Madagascar's beaches").
"The overall combined total of southern and northern sea ice, is very high this year and last year, and therefore ice/water solar reflectivity is "on average, near it's recorded peak". Can you cite your reference for this please? Albedo change is related to summer ice extent so I am having some difficulty with this claim.
And here are figures showing increasing temperature of the circum-antarctic ocean and its decreasing salinity.
Source:
Interesting paper, co-authored by Judith Curry, also noting the increasing sea temperatures here.
Oh, a final thought - sea ice and albedo is rather different between arctic and antarctica. Running the numbers can done and see here for one example.
Scaddemp, In your rebuttal to my comment about 2012 conditions being used as a rebuttal to what is happening today in the Antarctic, you point to articles written in 2012 about what happened in 2011. Further removed from recent happenings.
Meanwhile, The Antarctic ice level far surpasses the level at this time at 10, 20, and 30 years ago. Since the turn around in the Arctic has already happened so Ice area is increasing there too, while the Antarctic is well into unchartered territory in increased area covered by sea ice, I expect another very cold winter just south of the Great Lakes. The Arctic turn back up of ice area happened already and did so only 3 days later than last year.
In combining the number of days in the year when sea ice area was increasing at both poles at the same time, this happened for 41 days in 1994 (20 years ago). So far this year, it has been happening for 36 days and surpassing the 20 years ago mark looks easy considering 6 more days will do it. All totalled, there was about 980,000 km sq more sea at these times in 1994 than today, out of 27M, that is less than 4% less. This .98M difference is falling each day, as The Antarctic just passed 20M with a half million increase just in the last week. The vaguery of "shifting wind patterns" is proposed as the reason why we are about to have more sea ice than 20 years ago even though the oceans are supposedly the warmest since 1900. All this while state legislatures fight over sea level rise extrapolation methods that amount to less change in 1000 years than an annual but rare moon caused tidal change that happened this summer.
Sea ice data from nsidc charctic
[Rob P] - Perspective is important here. A back-of-the-napkin calculation by myself, using middle-of-the-road estimates, shows that the annual average rate of global ice volume loss over the last decade is around 50 times greater than the increase in Antarctic winter sea ice. So the fact that Antarctic sea ice is increasing doesn't challenge our observations that the world is warming in a largely coherent manner - which we would expect given the increasing greenhouse effect.
Trends in Antarctic sea are very patchy though, strong losses in some areas, but overcompensated by gains in other areas. Indeed, the growth areas appear to be in the vicinity of the Weddell and Ross Sea polar gyres - where divergence at the surface pulls cold water up from the deep. This will likely weaken when the Interdecadal Pacific Oscillation (IPO) switches to its positive phase in the coming years. So it will be interesting to see how the gyres respond, and what effect this has, when this phase switch occurs.
The image below is from Maksym et al (2012):
jetfuel, what are you trying to dance around? Do you have a point?
Btw, Arctic sea ice area minimum for 2014 is less than SIA minimum for 2013 (3.554m km2 vs. 3.483m km2). If you're going to use a one-year change to claim "recovery," then what do you do when the next one-year change reverses the sign? The summer minimum linear for Arctic SIA from 1979-2006 (the year before the 2007 collapse) is -47,592 km2. The same for 1979-2014 is -69,590 km2. Between 1979 and 2013, there are 15 years where SIA exceeds the preceding year. Most importantly for the sake of your dance, reality is about 50 years ahead of model expectations for Arctic decline. Call me when the ten-year linear is positive. Maybe I'll listen.
Also, if you don't think wind patterns, wind speed, and salinity have anything to do with Antarctic sea ice growth, by all means provide the physical mechanism through which these forces are rendered powerless.
jetfuel @266 says:
It is true that the Antarctic Sea Ice anomaly is greater than at any time in the last thirty years, but even my history goes back longer than that - let alone the Antarctics. So, let's look at the charted sea ice extent from the HadISST database, as plotted by Tamino:
Of course, that is a little out of date. The current data (Sept 20th, 2014) is at 20 million square kilometers. Uncharted for the satellite era, certainly - but uncharted simpliciter? That you choose to forget history does not mean it does not exist.
Or we might compare the August 2014 sea ice extent to a 1904 estimate of winter sea ice extent, which is shown extending as far north as South Georgia:
So, Antarctic sea ice extent is in uncharted territory, but only if you are carefull not to look at charts that might bust your pet theory.
jetfuel @266.
It is difficult to know when you talk of "the turn around in the Arctic" whether you are proposing the reversal of the trends of the last 30 years or that the winter freeze has arrived.
This "number of days in the year when sea ice area was increasing at both poles" you talk of - why do you pick on 1994? Indeed, why this annual statistic? A quick bash at the SIA data shows those 'numbers of days' are not very relevant to levels of SIA & SIE for those years. Why then do you feel the statistic is worthy of the diodes recording them?
Any data out there that shows Antarctic ice mass changes since Sept 2012 cannot be found by me. I understand that the -100 GT/yr number is floated around but there is no data to support this trend over the last 2 years. It is as though 2009 and 2010 data are currently on replay.
Per TomCurtis@268, Antarctic sea ice area is on the rise for almost 40 years as a general trend. With Nasa data showing ocean salinity as average surrounding Antarctica, as opposed to low salinity at the Amazon delta or Black sea, that salt dillution argument is weak as to why sea ice is unprecedented since the early 70's.
jetfuel @270, the failure to acknowledge clear errors (such as your claim that "the Antarctic is well into unchartered territory in increased area covered by sea ice") shows your purpose in debate is not understanding, but purely rhetorical. Further, referring to data without providing a clear web address or link suggests you are hiding behind your interpretation of the data rather than relying on it.
More directly, the question is not the level of salinity, but the change in level of salinity. From your wording, your NASA site only shows the former. Here is the later, from Zhang (2006):
As you conveniently point out, the trend in Antarctic sea ice is 40 years long. Therefore the 1979-2004 data should provide the clue as to the cause of the increase in sea ice extent, for the sea ice extent was increasing over that period. We therefore notice that it is not due to changes in temperature, which was increasing over that period (panel e). Salinity, however, was decreasing over much of the Antarctic waters (panel d). Further, NASA accepts that data, and agrees that the decline in salinity is part of the explanation of increased ice extent.
Jetfuel, it remains completely unclear quite point you are trying to make.
Is it?
1/ Antarctica seaice is increasing, therefore Antarctic is getting colder
- not true as you have been shown. The paradox with seaice increase it that it happens while temperatures warm. Read the provided links/papers for why. Salinity decrease is only part of the story.
2/ Antarctic sea-ice increase "makes up" for Arctic sea ice loss.
- Nope, as pointed out above, the increase is only 1/6 of the climatological effect from seaice loss in arctic.
3/?? What are else?
I would have say that it is statement of mighty hope to believe that ice sheet loss has decreased significantly since 2012. Cryosat-2 was measuring record loss rates in 2010-2013. Glacier movement rates were increasing in southern summer of 2013-2014. What do think has suddenly changed to give you that hope?
Jetfuel:
I Googled "Antarctic ice loss" and found This link from June 2014. It says:
"Between 2010 and 2013, West Antarctica, East Antarctica, and the Antarctic Peninsula changed in mass by −134 ± 27, −3 ± 36, and −23 ± 18 Gt yr−1, respectively. In West Antarctica, signals of imbalance are present in areas that were poorly surveyed by past missions, contributing additional losses that bring altimeter observations closer to estimates based on other geodetic techniques. However, the average rate of ice thinning in West Antarctica has also continued to rise, and mass losses from this sector are now 31% greater than over the period 2005–2010"
Your suggestion that ice loss in the Antarctic is not increasing is incorrect. Perhaps if you Googled better you would be more up to date on your data. At least it is not doubling every five years.
Again, 'between 2010 and 2013' excludes the last 21 months that includes the last 2 southern winters. Curiosity about the last 2 winters is not rhetoric.
Curiosity just uncovered that there was a 200 Gt snow event in East Antarctica in 2009. Things can change significantly in one year.
I acknowledge that there was more Ant. sea ice than now in the middle of the last century. I misspelled uncharted as unchartered. I don't even know what unchartered would mean in the context I used. 1966 seems about when actual winter max numbers were annually charted and that looks like about 22M sq km back then.
Breaking 20M for the first time since the mid seventies. Being quick to propose blaming this on reduced salinity and shifting wind patterns may be rhetoric. Those excuses were ready to go on the day the record from last year was broken.
Jetfuel,
I read 2010-2013 as inclusive so that all the data up to last December is included. You cannot expect to have peer reviewed data about this winter available yet since the winter is not yet even over. A single snow event is weather. We are interested in the trend.
Of course scientists rapidly proposed explainations for the increase in ice: it had been predicted years ago. When events come to pass that were predicted long ago those papers are brought back and the proposed explainations look good. Predictions are not comparable to excuses.