Climate Science Glossary

Term Lookup

Enter a term in the search box to find its definition.

Settings

Use the controls in the far right panel to increase or decrease the number of terms automatically displayed (or to completely turn that feature off).

Term Lookup

Settings


All IPCC definitions taken from Climate Change 2007: The Physical Science Basis. Working Group I Contribution to the Fourth Assessment Report of the Intergovernmental Panel on Climate Change, Annex I, Glossary, pp. 941-954. Cambridge University Press.

Home Arguments Software Resources Comments The Consensus Project Translations About Support

Twitter Facebook YouTube Mastodon MeWe

RSS Posts RSS Comments Email Subscribe


Climate's changed before
It's the sun
It's not bad
There is no consensus
It's cooling
Models are unreliable
Temp record is unreliable
Animals and plants can adapt
It hasn't warmed since 1998
Antarctica is gaining ice
View All Arguments...


Username
Password
New? Register here
Forgot your password?

Latest Posts

Archives

Is Antarctica losing or gaining ice?

What the science says...

Select a level... Basic Intermediate

Antarctic sea ice extent has expanded at times but is currently (2023) low. In contrast, Antarctica is losing land ice at an accelerating rate and that has serious implications for sea level rise.

Climate Myth...

Antarctica is gaining ice

"[Ice] is expanding in much of Antarctica, contrary to the widespread public belief that global warming is melting the continental ice cap." (Greg Roberts, The Australian)

At a glance

Who discovered the great, South Pole-straddling continent of Antarctica? According to the National Geographic, Captain Cook came within an estimated 80 miles of it in the late 1700s, but the three first 'official' discoveries all took place in 1820 by Russian, British and American teams of seafarers respectively.

Since that initial discovery, Antarctica has attracted and inspired researchers and explorers alike. It's a challenging place, fringed by sea-ice that, unlike the Arctic, has not steadily declined but whose extent fluctuates on a seasonal basis: it's currently (February 2023) at a very low coverage, but it can and does recover from such dips. Antarctic sea-ice is no great problem, with the exception of albedo-loss in low extent years: if it all melted, it would have no effect on global sea-levels. It's the stuff on land we need to focus upon.

The land of Antarctica is a continent in two parts, divided by the 2,000 m high Transantarctic Mountains. The two parts differ in so many respects that they need to be considered separately. East Antarctica, that includes the South Pole, has the far greater landmass out of the two, some 4,000 by 2,500 kilometres in size. Although its massive ice-sheet, mostly grounded above sea level, would cause 52 metres of sea level rise if it completely melted, so far it has remained relatively stable. Snow accumulation seems to be keeping in step with any peripheral melting.

In contrast, in the absence of ice, West Antarctica would consist of islands of various sizes plus the West Antarctic Peninsula, a long mountainous arm pointing northwards towards the tip of South America. The ice sheet overlying this mixed topography is therefore grounded below sea level in many places and that's what makes it far more prone to melting as the oceans warm up. Currently, the ice-sheet is buttressed by the huge ice-shelves that surround it, extending out to sea. These slow down the glaciers that drain the ice-sheet seawards.

The risk in West Antarctica is that these shelves will break up and then there will be nothing to hold back those glaciers. This has already happened along the West Antarctic Peninsula: in 1998-2002 much of the Larsen B ice-shelf collapsed. On Western Antarctica's west coast, the ice-sheet buttressing the Thwaites Glacier – a huge body of ice with a similar surface area to the UK - is a major cause for concern. The glacier, grounded 1,000 metres below sea level, is retreating quickly. If it all melted, that would raise global sea levels by 65 centimetres.

Such processes are happening right now and may not be stoppable - they certainly will not be if our CO2 emissions continue apace. But there’s another number to consider: 615 ppm. That is the CO2 level beneath which East Antarctica’s main ice sheet behaves in a mostly stable fashion. Go above that figure and the opposite occurs - major instability. And through our emissions, we’ve gone more than a third of the way there (320 to 420 ppm) since 1965. If we don’t curb those emissions, we’ll cross that line in well under a century.

Please use this form to provide feedback about this new "At a glance" section. Read a more technical version below or dig deeper via the tabs above!


Further details

Arguments that we needn't worry about loss of ice in the Antarctic because sea ice is growing or even that sea ice in the Antarctic disproves that global warming is a real concern hinge on confusion about differences between sea and land ice, and what our best information about Antarctic ice tells us. 

As well, the trend in Antarctic sea ice is not a permanent feature, as we'll see. But let's look at the main issues first.

  • Sea ice doesn't play a role in sea level rise or fall. 
  • Melting land ice contributes to sea level rise. 
  • The net, total behavior of all ice in the Antarctic is causing a significant  and accelerating rise in sea level. 

Antarctic sea ice is ice which forms in salt water mostly during  winter months. When sea ice melts, sea level does not change.

Antarctic land ice is the ice which has accumulated over thousands of years in Antarctica by snowfall. This land ice is stored ocean water that once fell as precipitation. When this ice melts, the resulting water returns to the ocean, raising sea level.

What's up with Antarctic sea ice?

At both poles, sea ice grows and shrinks on an annual basis. While the maximum amount of cover varies from year to year, there is no effect on sea level due to this cyclic process. 


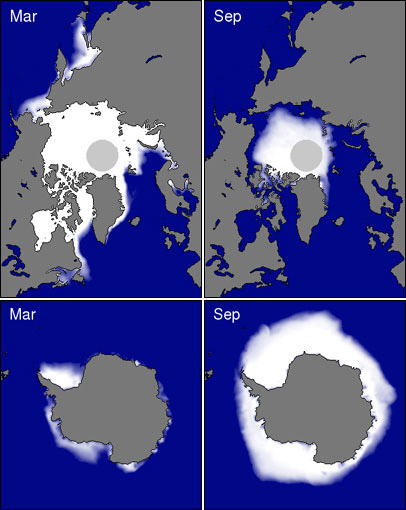
Figure 1: Coverage of sea ice in both the Arctic (Top) and Antarctica (Bottom) for both summer minimums and winter maximums. Source: National Snow and Ice Data Center

Trends in Antarctic sea ice are easily deceptive. For many years, Antarctic sea was increasing overall, but that shows signs of changing as ice extent has sharply declined more recently. Meanwhile, what's the relationship of sea ice to our activities? Ironically, plausible reasons for change may be of our own making:

  • The Southern Ocean is freshening because of increased rain and snowfall as well as an increase in meltwater coming from the edges of Antarctica's land ice (Zhang 2007, Bintanja et al. 2013). Together, these change the composition of the different layers in the ocean there causing less mixing between warm and cold layers and thus less melted sea and coastal land ice.

Against those factors, we continue to search for final answers to why certain areas of Antarctic sea ice grew over the past few decades (Turner et al. 2015). 

More lately, sea ice in southern latitudes has shown a precipitous year-on-year decline (Parkinson 2019). While there's a remaining net increase in annual high point sea ice, the total increase has been sharply reduced and continues to decline. 

How is Antarctic land ice doing?

We've seen that Antarctic sea ice is irrelevant to the main problem we're facing with overall loss of ice in the Antarctic: rising sea level. That leaves land ice to consider. 

Shepherd et al. 2017

Figure 2: Total Antarctic land ice changes and approximate sea level contributions using a combination of different measurement techniques (IMBIE, 2017). Shaded areas represent measurement uncertainty.

Estimates of recent changes in Antarctic land ice (Figure 2) show an increasing contribution to sea level. Between 1992 and 2017, the Antarctic Ice Sheets overall lost 2,720 giga-tonnes (Gt) or 2,720,000,000,000 tonnes into the oceans, at an average rate of 108 Gt per year (Gt/yr). Because a reduction in mass of 360 Gt/year represents an annual global-average sea level rise of 1 mm, these estimates equate to an increase in global-average sea levels by 0.3 mm/yr.

There is variation between regions within Antarctica as can be seen in Figure 2.  The West Antarctic Ice Sheet and the Antarctic Peninsula Ice Sheet are losing  a lot of ice mass, at an overall increasing rate. The East Antarctic Ice Sheet has grown slightly over the period shown.  The net result is a massive loss of ice. However, under a high-emissions scenario, ice-loss from the East Antarctic ice-sheet is expected to be a much greater in the decades after 2100, as reported recently by Stokes et al. (2022). That’s a scenario we must avoid at all costs.

Takeaway

Independent data from multiple measurement techniques (explained here) show the same thing: Antarctica is losing land ice as a whole and these losses are accelerating. Meanwhile, Antarctic sea ice is irrelevant to what's important about Antarctic ice in general.

Last updated on 14 February 2023 by John Mason. View Archives

Printable Version  |  Offline PDF Version  |  Link to this page

Argument Feedback

Please use this form to let us know about suggested updates to this rebuttal.

Further reading

Tamino compares and analyses the long term trends in sea ice data from the Northern and Southern Hemisphere in Sea Ice, North and South, Then and Now.

Denial101x video

Related lecture-video from Denial101x - Making Sense of Climate Science Denial

Additional videos from the MOOC

Interviews with  various experts

Expert interview with Jonathan Bamber

Expert interview with Isabella Velicogna


Update

On 20 Jan 2012, we revised this article upon learning it referenced an incorrect quote. We apologize to Dr. Michaels and to our readers for the error.

Comments

Prev  1  2  3  4  5  6  7  8  9  10  11  12  13  14  15  16  17  18  19  20  Next

Comments 51 to 75 out of 531:

  1. cjshaker - Sorry, missed replying to part of your post. You asked: "If the ice cores were taken from ice on water, the inverse temperature relationship should still hold?" See Figure 3a at the top of this page. The inverse temperature relationship does not currently hold.
  2. During a glacial warming phase, like we're still in now, shouldn't it be getting warmer everywhere? It seems to be hard to find accurate information about the ice age cycle, but I assume that this National Geographic article should be fairly accurate. It claims that we reached temperatures 4.5C warmer than today during the previous warm phase. If that is true, why would we not reach similar temperatures during this warm phase, with or without man's CO2? http://news.nationalgeographic.com/news/2007/07/070705-antarctica-ice.html Chris Shaker
  3. Oh, sorry, I already asked that question... Chris Shaker
  4. It was interesting to learn about the GRACE satellite, the shrinking land ice mass, and the growing sea ice mass. Thank you, Chris Shaker
  5. For interested parties, a recovered copy of Tamino's post Sea Ice, North and South, Then and Now (from the Further Reading section at the end of the post above) is available here. The Yooper
  6. Chris Shaker @ 53 It claims that we reached temperatures 4.5C warmer than today during the previous warm phase. If that is true, why would we not reach similar temperatures during this warm phase, with or without man's CO2? Because the orbital and rotational parameters of this interglacial are different from the last, the Eemian. Changes in the Earth's orbit (less eccentricity, greater perihelion distance) and rotation (lower obliquity & precession) mean the Earth won't heat up as much during this interglacial from solar radiation. Relying only on Milankovitch cycle forcing, the Earth should be cooling: Variations in the Earth's Orbit: Pacemaker of the Ice Ages "A model of future climate based on the observed orbital-climate relationships, but ignoring anthropogenic effects, predicts that the long-term trend over the next several thousand years is toward extensive Northern Hemisphere glaciation."
  7. Please comment on the accuracy of the following. The following statements appear to be correct. 1. Atmospheric heat, worldwide, has been steadily increasing from year to year for the past two decades. 2. Worldwide, the total volume of earth's ice has been in decline for the past two decades. 3. The cause appears to be the increased greenhouse effect as levels of atmospheric CO2 grew from 280ppm in the 1950's to the current level of 390ppm in 2010. 4. Estimates for the residence time of anthropogenic CO2 in the atmosphere range from a low of 1000 years to estimates as high as 100,000 years. If the foregoing statements are accurate is it also accurate to conclude their signifigance as? 1. Any program designed to reduce our future global carbon footprint can have no effect on slowing or reducing the advance of climate change until the minimum residence lifetime of the anthropogenic CO2 already aloft (390ppm)is achieved or some currently undeveloped geoengineering response is able to remove anthropogenic CO2 from the atmosphere to one or more of the other compartments of the carbon cycle. 2. The melting of ice worldwide will continue, uninterrupted, until all of the ice is melted if the time it will take to melt it all is less than the minimum anticipated residence lifetime of current levels of anthropogenic CO2 already aloft (1,000 years). 3. The increase in levels of atmospheric temperature to be expected from an ice free planet are almost certain to exceed human capacity to survive.
  8. albertsonrich I presume your numbers come from David Archer's estimates or something similar. There are several diffferent processes at play and only a fraction of what we emit will stay in the atmosphere that long.
  9. Re: albertsonrich (58) This isn't really the proper thread for your questions, but as they span multiple potential threads I'll attempt a brief answer of each point. If you're looking for a more in-depth answer with source references, use the search function in the upper left of each page to search for the most appropriate thread for any questions you may still have. Assuming (we both know what that makes us) you wish a cut-to-the-chase, give-me-a-straight-answer to your questions, here goes: 1. No real easy answer to this one, as what is tracked is energy, typically in the form of Watts/square meter or temperature in the form of anomalies or ocean heat content in joules. Due to the GHG effects of CO2, yes, energy is accumulating in the system (about 93% in the oceans, the remainder in the air). 2. Yes (land ice in the form of alpine glaciers and continental ice sheets and sea ice in the Arctic are all in net decline). 3. Most will shy from giving you a solid answer to this one. It is not 100% certain, but overall, I think that you have the right of it; caveated that 100% attribution cannot be made. 4. Complex question. Unlike other GHG's, CO2 has a long residence time (a long "tail"). Full sequestration involves chemical weathering processes taking thousands of years. Assuming that humans cease playing the "pile it on" game...(cue next question) *********************************************** 1. As long as human-derived CO2 emissions are greater than zero, in the absence of some CCS program, the atmosphere will still be out of radiative balance. Once net emissions = zero, approximately 30-50 years must elapse before radiative balance will be achieved (mostly due to thermal lag of the oceans and subsequent smaller feedbacks). Dwell for a moment on the thought that we are just now experiencing the effects of the carbon slug injected during the 70s... 2. No. Much too simplistic of a question. There appears to exist tipping points for Arctic sea ice, the Greenland Ice Sheet and the West Antarctica Ice Sheet (Hansen 2008, I think). Given that the last time CO2 concentrations were this high, global temps were some 3 degrees C higher and sea levels some 6-12 meters higher. Given the residence time of CO2 in the atmosphere, we're faced with the loss of summer sea ice in the Arctic (a 2010 study indicates that the system supports only a full-ice or a no-ice solution for the Arctic; i.e., once summer ice is lost, the system proceeds to a no-ice solution within as little as 6-10 years, depending on the model run). Given that, we must resign ourselves to the eventual loss of the GIS and the WAIS sometime within the next millenia (Hansen's study indicates 5+ meter sea level rises per decade by 2100 is a possibility due to ice melt and outlet glacier calving). 3. Unknown. If we continue BAU for another 20 years, the probability of an Arctic methane clathrate/hydrate release goes from its already non-zero status to perhaps an eventually likelihood. If we "burn it all", including the shale sands fossil fuels, Hansen maintains we can't rule out a runaway GHG "Venus Effect" or a hydrogen sulfide release such as seems to have occurred during the PETM. This is an area fraught with uncertainty, so your guess is as good as mine here. My thought is that the temperature increases and sea level increases will be the least of our worries (Google evapotranspiration decreases, soil aridity increase; an upcoming study proposes 70% of today's arable soils will be too dry to support crops by 2052...). Understand this: a synopsis-type answer such as I have given you in answer to your questions must necessarily be reflective more of my opinion of the consensus of understanding of the field than a considered opinion by the academic societies, the IPCC or even skeptical Science. Any further questions, please search for the most appropriate thread and post there. Thanks! The Yooper
  10. Expalain this. Is there a pattern? http://en.wikipedia.org/wiki/File:Vostok_420ky_4curves_insolation.jpg
    Response: [Daniel Bailey] Do you see a pattern? Please elaborate more on what your question is, as I don't have enough specifics to go by. Thanks!
  11. Well i see one....does anybody else? I see ca.130,000 years ago the same CO2 levels like today, again 230,000 the same levels and 330,000 higher than today. If this was someone's ,say..., bloodpressure chart, i would say this person has elevated bloodpressure every 100,000 years (lol) Its safe to say that if we erase the text from the graph and show it to anyone, everyone would see the pattern. But one question stands and no one can answer.... Ok, humans drive our climate today with CO2 emissions, who was the driver 130,000 years ago and the exact same driver 230,000 years ago and did it again 330,000 years ago? thank you for your time....
    Response: [Daniel Bailey] You are very much incorrect about the same CO2 levels as today existing in the timeframes you mention. The graph you refer to had a zero year baseline of 1950, when CO2 levels were much lower than today. See the updated graph I posted in comment 60 above. As for the blood pressure reference, Muoncounter nailed it in Comment 63 below. In fact, see the links Muoncounter cites for the appropriate answers to the rest of your questions. Thanks!
  12. #62: Have a look at Climate's changed before, Correlation between CO2 and temperature and CO2 is not the only driver. "If this was someone's ,say..., bloodpressure chart," Interesting analogy. In those terms, today's records would be the chart of a person who is being given CPR by a hyperactive teenager or perhaps the Incredible Hulk. Please note this thread is about current Antarctic ice loss. One of the links above is a more appropriate place for the 'driver' question.
  13. The question stands (still...). 130000 years ago CO2 levels = 1950 230000 years ago CO2 levels = 1950 330000 years ago CO2 levels = 1950 If we are raising CO2 levels today who did 1/4 of a million years ago? Thats all i m asking PS muoncounter since the ice cores and data are from Vostok Antarctica research station and if the ice there is melting away lets pay the last tribute to the station, (perhaps they will drill for soil cores in few years) and write here... hope thats ok with u
    Response: [Daniel Bailey] Ask a question, get an answer. If you want to be taken seriously, when you do get an answer and it contains linked references for you to read as homework it is then incumbent upon you to do that homework. Muoncounter was kind enough to give you some linked references for your gaining an understanding of the subject of your question. Please read them & ask questions on those threads if you have questions therein. Also please read this link as well. Thanks!
  14. Today is not 1950, it is 2011. The CO2 levels are higher now than they've been in the whole record of the Vostok ice cores. To say otherwise is denial, plain and simple. To talk about 1950 levels in a discussion concerning today is nothing but misdirection. The spikes were caused by net oceanic outgassing in response to increased solar irradiance from the Milankovitch cycles (orbital variation). The oceans and terrestrial biomes are currently net sinks. The primary source references to validate this claim are available elsewhere on this site. Please post any questions and responses on this matter under those entries.
  15. So..... 1950 levels are equal to 1/4 of a million years ago with no industrial revolution.... Thanks for answering my question by spending your precious time. Good Night, and Good Luck PS Im not in denial.... maybe u are. I did spend 40000 € 4 years ago for solar panels on my roof (did u?)to produce clean, CO2 free electric power and i m cleaning now the snow of almost on a daily basis.... so spare me the "denial" article
  16. Vank - So..... 1950 levels are equal to 1/4 of a million years ago with no industrial revolution.. See my comment @ 57. It's Milankovitch cycles. The previous interglacial cycles were warmer because the timing/variation of Earth's orbit/tilt/wobbles lead to greater solar radiation at the surface (insolation). No such confluence of factors exist during this interglacial. In fact we have already seen the natural high point of this interglacial during the Holocene Climatic Optimum, about 6000 years ago. The warming we are experiencing now is not natural, in fact we should be on our way to "extensive Northern Hemisphere glaciation". Variations in the Earth's Orbit - Pacemaker of the Ice Ages Hope this helps clear this up for you. Also: sorry to hear about your solar panels, but even decades from now, when it's globally much, much warmer, there will still be snow in winter.
  17. @vank #66 There are now at least two antipodal points in the Earth with the same temperature and pressure. That's absolutely true. And? Say whatever you want, and I will tell you there still are two antipodal points ... It makes no sense? Why? You were making the same kind of argumentation with your 1950/minusquartermillion reference. Let me rephrase your idea "in 1950 C02 levels were the same as in 234116BC without industrial revolution the same way there were no atomic weapons when women had not right to vote" We can safely infer important conclusions from those facts.
  18. This your idea not mine....voting rights and nuclear weapons vs. ice core samples and graphs(interesting argument. The "rephrasing ideas" system is only a sophists trick. Its a graph and it tells something or we can all play Struthio camelism.
  19. @vank #69 Thank you. You have expressed your ideas and background quite clearly. The right answer would have been an epistemologically valid argumentation and inference departing from your CO2 similar levels. You were asked that before and avoided to provide it. Now, confronted with your "trick" you abandon all doodles in climate science and answer in a proficient way about "tricks" including what I suppose to be an expression proper of the "trade". Keep this coming and thank you again. I need for my students more material like your posts, which are very juicy for that purpose.
  20. OK, there is one point in this article which is puzzling me. Take these two paragraphs: "In contrast, the Southern Ocean has been warming at 0.17°C per decade. Not only is the Southern Ocean warming, it is warming faster than the global trend." "Another contributor is changes in ocean circulation. The Southern Ocean consists of a layer of cold water near the surface and a layer of warmer water below. Water from the warmer layer rises up to the surface, melting sea ice. However, as air temperatures warm, the amount of rain and snowfall also increases. This freshens the surface waters, leading to a surface layer less dense than the saltier, warmer water below. The layers become more stratified and mix less. Less heat is transported upwards from the deeper, warmer layer. Hence less sea ice is melted." So the first paragraph suggests that the sea temperature is increasing, the second that the sea (surface) temperature is decreasing, and that this along with the winds is causing the extra sea ice. Does the difference come from the fact that the first measure is sea temp and the second is sea *surface* temp? I don't think so - the 0.17 number looks like a sea surface temp result. The second para says the sea surface layer is cooling. Or does it? No, it says less heat enters it from below. Does that make a difference? But surely only cooling would explain more ice? Unless ice formation involves temporary inhomogeneities perhaps? Are there any measurements which show surface cooling? No-one has mentioned the change in freezing temperature with salinity, so I presume that is too small to be significant. Thanks for any help, Kevin
  21. Any loss of land or sea ice due to melting increases sea levels which threatens those in Florida waterfront real estate. In fact the majority of the state at such a low sea level may be threatened even while more and more people migrate south.
  22. No-one answered my question, so I looked up Zhang 2007. From the abstract: "The model shows that an increase in surface air temperature and downward longwave radiation results in an increase in the upper-ocean temperature and a decrease in sea ice growth, leading to a decrease in salt rejection from ice, in the upper-ocean salinity, and in the upper-ocean density. The reduced salt rejection and upper-ocean density and the enhanced thermohaline stratification tend to suppress convective overturning, leading to a decrease in the upward ocean heat transport and the ocean heat flux available to melt sea ice. The ice melting from ocean heat flux decreases faster than the ice growth does in the weakly stratified Southern Ocean, leading to an increase in the net ice production and hence an increase in ice mass. This mechanism is the main reason why the Antarctic sea ice has increased in spite of warming conditions both above and below during the period 1979–2004 and the extended period 1948–2004." If I understand that, the air is warming the water leading to less freezing. However, once frozen, the ice insulates the water below, and the decrease salinity prevents convection from below bringing heat to melt it, so melting is also reduced. The reduction in melting is greater than the reduction in freezing, and so there is more ice.
  23. I've got a query, or two. The surface temperature over the past decade has been mostly steady and yet we attribute significant ice trends to the warming climate. Well over the past century we recorded significant unprecented global warming, so shouldn't the polar regions also have undergone significant observable change in that time? Is there evidence of that? (extrapolate those charts back another 100 years over a period when it actually warmed) I don't see how we can attribute polar ice trends to climate change when the climate isn't changing but ignore the much longer period when it changed a lot. The poles must be significantly different places now to what they were in 1900 if the period 2000-2010 is considered significant when climate change took a breather. (Yes we're limited by the fact that the polar regions haven't always been accessible, but scientists have their ways) Or on the same track we might ask why people are using 10 year (and less!) observation periods to glean affects of global warming at the poles and yet we would never use such periods for land observations because they're too short.
  24. OK lets substitute lower atmoshphere for surface temperature, that's what the satellite measures http://www.drroyspencer.com/wp-content/uploads/UAH_LT_1979_thru_Mar_2011.gif Is that an acceptable source DSL? Can we address the main points made which this isn't?
  25. Doesn't work, Ryan. You need to look at ocean temps as well when discussing polar changes. The entire basis of your argument is wrong, so this is addressing your main point. That's a pretty big jump from the Spencer-interpreted UAH LT "mostly steady" (not really) to "the climate isn't changing." There is overwhelming (as in too many studies to keep track of) evidence that the climate is changing rapidly, whatever the cause. The Arctic sea ice anomaly is nose-diving, and the global glacier mass balance is diving even more sharply.

Prev  1  2  3  4  5  6  7  8  9  10  11  12  13  14  15  16  17  18  19  20  Next

Post a Comment

Political, off-topic or ad hominem comments will be deleted. Comments Policy...

You need to be logged in to post a comment. Login via the left margin or if you're new, register here.

Link to this page


The Consensus Project Website

THE ESCALATOR

(free to republish)


© Copyright 2024 John Cook
Home | Translations | About Us | Privacy | Contact Us