


 Arguments


Is Antarctica losing or gaining ice?
What the science says...
| Select a level... |
 Basic
Basic
|
 Intermediate
| |||
|
Antarctic sea ice extent has expanded at times but is currently (2023) low. In contrast, Antarctica is losing land ice at an accelerating rate and that has serious implications for sea level rise. |
|||||
Climate Myth...
Antarctica is gaining ice
"[Ice] is expanding in much of Antarctica, contrary to the widespread public belief that global warming is melting the continental ice cap." (Greg Roberts, The Australian)
At a glance
Who discovered the great, South Pole-straddling continent of Antarctica? According to the National Geographic, Captain Cook came within an estimated 80 miles of it in the late 1700s, but the three first 'official' discoveries all took place in 1820 by Russian, British and American teams of seafarers respectively.
Since that initial discovery, Antarctica has attracted and inspired researchers and explorers alike. It's a challenging place, fringed by sea-ice that, unlike the Arctic, has not steadily declined but whose extent fluctuates on a seasonal basis: it's currently (February 2023) at a very low coverage, but it can and does recover from such dips. Antarctic sea-ice is no great problem, with the exception of albedo-loss in low extent years: if it all melted, it would have no effect on global sea-levels. It's the stuff on land we need to focus upon.
The land of Antarctica is a continent in two parts, divided by the 2,000 m high Transantarctic Mountains. The two parts differ in so many respects that they need to be considered separately. East Antarctica, that includes the South Pole, has the far greater landmass out of the two, some 4,000 by 2,500 kilometres in size. Although its massive ice-sheet, mostly grounded above sea level, would cause 52 metres of sea level rise if it completely melted, so far it has remained relatively stable. Snow accumulation seems to be keeping in step with any peripheral melting.
In contrast, in the absence of ice, West Antarctica would consist of islands of various sizes plus the West Antarctic Peninsula, a long mountainous arm pointing northwards towards the tip of South America. The ice sheet overlying this mixed topography is therefore grounded below sea level in many places and that's what makes it far more prone to melting as the oceans warm up. Currently, the ice-sheet is buttressed by the huge ice-shelves that surround it, extending out to sea. These slow down the glaciers that drain the ice-sheet seawards.
The risk in West Antarctica is that these shelves will break up and then there will be nothing to hold back those glaciers. This has already happened along the West Antarctic Peninsula: in 1998-2002 much of the Larsen B ice-shelf collapsed. On Western Antarctica's west coast, the ice-sheet buttressing the Thwaites Glacier – a huge body of ice with a similar surface area to the UK - is a major cause for concern. The glacier, grounded 1,000 metres below sea level, is retreating quickly. If it all melted, that would raise global sea levels by 65 centimetres.
Such processes are happening right now and may not be stoppable - they certainly will not be if our CO2 emissions continue apace. But there’s another number to consider: 615 ppm. That is the CO2 level beneath which East Antarctica’s main ice sheet behaves in a mostly stable fashion. Go above that figure and the opposite occurs - major instability. And through our emissions, we’ve gone more than a third of the way there (320 to 420 ppm) since 1965. If we don’t curb those emissions, we’ll cross that line in well under a century.
Please use this form to provide feedback about this new "At a glance" section. Read a more technical version below or dig deeper via the tabs above!
Further details
Arguments that we needn't worry about loss of ice in the Antarctic because sea ice is growing or even that sea ice in the Antarctic disproves that global warming is a real concern hinge on confusion about differences between sea and land ice, and what our best information about Antarctic ice tells us.
As well, the trend in Antarctic sea ice is not a permanent feature, as we'll see. But let's look at the main issues first.
- Sea ice doesn't play a role in sea level rise or fall.
- Melting land ice contributes to sea level rise.
- The net, total behavior of all ice in the Antarctic is causing a significant and accelerating rise in sea level.
Antarctic sea ice is ice which forms in salt water mostly during winter months. When sea ice melts, sea level does not change.
Antarctic land ice is the ice which has accumulated over thousands of years in Antarctica by snowfall. This land ice is stored ocean water that once fell as precipitation. When this ice melts, the resulting water returns to the ocean, raising sea level.
What's up with Antarctic sea ice?
At both poles, sea ice grows and shrinks on an annual basis. While the maximum amount of cover varies from year to year, there is no effect on sea level due to this cyclic process.
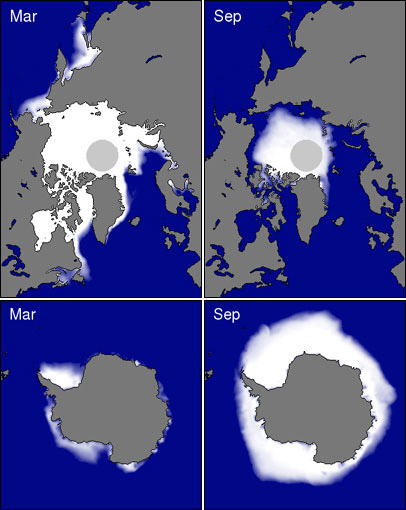
Figure 1: Coverage of sea ice in both the Arctic (Top) and Antarctica (Bottom) for both summer minimums and winter maximums. Source: National Snow and Ice Data Center
Trends in Antarctic sea ice are easily deceptive. For many years, Antarctic sea was increasing overall, but that shows signs of changing as ice extent has sharply declined more recently. Meanwhile, what's the relationship of sea ice to our activities? Ironically, plausible reasons for change may be of our own making:
- Ozone levels over Antarctica have dropped causing stratospheric cooling and increasing winds which lead to more areas of open water that can be frozen (Gillett & Thompson 2003, Thompson & Solomon 2002, Turner et al. 2009).
- The Southern Ocean is freshening because of increased rain and snowfall as well as an increase in meltwater coming from the edges of Antarctica's land ice (Zhang 2007, Bintanja et al. 2013). Together, these change the composition of the different layers in the ocean there causing less mixing between warm and cold layers and thus less melted sea and coastal land ice.
Against those factors, we continue to search for final answers to why certain areas of Antarctic sea ice grew over the past few decades (Turner et al. 2015).
More lately, sea ice in southern latitudes has shown a precipitous year-on-year decline (Parkinson 2019). While there's a remaining net increase in annual high point sea ice, the total increase has been sharply reduced and continues to decline.
How is Antarctic land ice doing?
We've seen that Antarctic sea ice is irrelevant to the main problem we're facing with overall loss of ice in the Antarctic: rising sea level. That leaves land ice to consider.

Figure 2: Total Antarctic land ice changes and approximate sea level contributions using a combination of different measurement techniques (IMBIE, 2017). Shaded areas represent measurement uncertainty.
Estimates of recent changes in Antarctic land ice (Figure 2) show an increasing contribution to sea level. Between 1992 and 2017, the Antarctic Ice Sheets overall lost 2,720 giga-tonnes (Gt) or 2,720,000,000,000 tonnes into the oceans, at an average rate of 108 Gt per year (Gt/yr). Because a reduction in mass of 360 Gt/year represents an annual global-average sea level rise of 1 mm, these estimates equate to an increase in global-average sea levels by 0.3 mm/yr.
There is variation between regions within Antarctica as can be seen in Figure 2. The West Antarctic Ice Sheet and the Antarctic Peninsula Ice Sheet are losing a lot of ice mass, at an overall increasing rate. The East Antarctic Ice Sheet has grown slightly over the period shown. The net result is a massive loss of ice. However, under a high-emissions scenario, ice-loss from the East Antarctic ice-sheet is expected to be a much greater in the decades after 2100, as reported recently by Stokes et al. (2022). That’s a scenario we must avoid at all costs.
Takeaway
Independent data from multiple measurement techniques (explained here) show the same thing: Antarctica is losing land ice as a whole and these losses are accelerating. Meanwhile, Antarctic sea ice is irrelevant to what's important about Antarctic ice in general.
Last updated on 14 February 2023 by John Mason. View Archives


alan2112drums @371.
I think the writings of David Rose of the Daily Mail on the subject of AGW are usually requiring "rebuttal" rather than "peer review". Even the IPCC have found it necessary to carry out such corrections, as SkS posted here.
I will add comment on this particular serving of gobshite from Rose on the same thread linked @373 & 375.
Sometimes a newcomer to a discussion or even to a science may see something the experienced conversationalists overlook. Seventy four years of age, I was trained as a theologian and then switched to Bible studies more narrowly understood. After reading all the comments, I realized to my horror, that three things noticed by comment but not put together by anybody, might abundantly confirm our worst fears about the ice and snow of Antarctica and global warming generally. It would go this way. The land ice is sliding into the ocean faster and faster. Thus there is more sea ice! AND THUS and thus please kindly excuse the capital letters THE SURFACE OF THE WORLD'S OCEANS IS COOLING SLIGHTLY the surface of the world's oceans is cooling slightly. It naturally would if fresh water from the melt of land ice were spreading widely! So that a cooler ocean, if only on the surface, would be wrongly reassuring to those of us who would like to continue to live on a planet wearing a cap of ice and ice boots, on which we have desported ourselves for forty milllion years.
[JH] The use of "all caps" constitutes shouting and is prohibited by the SkS Comments Policy.
[Rob P] - Global sea surface temperatures exhibit a long-term warming trend:
vincentfladk @377, the rate of sea level rise is approx 3 mm per year. I will assume that all of it comes from melting ice (in fact a significant amount comes from thermal expansion). The specific heat of water is 4.2 KJ/(Kg K). That is, it takes 4,200 Joules to raise one Kilogram of water by one degree K. The latent heat of fusion of water is 334 KJ/Kg. That is, it takes 334,000 Joules to melt one Kg of ice. Ergo, melting a Kg of ice takes approximately the same amount of energy as raising the temperature of that water by 80 degrees K.
Assume for the sake of argument, that the average temperature of the Ice was - 15 C prior to being melted, and that it is raised to the global average temperature of 15 C. The total energy involved in melting the ice and raising sea level on this assumption, therefore, is approximately equivalent to the energy required to raise 3 mm of sea water across the worlds ocean by 80 C. However, because of strong mixing due to surface winds, the top 50 meters (very conservatively) of sea water has essentially the same temperature. To cool the ocean surface, therefore, we need to cool that top 50 meters. That 3 mm of sea level rise, therefore must cool 16,667 times as much water as it holds. Averaging the heat over that depth, it means we have 80/16667 degrees C temperature decrease, or approximately 0.005 C decrease to small to be noticed.
In this calculation, I have made a number of assumptions that were generous (to say the least) to your theory. Even so, it does not hold water (pun intended). This is one of the things that distinguishes science from theology (or most of philosophy, ie, my own native discipline) is the use of mathematics to filter out those theories that seem plausible when not expressed with enough precission. It is also why newcomers very rarely see things that have not been considered and rejected as implausible by the actual scientific experts.
vincentfladk, the idea that Antarctic land ice falling into the ocean could be causing increased Antarctic sea ice has actually been floated and examined before. However, as Tom Curtis explains, in this case the situation is quite a bit more complicated.
That said, I have seen some suggestion that the decreased salinity of ocean water caused by melting land ice leads to a higher freezing point and thus some increase in sea ice formation. However, the prevailing theory seems to be that most of the Antarctic sea ice increase is caused by changes in wind patterns and/or the ozone hole.
CBDunkerson
I have heart similar and in the Arctic it seems true. However one of the team at RealClimate commented on that reccently that because most of the melt in the Antarctic, particularly West Antarctica flows under the ice sheet it emerges at the sea floor not the surface. So it is too far down to impact salinity in a way that influences freezing at the surface.But it can freeze in situ when it hits the slightly colder, saline water at depth.
In a statement issued on 5 February, the NSIDC said: “Preliminary measurements from the CryoSat show that the volume of Arctic sea ice in autumn 2013 was about 50% higher than in the autumn of 2012. In October 2013, CryoSat measured approximately 9,000 cubic kilometers (approximately 2,200 cubic miles) of sea ice compared to 6,000 cubic kilometers (approximately 1,400 cubic miles) in October 2012.”
[PS] Please note that this topic is for discussion of Antarctic sea ice so arctic conditions are off topic. Also note that it is better to look at trends rather than short term variation though today's ice numbers are "interesting".
Quantummist,
I posted a reply here where it is on topic.
The year 2010-2011 for the Arctic, (from here) , shows a late peak... not to mention a very flat projection towards said late peak. The following year, 2011-2012, didn't seem to suffer in terms of ice extent!!
From this may I be permitted to guess that we perhaps haven't seen the maximum ice extent for 2014-2015 yet??
bozzza
That might have been a fair possibility a week ago. Now a late rise in extent would look less likely. That said, a record low maximum extent doesn't tell us what the minimum in September will look like. 2012 was the record minimum, but it certainly wasn't an unusually low maximum. It all depends on the weather up there over the next 6 months.
Regions to watch:
If you haven't discovered it already, Neven's Arctic Sea Ice Blog is a treasure house:
Arctic sea ice is 1.2 million square kilometers below average. Antarctic Sea ice is 1.7 million above average.
How does a climate change advocate deny the reality of this?
bozzza@385 - As the self same "Arctic Nerd" mentioned by Glenn above I'm afraid that I don't understand your question in this context. Is there any chance that you can rephrase it? What precisely is "a climate change advocate" in your terminology?
"climate change advocate" = a non-denier of climate change
In which case doesn't this very article answer your question in great detail?
If not you will need to elucidate in much greater detail!
I'm not denying the article is helpful in explaining that ozone depletion is causing wind increases and melting of land ice plus rain increases are freshening the Southern ocean changing the layers so that warm and cold waters don't mix like they once did... I'm simply saying the numbers look curious.
I not entirely sure I understand your concern. As far as I can see, the article is comparing Winter Antarctica seaice (no climaticalogical effect because it happens when the sun isnt shining), versus Summer Arctic sea ice (where the loss is significant due to reduce albedo). The skeptic narrative is that northern hemisphere warming is more than matched by southern hemisphere cooling (sea ice as evidence). However the narrative fails because sea ice increase isnt due to SH cooling - the Antarctic is warming too. Its just that real situation is more complicated.
A better comparison is to compare the climatological effect from sea ice albedo between hemispheres. Tamino did that here - compare that with the rather deceptive approach at Nova.
Ok, I was just saying the numbers look weird and I think that is worthy of considered comment as to why.. I haven't understood the meaning of statistical significance but as far as sea-ice area graphs of Antarctica are concerned the last few results seems to be worth talking about.
I get the mechanisms discussed but the real-politik of statistics and publicly inspired meaningful thresholds cannot go unanswered.
bozzza@391 - So you're seeking a punchy "elevator pitch" that addresses the misleading headlines of Nova et al.?
And/or suggesting that this article needs updating to include the 2014/15 numbers?
I am saying it makes the fight to have climate science recognised by the trolls more difficult, yes!
bozzza, Re the data you reference regarding 2D ice extent increases in Antarctica, the 3D ice mass budget studies indicate large accelarations in the rate of 3D ice loss (mass not 2D measurment).
See the article SOTC: Ice Sheets, which refernces these studies (Rignot et al. 2008).
The 2D ice extent in the Arctic (north pole) indicates a downward trend.
UW - Perhaps I'm being naive. but it seems bozzza understands all that. I ultimately understood his question to be "how might one wrap all that up neatly in a catchy headline", or at most a sentence or two.
"Real-politik" rather than "Rignot et al."?
UW/bozzza - Perhaps this is a canonical example?
https://dohumanscauseglobalwarming.wordpress.com/
Bozzza - Antarctic sea ice is not relevant because unlike the Arctic, which is 100% sea ice, the Antarctic ice pack is overwhelmingly non-sea ice.
The Antarctic ice pack should only be tracked in its entirety unless one’s intention is to mislead people as to the extent of the disaster.
Is there a way to edit ones’ posts here?
I forgot to add that the hole in the ozone layer is also man made so even if one wanted to use that as an excuse for the Antarctic ice pack declining, it is still man made ice pack destruction/global warming.
Ok, so we're saying sea ice is a worthy indicator of something amiss in the N.H. but as an indicator of something amiss in the S.H. it is not as relevant. I will just have to accept for now that I was getting hooked up with a red herring or atleast feeling the need to explain it...(such is life!)
What's been bugging me forever(I was going to say lately but that wouldn't quite express it correctly) is this: ocean-pump-keeps-northern-hemisphere-hot
As a failed engineering student I know it's all about heat pumps and this article says the phenomenon of the N.H. being hotter was discovered in the 1600s because it was observed that icebergs survived at lower latitudes in the S.H. than would be allowed in the N.H.
The question is why is the above- the fact that the NH is warmer than the SH- not common knowledge?
Am I wrong, perhaps?
If not then I really question why it hasn't been made common knowledge as most people who are fans of science will understand this completely as the process that needs to be witnessed very very closely.... and at the moment it looks as if the problem can't be made intelligible to the public because of this basic information scarity.
(Simply my opinion of course but that's my 2 cents...)
Bozzza
2010-2011 2011-2012 are by themselves not relevant. The only thing that is relevant is the trend. If there are some outliners, not relevant to the trend, that is still the way that trends work.
One could even argue that trend lines were created so that people would not be fooled by the outliners to make foolish decisions based on something that has no real relevance to reality.
P.S. The maximum extent for the Arctic in 2015 not only occurred early, it was the lowest maxium in the satelite record.