


 Arguments


Is Antarctica losing or gaining ice?
What the science says...
| Select a level... |
 Basic
Basic
|
 Intermediate
| |||
|
Antarctic sea ice extent has expanded at times but is currently (2023) low. In contrast, Antarctica is losing land ice at an accelerating rate and that has serious implications for sea level rise. |
|||||
Climate Myth...
Antarctica is gaining ice
"[Ice] is expanding in much of Antarctica, contrary to the widespread public belief that global warming is melting the continental ice cap." (Greg Roberts, The Australian)
At a glance
Who discovered the great, South Pole-straddling continent of Antarctica? According to the National Geographic, Captain Cook came within an estimated 80 miles of it in the late 1700s, but the three first 'official' discoveries all took place in 1820 by Russian, British and American teams of seafarers respectively.
Since that initial discovery, Antarctica has attracted and inspired researchers and explorers alike. It's a challenging place, fringed by sea-ice that, unlike the Arctic, has not steadily declined but whose extent fluctuates on a seasonal basis: it's currently (February 2023) at a very low coverage, but it can and does recover from such dips. Antarctic sea-ice is no great problem, with the exception of albedo-loss in low extent years: if it all melted, it would have no effect on global sea-levels. It's the stuff on land we need to focus upon.
The land of Antarctica is a continent in two parts, divided by the 2,000 m high Transantarctic Mountains. The two parts differ in so many respects that they need to be considered separately. East Antarctica, that includes the South Pole, has the far greater landmass out of the two, some 4,000 by 2,500 kilometres in size. Although its massive ice-sheet, mostly grounded above sea level, would cause 52 metres of sea level rise if it completely melted, so far it has remained relatively stable. Snow accumulation seems to be keeping in step with any peripheral melting.
In contrast, in the absence of ice, West Antarctica would consist of islands of various sizes plus the West Antarctic Peninsula, a long mountainous arm pointing northwards towards the tip of South America. The ice sheet overlying this mixed topography is therefore grounded below sea level in many places and that's what makes it far more prone to melting as the oceans warm up. Currently, the ice-sheet is buttressed by the huge ice-shelves that surround it, extending out to sea. These slow down the glaciers that drain the ice-sheet seawards.
The risk in West Antarctica is that these shelves will break up and then there will be nothing to hold back those glaciers. This has already happened along the West Antarctic Peninsula: in 1998-2002 much of the Larsen B ice-shelf collapsed. On Western Antarctica's west coast, the ice-sheet buttressing the Thwaites Glacier – a huge body of ice with a similar surface area to the UK - is a major cause for concern. The glacier, grounded 1,000 metres below sea level, is retreating quickly. If it all melted, that would raise global sea levels by 65 centimetres.
Such processes are happening right now and may not be stoppable - they certainly will not be if our CO2 emissions continue apace. But there’s another number to consider: 615 ppm. That is the CO2 level beneath which East Antarctica’s main ice sheet behaves in a mostly stable fashion. Go above that figure and the opposite occurs - major instability. And through our emissions, we’ve gone more than a third of the way there (320 to 420 ppm) since 1965. If we don’t curb those emissions, we’ll cross that line in well under a century.
Please use this form to provide feedback about this new "At a glance" section. Read a more technical version below or dig deeper via the tabs above!
Further details
Arguments that we needn't worry about loss of ice in the Antarctic because sea ice is growing or even that sea ice in the Antarctic disproves that global warming is a real concern hinge on confusion about differences between sea and land ice, and what our best information about Antarctic ice tells us.
As well, the trend in Antarctic sea ice is not a permanent feature, as we'll see. But let's look at the main issues first.
- Sea ice doesn't play a role in sea level rise or fall.
- Melting land ice contributes to sea level rise.
- The net, total behavior of all ice in the Antarctic is causing a significant and accelerating rise in sea level.
Antarctic sea ice is ice which forms in salt water mostly during winter months. When sea ice melts, sea level does not change.
Antarctic land ice is the ice which has accumulated over thousands of years in Antarctica by snowfall. This land ice is stored ocean water that once fell as precipitation. When this ice melts, the resulting water returns to the ocean, raising sea level.
What's up with Antarctic sea ice?
At both poles, sea ice grows and shrinks on an annual basis. While the maximum amount of cover varies from year to year, there is no effect on sea level due to this cyclic process.
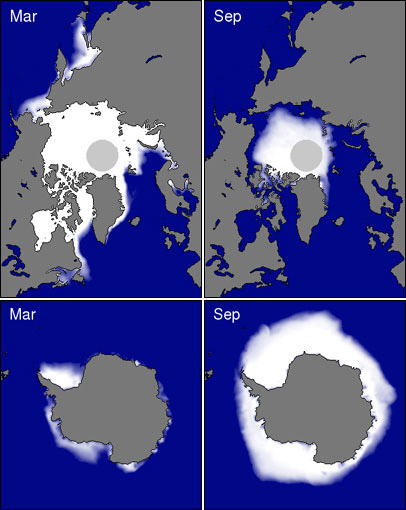
Figure 1: Coverage of sea ice in both the Arctic (Top) and Antarctica (Bottom) for both summer minimums and winter maximums. Source: National Snow and Ice Data Center
Trends in Antarctic sea ice are easily deceptive. For many years, Antarctic sea was increasing overall, but that shows signs of changing as ice extent has sharply declined more recently. Meanwhile, what's the relationship of sea ice to our activities? Ironically, plausible reasons for change may be of our own making:
- Ozone levels over Antarctica have dropped causing stratospheric cooling and increasing winds which lead to more areas of open water that can be frozen (Gillett & Thompson 2003, Thompson & Solomon 2002, Turner et al. 2009).
- The Southern Ocean is freshening because of increased rain and snowfall as well as an increase in meltwater coming from the edges of Antarctica's land ice (Zhang 2007, Bintanja et al. 2013). Together, these change the composition of the different layers in the ocean there causing less mixing between warm and cold layers and thus less melted sea and coastal land ice.
Against those factors, we continue to search for final answers to why certain areas of Antarctic sea ice grew over the past few decades (Turner et al. 2015).
More lately, sea ice in southern latitudes has shown a precipitous year-on-year decline (Parkinson 2019). While there's a remaining net increase in annual high point sea ice, the total increase has been sharply reduced and continues to decline.
How is Antarctic land ice doing?
We've seen that Antarctic sea ice is irrelevant to the main problem we're facing with overall loss of ice in the Antarctic: rising sea level. That leaves land ice to consider.

Figure 2: Total Antarctic land ice changes and approximate sea level contributions using a combination of different measurement techniques (IMBIE, 2017). Shaded areas represent measurement uncertainty.
Estimates of recent changes in Antarctic land ice (Figure 2) show an increasing contribution to sea level. Between 1992 and 2017, the Antarctic Ice Sheets overall lost 2,720 giga-tonnes (Gt) or 2,720,000,000,000 tonnes into the oceans, at an average rate of 108 Gt per year (Gt/yr). Because a reduction in mass of 360 Gt/year represents an annual global-average sea level rise of 1 mm, these estimates equate to an increase in global-average sea levels by 0.3 mm/yr.
There is variation between regions within Antarctica as can be seen in Figure 2. The West Antarctic Ice Sheet and the Antarctic Peninsula Ice Sheet are losing a lot of ice mass, at an overall increasing rate. The East Antarctic Ice Sheet has grown slightly over the period shown. The net result is a massive loss of ice. However, under a high-emissions scenario, ice-loss from the East Antarctic ice-sheet is expected to be a much greater in the decades after 2100, as reported recently by Stokes et al. (2022). That’s a scenario we must avoid at all costs.
Takeaway
Independent data from multiple measurement techniques (explained here) show the same thing: Antarctica is losing land ice as a whole and these losses are accelerating. Meanwhile, Antarctic sea ice is irrelevant to what's important about Antarctic ice in general.
Last updated on 14 February 2023 by John Mason. View Archives


karly @300.
I am not sure why you feel the comment @299 was aimed just at you. And to dot the 'i's, I have taken the liberty of linking the comment @299 to a comment @duncansteel.com even though "I am not a physicist, astronomer or climate scientist, nor am I associated in any way with Dr Steel."
karly @300, if he is so arrogant as to not present his views for peer review (where they can be examined by qualified experts) before going public with his results, why should I give any consideration to his request? That initial arrogance suggests to me he will not listen to rebutals in any event.
Karly@300 The purpose of this site is to discuss the strengths and weaknesses of scientific arguments. If you raise a scientific argument here, then you should expect its strengths and weaknesses to be discussed. It seems unreasonable to then say " If you believe his analysis is erroneous, please respect his request, and discuss the matter with him directly." as if Tom's post was disrespectful by discussing the problems with the theory here.
The WWW is already too full of misinformation, especially on climate, and so those with theories they wish to promulgate really ought to submit their ideas to peer review to give a reasonable chance for obvious flaws to be pointed out, rather than promulgating them immediately to laypersons who might accept them without seeing the flaws.
Milankovich first did these calculations by hand in jail in 1913 and they have been repeated many times by other researchers (eg see the results for the forcing in common use here.) When someone says they have done them and got a different result and yet not published it, then I am, shall we say, very skeptical. Publish the results and show why the standard ones are wrong and then we might be interested.
This is a brief response to #299 from Tom Curtis, after someone kindly pointed it out to me.
Virtually everything in #299 is incorrect.
"As it happens, he is claiming AGW is a smaller contributing factor because the difference in his calculation sprind insolation (on a particular day) over a 1000 years is greater than the radiative forcing over the last 250 years. " - No. I gave plots for both the past 1000 years and also the past 250 years; and note that from 1000 CE through to 1246 CE perihelion is approaching the winter solstice, then passing it, and since then having an accelerating effect on the insolation variation. On the item in parentheses "(on a particular day)" - no, I used that red bar to illustrate the change at the vernal equinox, but the graph that was copied above from my website has the overall intent of showing that the insolation over the (almost complete) first half of the year is higher than in the second half of the year. That is, at each instant during the first half of the year the insolation is greater than at the equivalent instant in the preceding year, if one registers the years against each other on a scientific basis (rather than using calendars that are based on religious considerations).
"The effect he calculates appears, however, to be linear over time" - No, not at all, and I state that in my essay; and have said so again above. Now, that statement I have just made applies to the insolation itself, but a far greater non-linearity to be anticipated, and which I discussed in my essay, is the effect of the changing insolation in terms of altering the albedo values and distribution, and therefore the overall consequences of that changing insolation.
" In fact, the total effect sums to zero over the course of the year so that the net forcing from his mechanism is in fact zero." - The statement is false. I explained in my essay in some detail, and several times, the ice albedo feedback effect, and gave an illustrative calculation. Curtis appears to have missed that. It would seem fairly obvious that an increase in the insolation in the first half of the year, and a reduction in the second half of the year, must have some effect in terms of climate change. This insolation change appears to have been hitherto missed in all reports and papers I have read, and you will not find mention of it in the IPCC reports. I have drawn attention to it in the hope that its overall effect can be assessed.
"Unless you wish to entertain a change in the laws of thermodynamics so that they only apply on the spring equinox, that alone refutes his conjecture." - As I noted above, the insolation changes (some positive, some negative) continue across the whole year; they are also latitude dependent, as I show in some detail. The spring equinox is simply an astronomically-defined instant used to register the years against each other.
"Further, his theory does not even match the evidence. As noted, his theory predicts a near linear change over the last thousand years." - Entirely incorrect statement. Not only are the insolation changes not linear, but also the consequences are not to be expected to be linear, as I explain in the essay.
"Berger (1978), from whom he draws his algorithms" - False statement. I did not draw my algorithms from Berger's wonderful papers. I derived the algorithms from first principles. It was only after the fact, when I saw what my results must imply, that I turned to Berger's FORTRAN program to do check calculations, as I have described in some detail. It is noteworthy that, as I discuss in my essay, essentially the only parameters needed in order to derive a good-enough calculation of the insolation changes are the lengths of the mean tropical year and the anomalistic year. The difference between those indicates the circa 58 years it takes perihelion to shift by one day closer to the vernal equinox. The use of the changing orbital eccentricity and obliquity of the ecliptic is nice, for completeness, but over only a century or two those slowly-altering values have little effect. Just the comparative values of the two year lengths are all that is required, to first-order.
The rest of the paragraph by Curtis discussing Berger (1978) is also entirely incorrect. In all his calculations Berger uses the vernal equinox to register the years against each other, whether he is making calculations of insolations in equal steps of the true anomaly or the mean anomaly. Unfortunately it is necessary to have a good command of the celestial mechanics involved if one is to be able to understand Berger's papers. If one does not understand the language/jargon, then stepping through Berger's FORTRAN program line by line may be instructive.
"his refusal to calculate a total year energy balance" - At this stage, no such calculation can be made, because I have calculated in detail only the changes in the incoming energy (the insolation) as a function of time-of-year and latitude; I have estimated also the effect upon the insolation absorption through a change in the Arctic albedo. Because I have not looked at the re-radiation, of course I have not calculated a "total year energy balance" - to state that is like complaining that I have not discussed the history of the Louvre in Paris: it's not relevant.
In any case, no balance is to be expected! Things are changing; and what I have introduced here would seem to be a major contributor to that change.
"inflation of the effect by using unequal comparison times" - Untrue. I used the interval 1750-2000 in most cases, using the past millennium (1000-2000) when I was driven to do so by considerations such as avoiding too-close cluttering in graphs and plots. In terms of criticizing specific comparisons of figures, Curtis misses the opportunity to note that the IPCC AGW climate forcing figure is for the whole Earth surface (4 pi r2) whereas the insolation is intercepted by only a quarter of that area (pi r2).
"a hypothesis he has not presented for peer review" - False statement. I have had it reviewed by several of my fellow astronomers with expertise in celestial mechanics (i.e. true peers), and I have presented it in research colloquia to others with broad astronomical expertise. As of yet no-one has found any flaw in my analysis/calculations. I have made a fairly simple-level account available on my website, and it is available for review by anyone. If someone out there can identify an error, please do let me know.
Curtis ended: "I would not waste my time on it. " - Well, he didn't. He has made it clear that he did not read my essay, nor understand it, just as he has demonstrated his lack of understanding of Berger's work.
karly: Thank you, appreciated.
The natural phenomenon I have described in my essay and associated graphics and movies (see http://www.duncansteel.com/archives/category/climate-change) is a surprising omission from previous climate change/global warming modelling. All constructive, valid criticisms and debate are welcome. The reality is, though, that one will need a good command of fundamental astronomy and celestial mechanics in order to understand what is going on, and so be able to identify any flaws, if they exist. True scholars are always pleased if someone identifies an error in their own calculations: that's the way we move forward.
[PS] Fixed link. Please note our comments policy, and in particular avoid bulk quoting. It is easier to refer to the original.
Responding to #304: " (eg see the results for the forcing in common use here.)" The linked page is the specific NOAA resource to which I have drawn attention in terms of incorrect application of valid data. Berger's results for the latitude-dependent insolation are made available there. Those values are tabulated for equal steps in ecliptic longitude (30-degree steps from the vernal equinox defined as the zero point) in different epochs. However, equal steps in ecliptic longitude are not equal steps in time! That is, the steps are not each 1/12th of a year. Therefore, when one takes from that website the values for 1950 CE (Berger's "present") and for 950 CE (one millennium previously), you cannot subtract the value for the first epoch from that in the other in order to deduce an insolation change! This is precisely what many climatologists have done, because they do not understand Kepler's Second Law. This really is pretty simply stuff - anyone who has done Astronomy 101 should be able to follow it - and yet no-one seems to have pointed it out previously.
To summarise: the insolations from Berger on that website are valid, but one cannot subtract his insolation values in one epoch from those in another if one wants to know the insolation change, because the insolations presented there are not for consistent time steps during the year: the time steps vary from epoch to epoch due to apsidal precession. The way one could achieve valid values for insolation changes - as I did, as a check on my own independent calculations - is to download Berger's FORTRAN program from his FTP site, and run it for equal time steps (e.g. day-by-day time steps) for any two epochs one might like to choose: say 1900 and 2000. The differences in the daily insolations between the two epochs will then show how much the insolation has actually changed at each and every latitude you care to chart.
duncansteel... Quick question in response to the repeated comment "in my essay."
You're clearly capable of publishing research. So, if you're so confident of your "essay" why is it not published in a respected peer reviewed journal?
I did a quick search and couldn't find anything by you on this subject.
"Curtis ended: 'I would not waste my time on it.' - Well, he didn't. He has made it clear that he did not read my essay, nor understand it..."
Ruh-roh.
I don't think Mr. Steel is familiar with Mr. Curtis.
duncansteel @305:
1) It is not me or the readers here you should be trying to convince. It is the editor and peer reviewers of a suitable journal who will be far more able to pick up any errors in your assumptions or calculations than I. That you have avoided that step shows you are more interested in propoganda (or book sales) than in science IMO.
2)
From the blog post:
3)
I showed a copy of one of those graphs, so it was quite clear as to your intent. The "on a particular day" draws attention to the fact that the calculated values reported in the text only apply on that day (with other days typically having a reduced effect), and to the fact that over the full year, the net effect is very near zero.
4)
Perhaps you have difficulty recognizing sarcasm. In virtue of the fact that the total insolation is effectively unchanging, the net effect on the Earth's energy balance over the full year is also likely to be effectively unchanging (on which more later).
5)
This is in some ways the crux of the issue. In his blogpost DS writes:
From this, and other related passages, I formed the idea that the effect DS describes is a function of the precession of the perihelion (relative to the vernal equinox). Here is DS's plot of the precession of the perihelion:
It may not be precisely linear, but for the time scale involved its departure for linearity is non-consequential.
Of course, DS can (and should already have) calculated the change in insolation at the northern spring equinox over the last thousand (or two thousand) years, and plotted it against changes in temperature over the same period. Such a plot would largely resolve this issue one way or another. He may also want to do the same for his calculated change in annual energy budget (due to differences in albedo at different locations and seasons along with the changing time of insolation). If either plot shows a hockey stick shape with an inflexion point in the late 19th century, he may be on to something. If not, the emperical data, which he has been so carefully avoiding, refutes his hypothesis.
(More in a following post)
Responding to #307:
Rob Honeycutt asked:
"You're clearly capable of publishing research. So, if you're so confident of your "essay" why is it not published in a respected peer reviewed journal?"
The answer is because I make my living generally in other ways than gathering funds from government grants, and therefore do not need to publish in journals (in order to gather yet more grants); and also choose not to spend the considerable time required putting things into the necessary format for journal publication. On my own website I can publish what I like, and what I believe to be correct, without being forced by referees with vested interests to alter what I want to say.
In terms of actual publication of the more-complete story in that 'essay' (someone else's term for it), it will eventually appear as a monograph published by a leading university press, in perhaps a year from now.
You wrote: "I did a quick search and couldn't find anything by you on this subject." Ummm. The subject here, as such, is celestial mechanics: the insolation changes come about directly from understanding the celestial mechanics. That is an area in which I have a record of something like 140 (peer-reviewed!) original research papers, four books in several editions, many book chapters, around a thousand articles in major newspapers and magazines, and ... But none of that means anything, in terms of whether my calculations of the insolation changes are right or wrong. They either are, or they're not.
Response to #309 point (1)
I am not trying to convince anyone of anything. Eventually the truth will come out and be recognised. As noted already, this work has already been peer-reviewed by several (about ten, from memory) people who have expert knowledge in the area (e.g. 20+ years experience post-PhD), and none has found any error; indeed, most are astonished by the rather silly mistake I have identified in various climate change papers where the authors have assumed that they can subtract the insolation at a certain ecliptic longitude in one epoch from that in another and that the result gives them the insolation change.
Response to #309 point (2)
As you quoted from me: "...it appears that these intra-annually varying insolation changes cannot be ignored." I emphasized that those particular plots were over a full millennium, so that people would not be misled. Although the insolation changes are not linear, to a good approximation the changes I calculated are between -2.0 and +1.1 W/m2. The latest (2013/14) IPCC AGW forcing estimate is 2.3 W/m2; in the 2007 report it was 1.6 W/m2. Therefore, as I stated, "...it appears that these intra-annually varying insolation changes cannot be ignored." Note that the only natural change admitted to the 2013/14 IPCC report is an intrinsic variation in intrinsic solar output of order 0.1 W/m2.
Response to #309 point (3)
Again, your comments are entirely wrong. I picked the vernal equinox as a suitable point at which to illustrate the magnitude of the (positive) change, because it is the traditional start of the year; and it is the actual start of the year, for a science-based system (i.e. it's the point at which the ecliptic longitude of the Earth is zero). In fact, it is not the juncture at which the maximum positive insolation change (to the whole Earth) occurs. Anyone can look at that graph, or the one for the 1750-2000 changes, and estimate the relative magnitudes and the signs of the changes at different times of year.
Yes, of course the net effect (i.e. the summed change in insolation) is very near to zero. In my essay I noted that the overall/net change is very small, and really is just non-zero only due to two effects: (a) The orbital eccentricity alters very slightly; and (b) The Earth is not spherical.
Response to #309 point (4)
"Perhaps you have difficulty recognizing sarcasm."
In all these things, please keep the debate on the facts, rather than any personal statements. The best way to reach the truth is to leave one's ego in the closet.
"In virtue of the fact that the total insolation is effectively unchanging, the net effect on the Earth's energy balance over the full year is also likely to be effectively unchanging (on which more later)."
That statement is obviously untrue, and many trivial examples could be given in order to disprove it. For example: if I hold my hand in direct sunlight, it will get warm due to the insolation. If I now hold a magnifying glass between my hand and the sun, the overall insolation reaching my hand may remain much the same, but its effect will be somewhat different.
The overall effect on the climate of the insolation will depend on when and where the sunlight arrives. As I have pointed out in the 'essay', what has happened (in an accelerating manner since 1246 CE) is that the insolation reaching far northern latitudes has increased during the first half of each year, and this should be anticipated to cause earlier and more-extensive spring melting of snow and ice, and therefore a progressively-earlier albedo reduction, and therefore more sunlight subsequently being absorbed across spring and summer: the ice albedo feedback effect acting positively (causing warming). For precisely the same core reason (apsidal precession) the opposite occurs in the southern hemisphere: less insolation at far southern latitudes, sea ice melting delayed, albedo increasing, less energy absorbed: growing sea ice: the ice albedo feedback effect acting negatively.
And if you look at my graphics carefully you will also see that there is an insolation increase at the furthest southern latitudes across austral summer, in accord with the observation of melting continental Antarctic ice.
Response to #309, point (5)
"From this, and other related passages, I formed the idea that the effect DS describes is a function of the precession of the perihelion (relative to the vernal equinox)."
Of course it is: I have stated that rather clearly many times. You could google my paper entitled "Perihelion precession, polar ice and global warming" (although it is linked in my essay: footnotes 5 and 7).
"Of course, DS can (and should already have) calculated the change in insolation at the northern spring equinox over the last thousand (or two thousand) years, and plotted it against changes in temperature over the same period. Such a plot would largely resolve this issue one way or another."
Entirely incorrect, and demonstrates a lack of understanding of the physics involved. Yes, I have calculated such things as you mention in your first clauses, but that is not relevant. 'Temperature' is not 'Heat': a cubic metre of space near Earth's orbit has a 'temperature' (as defined by the particle speeds) of some millions of degrees, but an astronaut would freeze to death without a proper thermal stabilisation system (vide the Apollo 13 movie!) - this is because the heat content of a cubic metre of space is extremely low, and is dominated by the photons passing through it.
Suitable models to be used in the investigation of the effect of the changing insolation (in terms of DOY and latitude) over timescales of decades to centuries will need to encompass how much energy (i.e. heat) is being absorbed and how that energy is then re-distributed, and the models will need to be evolutionary/dynamical. That is, they will need to be set up to indicate how year-on-year changes occur in response to year-on-year insolation changes. A little more insolation one year means a little more ice melting means a little more sunlight being absorbed means a little less ice forming over winter means a little less to melt next spring, and so on; and also the contrary in other locations.
Fundamentally, this is indeed what Milankovitch was writing about in the 1920s and 1940s, when he identified latitude 65N as being pivotal. The problem is that people have falsely imagined that the orbital changes he was discussing only have effects over timescales of several millennia, at least. This is incorrect. Perihelion shifts by one day every 57 or 58 years: a typical human lifetime. The effect of that shift, I have shown, should not be ignored in climate change modelling, as it has been: in part because climatologists have made a rather basic astronomical error.
"On my own website I can publish what I like, and what I believe to be correct, without being forced by referees with vested interests to alter what I want to say."
We only publish papers to get grant money? That pretty much news to my department. The point really is, that publish on a website and you are just another crank blog-scientist. Publish in a peer-reviewed journal and other scientists take notice and do something with it. Not a single climate paper will change unless you do.
"We only publish papers to get grant money? That pretty much news to my department"
I wonder where you are, because it's not news to any science-related department in any Australian University.
Karly, academic get grants in order to perform research and publish papers. Any research-oriented academic for whom getting grants rather than perfoming the research is their primary aim has rather lost their way.
The reason we publish papers is so that other scientists can take what we have done and build on it (as we ourselves build on the work of others). Grants are a means to an end, not the end itself.
Re:- The Changing Spring Insolation Theory (CSI).
Well I'm a very slow reader so I'm still only halfaway down the first page of Duncan Steel's explanation. Thankfully there appears to be only one page.
If CSI is to be considered seriously, the strength of the effect requires stating correctly. So when the explanation says:-
there is a problem, Houston. The measure of insolation is for the projected 'discal' value, the figures for central average values for AGW RF estimated by AR4 & AR5 are for the spherical 'global' value acting over 4x the area. Also with a third of insolation bouncing off into space, the value of the forcing resulting from changing insolation is reduced further. Thus the comparative AR4/AR5 values are 6x bigger than stated - 0.72% & 1.0%.
Looking ahead, down the page at the tabulated Langleys, the error does not appear to have spread so far.
@318 A great ideal. However, if you talk to any non-tenured academic, you will find that getting money, so they remain employed, is top of their list of priorities.
Duncansteel... "On my own website I can publish what I like, and what I believe to be correct, without being forced by referees with vested interests to alter what I want to say."
Ah, I see. You don't like your peers scrutinizing your work. Good to know.
MA Rodger @319, DS calculates the insolation by day and by latitude rather than using a global average. Later in the blog post he calculates what he purports to be the effect after adjustement for albedo. Therefore he correctly uses the TSI rather than the globally averaged and albedo adjusted effect in calculating initial ratios of adjustment. What he does not do, and should have done is plotted the change in the effect over time against some emperical measure of either temperature or surface heat content (either OHC directly for when we have the data, or glacial extents, or sea levels).
Ref #316:
"The point really is, that publish on a website and you are just another crank blog-scientist. Publish in a peer-reviewed journal and other scientists take notice and do something with it. Not a single climate paper will change unless you do."
That it will take others some time to understand what I have done and catch up is not a concern to me. Read Thomas Kuhn sometime. Twenty-five years ago most people thought I was a crank for arguing that we should take the hazard posed by asteroids and comets seriously; now they are the focus of NASA's future manned and robotic space missions, at Obama's behest. At the time (25 years ago) it was a fight to get anything on that topic into the journals, because they had their favoured topics. The same applies now in terms of climate change.
Ref #318: " Any research-oriented academic for whom getting grants rather than perfoming the research is their primary aim has rather lost their way."
Yes, that is a fair summary of the situation, especially in climate science. It's called the buffalo syndrome. One buffalo finds a new, juicy green patch of grass, and soon the rest of the herd joins him/her. But they've all got their heads down, chewing away, and none look to see if there is something better to be had: until a buffalo with heterodox views comes along.
"The reason we publish papers is so that other scientists can take what we have done and build on it (as we ourselves build on the work of others). Grants are a means to an end, not the end itself." - Ah, I was young and naive once, too.
Ref #317: karly, thanks again. I worked in just such departments for some years. I found few people really interested in science, only people interested in self-advancement, and the best way to gain that was bring in money and hence gain power. To the contrary, I am interested in science, and have spent a good fraction of my time doing (and publishing, in peer-reviewed journals!) scientific research with zero funding for the past 18 years (i.e. since I last had research funding; I had plenty before that).