


 Arguments


Is Antarctica losing or gaining ice?
What the science says...
| Select a level... |
 Basic
Basic
|
 Intermediate
| |||
|
Antarctic sea ice extent has expanded at times but is currently (2023) low. In contrast, Antarctica is losing land ice at an accelerating rate and that has serious implications for sea level rise. |
|||||
Climate Myth...
Antarctica is gaining ice
"[Ice] is expanding in much of Antarctica, contrary to the widespread public belief that global warming is melting the continental ice cap." (Greg Roberts, The Australian)
At a glance
Who discovered the great, South Pole-straddling continent of Antarctica? According to the National Geographic, Captain Cook came within an estimated 80 miles of it in the late 1700s, but the three first 'official' discoveries all took place in 1820 by Russian, British and American teams of seafarers respectively.
Since that initial discovery, Antarctica has attracted and inspired researchers and explorers alike. It's a challenging place, fringed by sea-ice that, unlike the Arctic, has not steadily declined but whose extent fluctuates on a seasonal basis: it's currently (February 2023) at a very low coverage, but it can and does recover from such dips. Antarctic sea-ice is no great problem, with the exception of albedo-loss in low extent years: if it all melted, it would have no effect on global sea-levels. It's the stuff on land we need to focus upon.
The land of Antarctica is a continent in two parts, divided by the 2,000 m high Transantarctic Mountains. The two parts differ in so many respects that they need to be considered separately. East Antarctica, that includes the South Pole, has the far greater landmass out of the two, some 4,000 by 2,500 kilometres in size. Although its massive ice-sheet, mostly grounded above sea level, would cause 52 metres of sea level rise if it completely melted, so far it has remained relatively stable. Snow accumulation seems to be keeping in step with any peripheral melting.
In contrast, in the absence of ice, West Antarctica would consist of islands of various sizes plus the West Antarctic Peninsula, a long mountainous arm pointing northwards towards the tip of South America. The ice sheet overlying this mixed topography is therefore grounded below sea level in many places and that's what makes it far more prone to melting as the oceans warm up. Currently, the ice-sheet is buttressed by the huge ice-shelves that surround it, extending out to sea. These slow down the glaciers that drain the ice-sheet seawards.
The risk in West Antarctica is that these shelves will break up and then there will be nothing to hold back those glaciers. This has already happened along the West Antarctic Peninsula: in 1998-2002 much of the Larsen B ice-shelf collapsed. On Western Antarctica's west coast, the ice-sheet buttressing the Thwaites Glacier – a huge body of ice with a similar surface area to the UK - is a major cause for concern. The glacier, grounded 1,000 metres below sea level, is retreating quickly. If it all melted, that would raise global sea levels by 65 centimetres.
Such processes are happening right now and may not be stoppable - they certainly will not be if our CO2 emissions continue apace. But there’s another number to consider: 615 ppm. That is the CO2 level beneath which East Antarctica’s main ice sheet behaves in a mostly stable fashion. Go above that figure and the opposite occurs - major instability. And through our emissions, we’ve gone more than a third of the way there (320 to 420 ppm) since 1965. If we don’t curb those emissions, we’ll cross that line in well under a century.
Please use this form to provide feedback about this new "At a glance" section. Read a more technical version below or dig deeper via the tabs above!
Further details
Arguments that we needn't worry about loss of ice in the Antarctic because sea ice is growing or even that sea ice in the Antarctic disproves that global warming is a real concern hinge on confusion about differences between sea and land ice, and what our best information about Antarctic ice tells us.
As well, the trend in Antarctic sea ice is not a permanent feature, as we'll see. But let's look at the main issues first.
- Sea ice doesn't play a role in sea level rise or fall.
- Melting land ice contributes to sea level rise.
- The net, total behavior of all ice in the Antarctic is causing a significant and accelerating rise in sea level.
Antarctic sea ice is ice which forms in salt water mostly during winter months. When sea ice melts, sea level does not change.
Antarctic land ice is the ice which has accumulated over thousands of years in Antarctica by snowfall. This land ice is stored ocean water that once fell as precipitation. When this ice melts, the resulting water returns to the ocean, raising sea level.
What's up with Antarctic sea ice?
At both poles, sea ice grows and shrinks on an annual basis. While the maximum amount of cover varies from year to year, there is no effect on sea level due to this cyclic process.
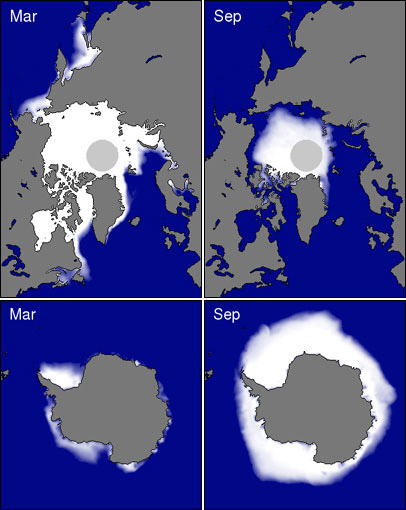
Figure 1: Coverage of sea ice in both the Arctic (Top) and Antarctica (Bottom) for both summer minimums and winter maximums. Source: National Snow and Ice Data Center
Trends in Antarctic sea ice are easily deceptive. For many years, Antarctic sea was increasing overall, but that shows signs of changing as ice extent has sharply declined more recently. Meanwhile, what's the relationship of sea ice to our activities? Ironically, plausible reasons for change may be of our own making:
- Ozone levels over Antarctica have dropped causing stratospheric cooling and increasing winds which lead to more areas of open water that can be frozen (Gillett & Thompson 2003, Thompson & Solomon 2002, Turner et al. 2009).
- The Southern Ocean is freshening because of increased rain and snowfall as well as an increase in meltwater coming from the edges of Antarctica's land ice (Zhang 2007, Bintanja et al. 2013). Together, these change the composition of the different layers in the ocean there causing less mixing between warm and cold layers and thus less melted sea and coastal land ice.
Against those factors, we continue to search for final answers to why certain areas of Antarctic sea ice grew over the past few decades (Turner et al. 2015).
More lately, sea ice in southern latitudes has shown a precipitous year-on-year decline (Parkinson 2019). While there's a remaining net increase in annual high point sea ice, the total increase has been sharply reduced and continues to decline.
How is Antarctic land ice doing?
We've seen that Antarctic sea ice is irrelevant to the main problem we're facing with overall loss of ice in the Antarctic: rising sea level. That leaves land ice to consider.

Figure 2: Total Antarctic land ice changes and approximate sea level contributions using a combination of different measurement techniques (IMBIE, 2017). Shaded areas represent measurement uncertainty.
Estimates of recent changes in Antarctic land ice (Figure 2) show an increasing contribution to sea level. Between 1992 and 2017, the Antarctic Ice Sheets overall lost 2,720 giga-tonnes (Gt) or 2,720,000,000,000 tonnes into the oceans, at an average rate of 108 Gt per year (Gt/yr). Because a reduction in mass of 360 Gt/year represents an annual global-average sea level rise of 1 mm, these estimates equate to an increase in global-average sea levels by 0.3 mm/yr.
There is variation between regions within Antarctica as can be seen in Figure 2. The West Antarctic Ice Sheet and the Antarctic Peninsula Ice Sheet are losing a lot of ice mass, at an overall increasing rate. The East Antarctic Ice Sheet has grown slightly over the period shown. The net result is a massive loss of ice. However, under a high-emissions scenario, ice-loss from the East Antarctic ice-sheet is expected to be a much greater in the decades after 2100, as reported recently by Stokes et al. (2022). That’s a scenario we must avoid at all costs.
Takeaway
Independent data from multiple measurement techniques (explained here) show the same thing: Antarctica is losing land ice as a whole and these losses are accelerating. Meanwhile, Antarctic sea ice is irrelevant to what's important about Antarctic ice in general.
Last updated on 14 February 2023 by John Mason. View Archives


I disagree that 2013 is included, otherwise the quotes: "Between 2010 and 2013", "We use 3 years of Cryosat-2 radar al..",
and:
"are now 31% greater than over the period 2005–2010".
imply that 2010 gets counted twice, once in each dataset?
Jetfuel, you seem to be implying that continuation of a predicted trend is somehow evidence for something new and different in Antarctica. Do you seriously believe that ice loss from the ice sheets has stopped? What is going to be your reaction to the next cryosat result? Do we get a retraction?
Again, it would help if you would actually state the point you are trying to make here. Why are you so hung up on Antarctica sea ice?
jetfuel @276, from McMillan et al (2014):
CryoSat 2 was launched in April 2010, and became officially operation in October 2010. The reason for the "overlap" in 2010 is simply that McMillan et al relied on earlier studies which extended into 2010. It is not clear, however, that those studies extended their data up to include Nov 2010 in any event, in which case there is no overlap.
Regarding recent ice loss data from Antarctica, I was surprised Figure 5 from Williams et al (2014) hasn't made its appearance on this comment thread yet. For the present on-going chatter, it doesn't advance the data beyond that mentioned by jetfuel @270 but it do allow sight of what is the actuality by way of, as jetfuel puts it @274, "Things can change significantly in one year," and perhaps may also stop the trolling on whether years are inclusive or exclusive to some time period.
Thank you Tom.
I note that Tom actually read the cited peer reviewed article. Jetfuel did not read the paper he was criticizing.
tomcurtis@268 states: "So, Antarctic sea ice extent is in uncharted territory, but only if you are carefull not to look at charts that might bust your pet theory."
per NBC news: "More sea ice than ever around Antarctica,"
Whose Pet theory?
michaelsweet@280 says:
"Thank you Tom.
I note that Tom actually read the cited peer reviewed article. Jetfuel did not read the paper he was criticizing."
I wasn't criticizing it. I did read it, and the bold quote of Tom's from the paper is not visible to me in the report. When I googled his quote, I got SS as result?
The paper does state that for the period from 2010 to 2013, the avg ice level is falling at 1.9 cm per year and that there is a 105-130 Gt per yr loss of ice mass. Considering there are 30,000,000 Gt of ice there, and a single 2009 snowfall in East Antarctica deposited 200 Gt of snow, and the report stating that the vast majority of Antarctica is stable, forgive me for thinking that this years 1960'sish sea ice levels down there could have made West Antarctic land ice more stable. How many years of -100 Gt per year until we can round 30 million down to 29.9? 10 centuries by my math.
I for one would say that jetfuel's 'science by news headline" in #281 and disingenuity in #282 are a sign that jetfuel has worn out his welcome.
jetfuel @282, googling a sentence is not the same as reading the article. Nor is failing to read the article is not evidence a sentenc is not in that article. It is only evidence that your approach is evidence free. For your benefit, however, here is the sentence with sufficient context to easilly locate it within the article:
Jetfuel @281, your pet theory.
That NBC made the same error as you six days after you made it does not prove you derived your theory from them. Nor does NBC claiming something relating to science to be fact prove it is, given the notoriously poor standard of scientific reporting by MSM.
Further, trying to score rhetorical points of a point where you have already acknowledged your error (@274) just makes you look silly. Are you now trying to take that back (with a complete absence of relevant evidence)? Or are you just trying to sow as much confusion as you can? Either way you have just ratcheted your credibility another notch lower.
Composer 99 @283, I take it then, you do not subscribe to the theory that deniers making themselves look utterly stupid is not a good antidote to the disease in other readers?
Jetfuel has still not actually revealed what point he is trying to make. Obviously the increasing sea ice around Antarctica is significant for him but he has failed to communicate why. The latest seems to be because the trend has continued, somehow a contributing factor (ice sheet melt) must have stopped. This is consistant with other behaviour that places enormous significance on an individual point rather but ignores the trend (eg 2009 ice fall is latest but see also the cherry picking here). Comment 282 would imply he either hasnt looked at or doesnt understand the graphs helpfully posted by MA Rodgers. Unless jetfuel actually articulates his case, I dont think there is much point continuing. We just see repetition and a complete resistance to learning anything.
Tom Curtis @285: Deniers making themselves look the fool is well and good, however enough exposure to the same commenter who trots out the same shtick, over and over, eventually just wears out my patience.
Skeptical Science does a good job of not being overrun with deniers in the comments (as compared to, say, dana1981's blog at The Guardian) but even so I am sure I am safe in assuming there will be no shortage of deniers posting here to maintain a more-or-less constant flow of foolishness (to say nothing of any foolishness posted by yours truly).
-----
To keep this comment on topic, I did a Google Scholar search with the terms 'antarctic sea ice history' and found a few papers that might be of interest when it comes to Antarctic sea ice and its extent (especially in light of jetfuel's claims with respect to same):
- Gersonde and Zielinski 2000 (link), which reconstructs Antarctic sea ice during the late Quarternary
- Crosta et al 2004 (link), which does the same in a geographically limited area (the Southern Ocean - Indian Ocean boundary, effectively)
- Rayner et al 2003, already referred to by Tom Curtis upthread (via Tamino - Tamino's blog post has a link to the paper).
These papers are unfortunately behind paywalls for me, but as I said they may be of interest when thinking about the current state of Antarctic sea ice, especially any part of the G&Z and Crosta reconstructions occurring in the Holocene.
My apologies in advance if someone else has already shared one or both papers in a previous comment on this thread. (I have performed a cursory search and believe that not to be the case, though.)
Jetfuel,
It would be nice if we could use the rate of ice loss from three years ago as the rate loss for the future. Unfortunately, the data MA Rodgers provided at 279 shows a continually increasing loss of ice. You must include the rate of increase of ice loss. Then we see that it will not be so long before Miami no longer drains after heavy rains. Your fact free ramblings are not convincing.
I was intrigued by jetfuel's comment @282 concerning McMillan et al (2014):-
How to make sense of that? The quote is apparently quite promanent within the "report" (as quoted @284) and, with Antarctica being 14 million sq km, an annual 1.9cm fall in ice level would of course result annually in 7mm SLR and 2,660 Gt mass loss. Further the 105-130 Gt figure is not the finding of McMillan et al. and also is not specifically for the period "from 2010 to 2013." This comment from jetfuel is totally nonsensical, something not of this planet.
And so it proved.
I tracked down only one potential source and that is where you would expect to find it - the planet Wattsupia. There, back in May, they gathered all the populus at the feet of an idiot called Larry Hamlin who was greatly angered by the reporting provided by The Guardian about McMillan et al. It is Loony Larry who quotes from McMillan et al. in which he doesn't provide sight of the "bold qulte from Tom." However the 105-130 GRACE figures appear, as does the mention of "the exceptional snowfall event of 2009, which saw an additional ~200 Gt of mass deposited in East Antarctica," just as jetfuel has been banging on about down this thread. And while the "falling at 1.9cm per year" is absent, a 0.19mm SLR contribution is mentioned which presents a possible source of a grossly misquoted figure.
And if anyone is in the slightest bit interested by Loony Larry's thesis, it can be summarised thus:- The Guardian is outrageously alarmist. There is no "doubling" of ice loss and obviously so. Does not McMillan et al. state that it' findings are "consistent" with other studies, so it can't have found a doubling. The Guardian confuse "two distinct issues." The "doubling" is not the rate of ice loss but the SLR contribution which has doubled from 0.19mm pa to 0.45mm pa. Of course Loony Larry says it better than I do. When I summarise his argument, I seem to make him sound like a congenital idiot.
Composer 99 @287, the first to papers you link to study late quaternary (ie, 2.6 million years ago to present) fluctuations. As such they mainly report differences in sea ice extent between glacials and interglacials. Not having read more than the abstracts, I cannot comment on how accurate they are for distinguishing differences in Holocene sea ice extent.
Perhaps more usefull are the proxy studies using MSA in ice cores, which show regional variations in Antarctic sea ice extent. Thus we have Curran et al (2003) showing Antarctic sea ice extent of East Antarctica near Law Dome (80 to 140 degrees Longitude).
I got the 1.9 cm from here in the report linked in michael sweet @273:
"Results
The CryoSat-2 observations confirm the continuation of existing signals of elevation change [Pritchard et al., 2009; Shepherd et al., 2002, 2012; Wingham et al., 1998; Zwally et al., 2005], identify regions which have evolved since previous surveys, and allow investigations of new terrain. Between 2010 and 2013, the average elevation of the Antarctic ice sheet fell by 1.9 ± 0.2 cm yr−1. Although most of the observed changes are smaller than expected fluctuations in snowfall (Table 1), those that are not coincide with areas of known dynamical imbalance (basins 13, 18, and 20 to 22) or with episodes of anomalous snow accumulation (basin 6) [Lenaerts et al., 2013]."
And quoting from the discussion section, I got the 105-130 Gt numbers:
"At the continental scale, the most recent estimates of Antarctic ice sheet mass balance are based solely on satellite gravimetry surveys [Barletta and Bordoni, 2013; Velicogna and Wahr, 2013; Williams et al., 2014]. According to these studies, the rate of ice mass loss from Antarctica has increased progressively over the past decade and, between 2010 and 2012, fell in the approximate central range 105 to 130 Gt yr−1"
MA Rodger @279 has a graph showing only 58 Gt per year loss. I am impressed that the snow/ice layer boundary depth can be determined by a satelite, and I am assuming they are ignoring the snow. I had been pondering the 1.9 cm per year ice depth loss as not much at the point where the ice is 13,200 feet thick, but as an avg across the entire continent, is seems like a lot and now i read it is way off base. ratioing the 58 to 2660 Gt calcs above, I convert the 1.9 cm to 4 mm of ice mass loss spread across the entire continent. Of course, 4 mm is an average and the concern is at the places that are falling at 9 m per year.
I'm sure there are easily a dozen different sources stating that this year is setting records. Me and NBC aren't the only ones getting it wrong. In this case, I'm in with a bunch of other idiots who are getting it wrong. From NOAA in August this year (2014): "This was the largest August Antarctic sea ice extent on record, surpassing the previous record set just last year"
I compared the Nimbus 1 data from 1964 with this week's extent and there are plenty of areas that have farther reaching sea ice now than then, out off Ross Sea for instance.. Granted, it is a crude comparison, roughly scaling maps from Charctic, and there are areas of greater extent from 1964.
Jetfuel - and your point is? We know the seaice is a record for recent times - if the conditions that create seaice trend continue, then upward trend will continue. So what? What do you see as the significance of this?
Jetfuel - Yes, there is currently a small (barely statistically significant, IIRC) increase in Antarctic sea ice extent.
But this small increase, likely due to increased surface fresh water from land ice melt, increased halocline inhibiting mixing from (relatively) warmer deep water, and wind changes, is but a flyspeck on the wall compared to the observed mid-20th century 25% decline in sea ice extent (de la Mare 1997).
You seem to be repeatedly arguing that recent Antarctic sea ice extent is somehow contradictory to observations of a warming globe - and even leaving out the masses of evidence such as thermometers, the Arctic, growth zones, etc, focusing entirely on Antarctic sea ice extent, that's just nonsense.
Jetfuel @291, McMillan et al's own finding about the rate of mass loss from 2010-2013 is 159 +/- 48 Gtonnes per year, as detailed in table 1, and also in the sentence immediately following that which you quote, and which reports other results. That is 65% of the mass loss expected if we assume the 1.9 cm per year is all ice. Ergo they have included both snow and ice loss in the calculation, and difficulty distinguishing between the two accounts for the increased uncertainty in the mass figure relative to the altitude figure (30% vs 10%).
In your post @282 you wrote:
And here is the relevant quote from the paper:
I have italicized your quote @291, from which you also derived the total figures @282. I have bolded the sentence which reports McMillan et al's own result. The following sentence contains the only mention of the 200 Gt snowfall in 2009 in the paper, a snowfall you have mentioned several times including @281. Clearly you have read the paper's report of its own result for it lies immediately between two sentences you have clearly read. Depite that you chose to report other paper's results rather than those of the paper under discussion, and what is worse, left the impression that you were quoting this paper's results when you did so. This looks to me like a very open and shut case of deliberate misrepresentation of the paper. How the moderators choose to view this clear dishonesty, and act on it is up to them.
Scaddenp @292, Tamino made that claim a couple of years ago, when it was true. Since then Antarctic sea ice has continued to expand and the expansion is now statistically significant, and was in most of 2013 as well:
Indeed, by pixel count, the Antarctic sea ice extent lies at approx 4 Standard Deviations above the mean for the satellite era. Of course it is well below that of the pre-satellite era, and approx 10% below that of the 1960s as shown by HadISST (contrary to Jetfuel's claims above).
Further, although is also a possibility of an error in baselining a transition between two satellite records that has been raised by Eisenmann et al (2014) and discussed by Tamino. Even if accepted, which the NSIDC does not (I believe), that only accounts for 0.2 million square Km of the record, and the trend is still significant. It does not place the satellite era record under threat.
Sorry, Scaddenp, your mention of "significant" along with KR's discussion of statistical significance seems to have made my mind to skip a few lines and (I suspect) start teaching my grandma to suck eggs. Just take my comment as a general comment with relevant information and ignore the fact that I addressed it to you.
Of course, we all make mistakes. Indeed, I managed to trip over a decimal point myself @289 by converting 1.9cm into 19cm. The trick is to correct mistakes and not compound them.
jetfuel @291.
Your explanation for where you obtained your numbers is helpful but it also indicates that you are entirely inattentive to what the numbers you present here actually represent.
@291 for instance you say that @279 I have "a graph showing only 58 Gt per year loss." This you apparently consider as "only 58 Gt pa" because you are comparing it with the preceeding quoted sentence "According to these studies, the rate of ice mass loss from Antarctica has increased progressively over the past decade and, between 2010 and 2012, fell in the approximate central range 105 to 130 Gt yr−1."
What you fail to appreciate here is that the graph reproduced @279 is Figure 5 from Willams et al (2014). This source is made palin @279 and you will note that in the quote you present @291, one of "these studies" helpfully listed by the quote is the very same Williams et al (2014). Hey, and guess what? A quick regression of the Williams et al. data for 2010-12 yields 107 Gt/yr. You of course are quoting the average for 2003-12 which will be different if there is an acceleration involved which there obviously is.
You are also wrong @291 suggesting the 105-130 figure came from this discussion thread. I see no sign of it prior to you introducing it @282.
And "these studies" do not determine "the snow/ice layer boundary depth" as your comment suggests. "These studies" use GRACE gravity measurements.
And you may take comfort that such a small proportion of Antarctica is melting away each year but the point is not to preserve Antarctica as a frozen continent. It is to prevent damaging SLR. If Antarctica were to melt to nothing (and the way humanity is acting, that is not so silly on a multi-century time scale) it wound drown 90% of present human endeavour.
You are probably at liberty to call the NOAA "a bunch of idiots". They likely get called worse fro time to time. But it is you that is wrong in saying the NOAA is "wrong". Their quote of a record breaking August this year is helpfully accompanied by a graph illustrating the record which is thus obviously the record since 1979.
And yes, we are all comforted that Antarctic Sea Ice is not yet showing the slightest sign of collapse, but that does not make up for melting cryosphere everywhere else in the world. And perhaps, because Antarctic Sea Ice is not part of some grand global equasion, it is also off-topic in this comment thread.
Physicist and space scientist Dr. Duncan Steel has recently discussed how well-known variations in Earth’s orbit around the Sun result in variations in the solar flux received at different latitudes and at different times of year, which are in accord with observed climate changes, independent of effects due to anthropogenic global warming. Dr. Steel finds that the most substantial variations are occurring at high latitudes across spring: in the northern hemisphere the spring insolation is increasing markedly, while in the southern hemisphere the insolation across austral spring is reducing. In itself this might be anticipated to result in what is actually observed: record melting of ice and snow cover in the Arctic, while there is year-on-year growth of Antarctic sea ice. See: http://www.duncansteel.com/archives/996. Dr. Steel seeks independent confirmation of his calculations, and welcomes comments, but only on the substantive subject of how Earth’s shifting orbit is affecting the insolation received at different latitudes and different times of year in the present epoch.
[PS] Fixed link
karly @298, let me first note how silly I think it for people who, having observed an effect that could alter the climate, then automatically assume it is more important than the enhanced greenhouse effect without comparison. In this case Steel concludes is essay for a hypothesis he has not presented for peer review, by saying:
As it happens, he is claiming AGW is a smaller contributing factor because the difference in his calculation sprind insolation (on a particular day) over a 1000 years is greater than the radiative forcing over the last 250 years. The effect he calculates appears, however, to be linear over time. From his figures, the effect of the last 250 years is 0.6 W/m^2 on that particular day, ie, less than a third of the radiative forcing over that period. What is more, the effect is not an annual effect (as is the case with the radiative forcing from greenhouse gases). In fact, the total effect sums to zero over the course of the year so that the net forcing from his mechanism is in fact zero. Unless you wish to entertain a change in the laws of thermodynamics so that they only apply on the spring equinox, that alone refutes his conjecture.
Further, his theory does not even match the evidence. As noted, his theory predicts a near linear change over the last thousand years. Temperatures, however, have on average declined over the first 750 of those years - something AGW "skeptics" are famed for noting. The transition from the MWP to the LIA is a direct observational refutation of his theory. So also is the southern hemisphere warming which he is determined to neglect but which is certainly occurring.
That, however, may not be the worst part of his theory. He makes a very big point of the fact that Berger (1978), from whom he draws his algorithms, uses the equinoctial method to calculate daily insolation in preparing his daily insolation tables, often used by climate scientists. Berger, however, does not state that. He defines a method for determining the insolation using the equinoctial method, then provides formula to calculate the calendar day method (see section 3 of Berger 1978). That being the case, the majority of the effect Steel finds may simply be due to his using the wrong method, and therefore introducing a drift into his calendar. That is, he may be making the same error he accuses climate scientists of.
Regardless, his refusal to calculate a total year energy balance, inflation of the effect by using unequal comparison times, and neglecting of straightforward empirical disagreements with his theory render it an example of pseudo-science, not science. I would not waste my time on it.
Mr Curtis, your criticisms are wasted on me. I am not a physicist, astronomer or climate scientist, nor am I associated in any way with Dr Steel. I have only a layman’s interest. If you believe his analysis is erroneous, please respect his request, and discuss the matter with him directly.