


 Arguments


What has global warming done since 1998?
What the science says...
| Select a level... |
 Basic
Basic
|
 Intermediate
| |||
|
Every part of the Earth's climate system has continued warming since 1998, with the ten record temperature years all occurring since 2010. |
|||||
Climate Myth...
It hasn't warmed since 1998
For the years 1998-2005, temperature did not increase. This period coincides with society's continued pumping of more CO2 into the atmosphere. (Bob Carter)
At a glance
This date-specific talking-point is now something of a historical curiosity, but we'll leave it in the database for now because it's such a good illustration of the simplistic yet reckless mindset of the serial climate change misinformer. And indeed, we could (out of sheer mischief) have revised this myth by replacing "1998" with "2016". In fact, that's what we started to see in the climate change misinformation stream, © the Usual Suspects. But 2023's record temperatures put a stop to that.
Anyway, as first predicted over a century ago, Earth's surface, oceans and atmosphere are all heating up. That's due to our increasing greenhouse gas emissions, but over the years the warming has occurred at varying rates. This should in no way come as a surprise. Other physical phenomena periodically act either to suppress or enhance temperatures.
A prime example of such a phenomenon is the effects of La Nina and El Nino. This natural climatic oscillation features variations in winds and sea surface temperatures over the tropical eastern Pacific Ocean. The cycle can at times strongly influence temperature and rainfall patterns right around the world.
In a La Nina year, temperatures are suppressed, whereas an El Nino year sees them enhanced. This is noise on the long-term upward trend. That's why climatologists work with multiple decades, not just a few years in isolation, in order to get a grasp on what is going on.
The year 1998 featured a massive El Nino. The temperature spike it caused was a huge outlier, like a pinnacle towering over the landscape of the temperature record. In the following years there was a return to more typical conditions, with an erratic but upward warming pattern. That sequence of events gave deniers a brief opportunity to insist that global warming had “paused” or had even stopped.
You only need to remember one thing here. Those who create and spread misinformation about climate change don't care about reality. Public confusion is their aim. In this instance, the misinformation exercise involved deliberately selecting a limited block of years starting with the massive El Nino of 1998 and using that very warm starting-point to insist that global warming had stopped. They knew this would likely work for a few years and that the public would quickly forget why that was the case. Mother Nature had handed them a gift. It was an irresistible bunch of low-hanging fruit to exploit: little wonder the tactic is known as 'cherry-picking'.
Talking about reality, what actually happened? Well, as of 2024, a couple of decades down the line, the top ten warmest years have all been since 2010, whatever observation-based dataset you choose, with eight of them being in the 2015-2023 period. 1998 is nowhere to be seen any more. By modern standards, it simply wasn't warm enough.
Please use this form to provide feedback about this new "At a glance" section, which was updated on May 27, 2023 to improve its readability. Read a more technical version below or dig deeper via the tabs above!
Further details
Even if we ignore long term trends (something deniers often do in order to make a point) and just look at the record-breakers, as of early 2024 the top ten warmest years have all been since 2010, whatever dataset you choose, with eight of them being in the 2015-2023 period. In this top ten grouping, 1998 is nowhere to be seen any more. It was not warm enough.
The myth of no warming since 1998 was largely based on the satellite record estimates of the temperature of the atmosphere. However, as discussed in the video below by Peter Sinclair, even that argument is no longer accurate. The satellites show warming since 1998 too.
There's also a tendency for some people just to concentrate on atmospheric or surface air temperatures when there are other, more useful, indicators that can give us a better idea how rapidly the world is warming. More than 90% of global warming heat goes into warming the oceans, while less than 3% goes into increasing the atmospheric and surface air temperature. Records show that the Earth has been warming at a steady rate before and since 1998 and there is no sign of it slowing any time soon (Figure 1).
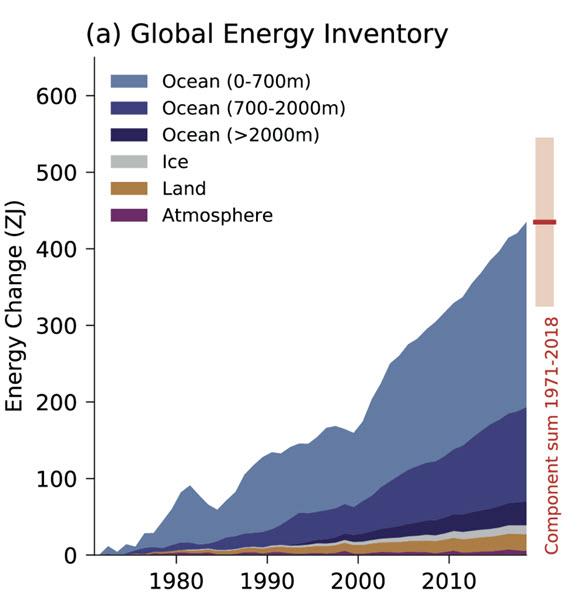
Figure 1: Global Energy Inventory: observed changes in the global energy inventory for 1971–2018 (shaded time series) with component contributions as indicated in the figure legend. Cross-Chapter Box 9.1 Figure 1 (part a) - From IPCC AR6 WGI Chapter 9.
Even if we focus exclusively on global surface temperatures, Cowtan & Way (2013) shows that when we account for temperatures across the entire globe (including the Arctic, which is the part of the planet warming fastest), the global surface warming trend for 1997–2015 is approximately 0.14°C per decade.
Ultimately, every part of the Earth's climate system is warming, and has continued warming since 1998.
Last updated on 8 March 2024 by John Mason. View Archives


"What's wrong with this graph"?
It's mislabeled. WATTS and company can't add - that's 15 years, not 16. It's also been shifted - the real data on that is from August 1997 to August 2012, not the beginning of 1997 and the end of 2012. Also, the values have been altered. The first one should be less than .5*C and the last higher. It's been fudged, in other words.
"The Hadley Centre/CRU records show no warming for 18 years (v.3"
False. v.3 shows about .14*C of warming over that period globally.
"or 19 years (v.4),"
Even more false. The trend is bigger with v.4 - about .17*C of warming over the last 18 years and about .2*C over the last 19.
"and the RSS satellite dataset shows no warming for 23 years"
Spectacularly incorrect. RSS shows about .28*C of warming over the last 23 years.
"h/t to Werner Brozek for determining these values"
Hat tip for feeding you false data? Seriously? Where's your skepticism?
"temps have been rising slowly since the middle ages"
So, you're a LIA denier too?
"sorry gotta go catch ya later"
Ah, hit and run. Next time, why not come back with correct info?
Warren, firstly your posts on SkS have demonstrated an argumentative rhetorical tone. This is not conducive to discussion of science and is likely to irritate the other participants in the discussion, which reflects more badly on you than on anyone else. Please give it a rest.
So "What is wrong with the graph?"
(i) It is an example of cherry picking start and end dates. If you have a time series with an upward trend that is small in comparison to the magnitude of the noise, then it isn't surprising that you can choose start and end points where the noise temporarily masks the trend. However that doesn't mean the trend has gone away. This can be easily demonstrated by constructing a synthetic time series with an upward trend (so you know it is there by construction) and observing that you can still cherry pick periods where this trend is masked.
(ii) Trends are not measured by noting the difference in temperature at the start point and the endpoint as this is to sensitive to the noise to have any statistical meaning. Instead scientists use least-squares linear trends, often adjusted to take account of the autocorrelation.
(iii) The anlaysis makes no mention of statistical significance, nor of the statistical power of the test (which is very important if you want to claim that there has been no warming since 1998, I'd be happy to explain this in more detail when you respond to my post).
[JH] I have deleted a number of Warren Hindmarsh's comments because they were off topic and/or slogannering. He definitely needs to loose the snarky tone. He also should read and adhere to the SkS Comments Policy.
Warren Hindmarsh - I've discussed this particular topic with Werner Brozek at some length, for example at Spencers blog. You, unfortunately, appear to have some of the same misconceptions regarding statistical significance - it's possible to cherry-pick an interval that shows any conclusion you wish, as long as you avoid using all of the data. But short periods are not statistically significant, there is insufficient data to make a claim one way or another.
As I have mentioned before on these threads:
For any of the instrumental series, over any time span ending in the present:
Claims otherwise, such as your repetitions of 'skeptics' elsewhere, are demonstrably wrong.
Warren, well worth reading the Guardian's reporting on James Hansen's BBC R4 comments this mornng (here), in particular:
Prof Hansen, speaking to BBC Radio 4's Today programme, rejected both arguments. "In the last decade it has warmed only a tenth of a degree compared to two-tenths of a degree in the preceeding decade, but that's just natural variability. There is no reason to be surprised by that at all," he said. "If you look over a 30-40 year period the expected warming is two-tenths of a degree per decade, but that doesn't mean each decade is going to warm two-tenths of a degree: there is too much natural variability."
To further Dikran's point, consider the trend of 1992-2007. Using Had4, the trend is 0.3C per decade. That's approaching double the expected rate of warming. According to your logic, climate scientists should have declared that they had seriously underestimated the rate of warming. No. It's a short-term trend. And it's a cherry-pick. And it covers half of your 16-year period. You can try to reconcile all that, or you could actually engage a critical thinking process and try to understand the forces at work that create the state of the surface temp -- like scientists do.
One more thing, Warren: when you say "no warming" you immediately reveal yourself to be ignorant about the science. You complained about the accuracy of the survey titling. Now you want a free pass for using an insignificant portion of the thermal capacity of the climate system (the troposphere) to represent the whole shebang. Ignoring OHC is deceptive . . . or ignorant. Your response will determine my choice.
For #40 and #50. Have you check Argo Project? It seems NO. Argo project the most serious study of the T and sea levels didn't observe increase in the T. It's true that it a new project (since 2005) but data is more accuracy.
(Rob P) You can use the search function to find a response to most climate-related questions. For example on the observed warming of the oceans:
1. Ocean Cooling Corrected, Again
2. Levitus et al. Find Global Warming Continues to Heat the Oceans
3. Nuccitelli et al. (2012) Show that Global Warming Continues
4. Observed Warming of the Ocean and Atmosphere is Incompatible with Natural Variation
5. New Research Confirms Global Warming Has Accelerated
Chemasan, the methodology of Levitus et al. (2012) includes Argo data. Go here to see the results. If you choose Jan-Mar on any of the 3-month sets, you'll get up to 2013. I strongly suggest using the 0-2000m set. Here's global 0-2000m for all months:
2005-3 8.972987
2005-6 9.391529
2005-9 9.681848
2005-12 12.636982
2006-3 11.932278
2006-6 12.998004
2006-9 12.264493
2006-12 13.356965
2007-3 13.49815
2007-6 11.382808
2007-9 12.277043
2007-12 12.418795
2008-3 13.305184
2008-6 14.606297
2008-9 13.024848
2008-12 12.090649
2009-3 12.614719
2009-6 12.241169
2009-9 13.816815
2009-12 15.052814
2010-3 15.881298
2010-6 13.484779
2010-9 13.959781
2010-12 14.823184
2011-3 15.215552
2011-6 14.630487
2011-9 16.870249
2011-12 14.859973
2012-3 17.308126
2012-6 15.461417
2012-9 15.34632
2012-12 16.630146
2013-3 19.332438
The annual running average produces a linear trend of +1.74*10^21 joules added per year.
Could someone please respond to the peer-reviewed paper published yesterday in the International Journal of Modern Physics B by professor Qing-Bin Lu of the University of Waterloo, COSMIC-RAY-DRIVEN REACTION AND GREENHOUSE EFFECT OF HALOGENATED MOLECULES: CULPRITS FOR ATMOSPHERIC OZONE DEPLETION AND GLOBAL CLIMATE CHANGE?
"Conventional thinking says that the emission of human-made non-CFC gases such as carbon dioxide has mainly contributed to global warming. But we have observed data going back to the Industrial Revolution that convincingly shows that conventional understanding is wrong,” said Qing-Bin Lu, a professor of physics and astronomy, biology and chemistry in Waterloo’s Faculty of Science. “In fact, the data shows that CFCs conspiring with cosmic rays caused both the polar ozone hole and global warming.”
"Most conventional theories expect that global temperatures will continue to increase as CO2 levels continue to rise, as they have done since 1850. What’s striking is that since 2002, global temperatures have actually declined – matching a decline in CFCs in the atmosphere,” Professor Lu said. “My calculations of CFC greenhouse effect show that there was global warming by about 0.6 °C from 1950 to 2002, but the earth has actually cooled since 2002. The cooling trend is set to continue for the next 50-70 years as the amount of CFCs in the atmosphere continues to decline.”
Quoted from Waterloo News, May 2013
[DB] Refuted here:
http://www.climatesciencewatch.org/2013/05/31/qing-bin-lu-revives-debunked-claims-about-cosmic-rays-and-cfcs/
This is off-topic; please return the conversation to the topic of this thread.
Thank-you and sorry for the misplacement (also the all-caps.) I note Lu made the claim in the quoted interview that there has been no warming since 2002.
Why does the top video say "This video is private." ? It was playing okay a few weeks ago and I sorely need it right now for point of reference. I'm confused.
[DB] The video has been withdrawn to better enable updates and revisions to come.
Hi; On the issue of the video being private. Any ETA on when the updated versin will become available? It's a really nice explanation and I'd love to pass it along to some friends for whom such visual representations are more compelling.
whd
For all the posts I read about the warming trend having apparently stabilized I don't find any arguments for enthalpy as a sink consuming vast amounts of excess atmospheric heat. I've only had a basic technical physics education so, while I feel a bit out of my class trying to contribute something substantive to the discussion, a review of the chapter on Properties of Heat and Heat Transfer in my physics text raised my eybrows relating to this topic.
1 calorie of heat will raise the temperature of 1 gram of water 1 degree Celsius.
Effect of Enthalpy - To raise a gram of water the degree across which it changes state from ice to liquid requires 80 calories in order to break down the crystaline structure of the ice.
Eighty times as much is an enourmous increase in heat consumption and since enthalpy is taking place in the worlds ice packs it can be considered work that the global heat is doing. While it's somewhat valid for the denier to observe a levelling off global atmospheric temperature, wouldn't it be helpful to direct their attention to the fact that the world's ice has been melting at an alarming rate at the same time this "levelling" has been apparent? In my somewhat elementary view the world's ice is a great heat sink which, at its melting point, is consuming enormous amounts of excess heat from the atmosphere and from sea water. This is the work the heat is accomplishing. This is basic physics and I believe most deniers have the mechanical aptitude to wrap their minds around that concept. I haven't seen this accounted for in any climate science articles or graphs. I just think that, if my physics isn't off the mark, if enthalpy does account for a significantly stabilizing effect on global temperature, then it might be helpful to spin some easy to read and understand pictures about it.
At any rate, I don't have the capability to scale the above argument up to the climate equation and am interested to know if it's valid and how significant is it? I don't like to think about what the temperature graphs will look like when the ice packs are gone.
Can anyone point out the errors in this recent paper?
http://hockeyschtick.blogspot.co.uk/2013/08/new-paper-finds-climate-models-have.html
For the most part it looks like another rehashing of the "we are actually cooling (or staying steady)" argument.
I did some research and found out that the principle author, John C. Fyfe was a participant of the IPCC 4AR. So it would seem that he is not a denier, and is in fact a supporter. So I am not sure what to make of this comment:
source: http://hockeyschtick.blogspot.co.uk/2013/08/new-paper-finds-climate-models-have.html
So, my question is, has it gotten warmer in the last 15 years, or not? Does it matter? If it doesn't matter, then why is he bringing it up? He doesn't really make a big deal about it in the rest of the paper, which seems mostly focused on the models. I get that the model isn't important to whether or not climate change is real, so that is not what my question is about.
MrGibbage, by what measure? Ocean heat content shows no "hiatus" over the period, and it makes up 90%+ of the effective thermal capacity of the climate system. Global ice mass loss makes up another 2-3%, and it has accelerated over the surface "hiatus" period. Further, if you run a 30-year linear from 1975 to 1998, you get 0.163C per decade, and that doesn't factor in the lower transient response of the period's earlier years. If you run 1975 to 2008, you get 0.19C per decade. So when did the "hiatus" begin?
Further, could Fyfe not have written this in 1995? The trend from 1981 to 1995 is 0.0879C per decade. The trend for 1997 (capturing the full 97/8 El Nino) to present is 0.071C. Not far apart. The trend from 1981 to present is 0.161C per decade.
All Fyfe is saying, to me, is "models are sketchy at projecting short-term surface temp fluctuations," which, of course, everyone already knows.
Now, has global warming "paused"? Or has the surface temp trend "paused"? Slow day at the Fyfe office, especially since five bajillion people have already covered the issue. Have you read Kosaka & Xie 2013? Does HockeySchtick provide fair and balanced coverage of it?
DSL, thanks for replying. I know HockeySchtick is a typical denier website. But it has the full text of Dr. Fyfe's report for free. At the nature website where it was originally published, you have to pay for it.
http://www.nature.com/nclimate/journal/v3/n9/full/nclimate1972.html?WT.ec_id=NCLIMATE-201309#affil-auth
So I am not interested in the way that HockeySchtick is trying to use it. They are focused on the model inaccuracy--yeah yeah, I get it--the models are inacurate for short term, which is the point of the paper. I only have issue with the point that he made suggesting that the temperature hasn't increaded in fifteen years. Which to me is strange because he seems to be well regarded in climate science and even served on the IPCC.
I am not a climate scientist--I'm just a guy that reads a lot of science stuff and I am trying to convince a denier friend of mine that climate change is real. He found this report (which is written by a real climate scientist) and found the line suggesting that there hasn't been any increase and is using it as evidence that there is no climate change. I feel like Dr. Fyfe is on our side, but when he drops a stat like that and doesn't go into any more detail, then I am confused. I am pretty sure he knows about ocean heat content making up 90% of the thermal mass. So I think the statement that the temperatures haven't changed in fifteen years actually means something other than how I am interpreting it.
I don't know what Dr. Fyfe's motives are, but when he drops a line like that, it sure makes me think he is a denier, which just adds to my confusion.
He has his email address on his bio page here:
http://www.ec.gc.ca/ccmac-cccma/default.asp?lang=En&n=AD427C5F-1
Maybe I should just email him and ask.
MrGibbage,
I think one should not automatically assume there something is wrong about the paper, or that the author is a denier; this is particularly so since this is a piece in Nature Climate Change (not some obsure Journal where the editorial standard may be questionable), and as you said John Fyfe is a respected climate scientist.
@IanC, I tend to agree with you, which is what makes me think I am misunderstanding what he is saying there.
I actually sent him an email. It will be interesting to see what (or if) he writes back.
Oh, wow! I actually got a response from Dr. Fyfe. First my email to him and then his response below it.
Hello Dr. Fyfe. I am sure you are very busy, but for a long shot, I thought I would try and just ask you about a question I have about your report
Overestimated global warming over the past 20 years
http://www.nature.com/nclimate/journal/v3/n9/full/nclimate1972.html?WT.ec_id=NCLIMATE-201309#affil-auth
I am not a scientist, but I do like to read a lot of science papers and reports (mostly space stuff). I am a believer in climate change, but I have a friend that is a denier. I have a Master's degree in computer modeling and simulation, so I understand how models are supposed to work. I understand your point of the paper in that the CMIP model has been overestimating the global temperature for the last fifteen years, when compared to the actual temperature. The model needs fixing--I get that.
What I don't understand is your statement:
The inconsistency between observed and simulated global warming is even more striking for temperature trends computed over the past fifteen years (1998–2012). For this period, the observed trend of 0.05 ± 0.08 °C per decade is more than four times smaller than the average simulated trend of 0.21 ± 0.03 °C per decade (Fig. 1b). It is worth noting that the observed trend over this period — not significantly different from zero — suggests a temporary 'hiatus' in global warming
All of a sudden it looks like (the typical denier sentiment) that the planet is not getting warmer at all. Now, I know this was not the point of the paper, but I am confused by it, and my friend is using it as evidence that climate change is not real. Maybe that *WAS* your point, in which case I may need to rethink my stance as well. Or maybe I am misunderstanding what you meant. Is the planet getting warmer or not?
Anyway, if you have the time, perhaps you could explain it to me in somewhat layman's terms what that statement really means and how it should be interpreted.
Thank you, Sir, for your time.
Very Respectfully,
Skip Morrow
And Dr. Fyfe's reponse:
Dear Skip,
Thanks for your interest in our paper.
That the rate of warming has recently slowed down is well known. Not so well known are the reasons for this, although several lines of evidence suggest that it combines cooling impacts from reducing solar radiation at the top of the atmosphere, increasing reflecting aerosols in the stratosphere, and decreasing tropical Pacific sea surface temperatures -- which together are temporarily masking the warming impact from increasing greenhouse gases. None of these cooling impacts are expected to carry on very much longer, at which point we expect a period of rapid warming back the path the planet had been following for the last 100-years or so.
On a different topic, here is a new contribution of ours that was released today from the publishers of Nature.
http://www.nature.com/srep/2013/130912/srep02645/full/srep02645.html
Best, John
--
John C Fyfe, PhD
Senior Scientist, Canadian Centre for Climate Modelling and Analysis
Environment Canada
Ocean, Earth and Atmospheric Sciences Bldg., University of Victoria
e-mail: John.Fyfe@ec.gc.ca
off. 250-363-8236
fax. 250-363-8247
I think I understand now. It's a shame that so many denier websites are using this report to support their cause.
Thanks for posting the email, MrGibbage. The response clarifies Fyfe's position quite a bit.
So, if the point of this page at SkepticalScience is to suggest that the planet hasn't been cooling since 1998, and has in fact been warming, then who do we believe? Dr. Fyfe, who suggests that it hasn't cooled or warmed, or Skeptical Science? Does this page need to be updated?
Again, MrGibbage, the problem is in the wording. Whenever scientists use "global warming" to refer to global mean surface temperature, confusion is the result. I don't know why Fyfe did that in his published work. Note that he says "warming" in his email. I take "global warming" to mean the entire climate system, including oceans. One cannot talk about the future of GMST without factoring in the energy going into the oceans. That energy MUST come back through the atmosphere, so it's ridiculous to say that the theory of anthropogenic global warming is _________ based on any analysis that ignores ocean heat content.
In other words, when Fyfe says "global warming has paused," he's not saying that CO2 is suddenly not continuing to store more energy within the climate system. He's just saying that the accumulating energy is not, over time, uniformly going into the various components of the climate system. The top-of-atmosphere energy imbalance remains.
So my question to you is "what is 'the planet'"?
Hope this isn't considered political, but : Thank you for this site. As a "denier", it's nice to get answers to my questions without being called ignorant, stupid, or dishonest. This site is convincing. Thank you.
I'm no climate scientist andI like to keep things simple. Some things seem obvious.
Take a four-year rolling mean of the global surface temperature data. In the early 2000s it suddenly shoots off to the right. Let's assume the temperature rise has gone on holiday for a while, where did the heat go?
Take a four-year rolling mean of the PIOMAS annual minimum volume data. From the late 1980s to the early 2000s there's a reasonably linear trend of around -250 km^3 of ice lost per year. From the early 2000s to the present there's a linear trend of around -700km^3 (equivalent to more than 2*10^20J) per year.
All that heat is being absorbed in a constant-temperature process (melting ice). The latter trend line hits zero around 2017 (mid rolling year), so the heat will have no-where to go without increasing temperature somewhere. I suspect Arctic (and possibly global) temperatures will rise until the Greenland ice sheet can be pursuaded to lose 700km^3 per year, resulting in another, longer, pause in temperature rise.
If the correlation of this amateur spreadsheed graph analysis has validity, we'll find out what happens to global crop production under these new conditions within five years.
A graph I found of the global glacial mass anomaly also appears to have a kink, but I lack the original data to play with.
And no I don't know why a current four-year cycle seems to give a good fit.
That's my tuppence worth.
cpslashm @274, your theory is superficially attractive, but as it turns out the total energy going into ice melt is very small relative to the total energy being absorbed at the Earth's surface due to the enhanced greenhouse effect. Most (approx 90%) of that excess energy is being absorbed by the ocean. There is no reason why increased ice melt would draw that energy exclusively from the atmosphere, so it is very unlikely that your theory is correct.
As it happens, base on a number of different lines of evidence, the major cause of the reduced rate of increase of global surface temperatures has been a switch from El Nino dominated conditions to La Nina conditions. A further contributor, especially to the reduction in temperature indices that exclude the Arctic, has been a recent pattern of colder winters in mid-northern latitudes and warmer winters in very high latitudes. Because the warmer high latitude winters are not included in the observations, this shows up as a reduced overall rate of warming. There is an apparent connection to ice melt in this pattern, in that evidence suggests it is a lack of ice cover on the Arctic ocean causing this pattern. Finally, some recent volcanoes, an increase in anthropogenic aerosol emissions and reduced solar radiation have also contributed to the reduced short term temperature trend.
The exact contribution of each of these factors has not yet been determined. Indeed, there is some possibility that the combination of these factors explains more than the observed reduction in trend, ie, that the short term temperature trend would have accelerated were it not for this concatenation of factors.