


 Arguments


What has global warming done since 1998?
What the science says...
| Select a level... |
 Basic
Basic
|
 Intermediate
| |||
|
Every part of the Earth's climate system has continued warming since 1998, with the ten record temperature years all occurring since 2010. |
|||||
Climate Myth...
It hasn't warmed since 1998
For the years 1998-2005, temperature did not increase. This period coincides with society's continued pumping of more CO2 into the atmosphere. (Bob Carter)
At a glance
This date-specific talking-point is now something of a historical curiosity, but we'll leave it in the database for now because it's such a good illustration of the simplistic yet reckless mindset of the serial climate change misinformer. And indeed, we could (out of sheer mischief) have revised this myth by replacing "1998" with "2016". In fact, that's what we started to see in the climate change misinformation stream, © the Usual Suspects. But 2023's record temperatures put a stop to that.
Anyway, as first predicted over a century ago, Earth's surface, oceans and atmosphere are all heating up. That's due to our increasing greenhouse gas emissions, but over the years the warming has occurred at varying rates. This should in no way come as a surprise. Other physical phenomena periodically act either to suppress or enhance temperatures.
A prime example of such a phenomenon is the effects of La Nina and El Nino. This natural climatic oscillation features variations in winds and sea surface temperatures over the tropical eastern Pacific Ocean. The cycle can at times strongly influence temperature and rainfall patterns right around the world.
In a La Nina year, temperatures are suppressed, whereas an El Nino year sees them enhanced. This is noise on the long-term upward trend. That's why climatologists work with multiple decades, not just a few years in isolation, in order to get a grasp on what is going on.
The year 1998 featured a massive El Nino. The temperature spike it caused was a huge outlier, like a pinnacle towering over the landscape of the temperature record. In the following years there was a return to more typical conditions, with an erratic but upward warming pattern. That sequence of events gave deniers a brief opportunity to insist that global warming had “paused” or had even stopped.
You only need to remember one thing here. Those who create and spread misinformation about climate change don't care about reality. Public confusion is their aim. In this instance, the misinformation exercise involved deliberately selecting a limited block of years starting with the massive El Nino of 1998 and using that very warm starting-point to insist that global warming had stopped. They knew this would likely work for a few years and that the public would quickly forget why that was the case. Mother Nature had handed them a gift. It was an irresistible bunch of low-hanging fruit to exploit: little wonder the tactic is known as 'cherry-picking'.
Talking about reality, what actually happened? Well, as of 2024, a couple of decades down the line, the top ten warmest years have all been since 2010, whatever observation-based dataset you choose, with eight of them being in the 2015-2023 period. 1998 is nowhere to be seen any more. By modern standards, it simply wasn't warm enough.
Please use this form to provide feedback about this new "At a glance" section, which was updated on May 27, 2023 to improve its readability. Read a more technical version below or dig deeper via the tabs above!
Further details
Even if we ignore long term trends (something deniers often do in order to make a point) and just look at the record-breakers, as of early 2024 the top ten warmest years have all been since 2010, whatever dataset you choose, with eight of them being in the 2015-2023 period. In this top ten grouping, 1998 is nowhere to be seen any more. It was not warm enough.
The myth of no warming since 1998 was largely based on the satellite record estimates of the temperature of the atmosphere. However, as discussed in the video below by Peter Sinclair, even that argument is no longer accurate. The satellites show warming since 1998 too.
There's also a tendency for some people just to concentrate on atmospheric or surface air temperatures when there are other, more useful, indicators that can give us a better idea how rapidly the world is warming. More than 90% of global warming heat goes into warming the oceans, while less than 3% goes into increasing the atmospheric and surface air temperature. Records show that the Earth has been warming at a steady rate before and since 1998 and there is no sign of it slowing any time soon (Figure 1).
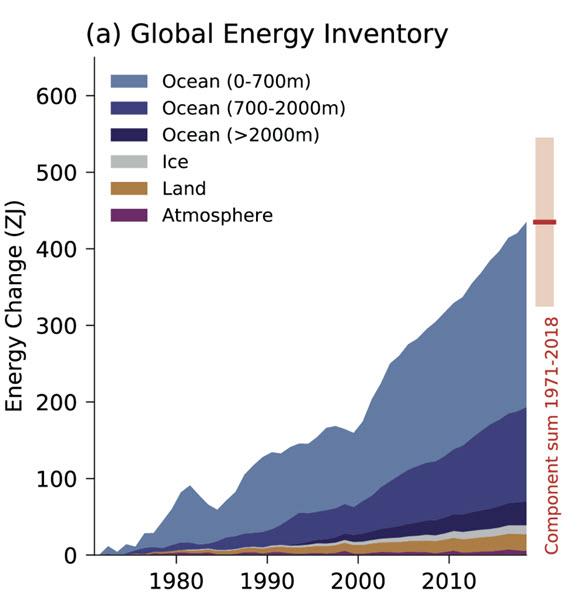
Figure 1: Global Energy Inventory: observed changes in the global energy inventory for 1971–2018 (shaded time series) with component contributions as indicated in the figure legend. Cross-Chapter Box 9.1 Figure 1 (part a) - From IPCC AR6 WGI Chapter 9.
Even if we focus exclusively on global surface temperatures, Cowtan & Way (2013) shows that when we account for temperatures across the entire globe (including the Arctic, which is the part of the planet warming fastest), the global surface warming trend for 1997–2015 is approximately 0.14°C per decade.
Ultimately, every part of the Earth's climate system is warming, and has continued warming since 1998.
Last updated on 8 March 2024 by John Mason. View Archives


Sorry again as I've been rushing this as I have to go out just now. The start date I chose was 2001 becasue to pick 2000 would have been cherry picking for AGW as there was a steep decline after the El Nino. Selecting 2001 as a start date seems to me to be a fair compromise if you look at the graphical trend.
Petter99 @324, the UAH trend from 2001 to current is 0.070 ±0.217 °C/decade. That compares to an IPCC projected trend over the interval of 0.2 °C/decade. That is, it is well within error of the IPCC projection. That the error margin on measurement is larger than the projected temperature rise, however, tells you that it is too short a period to test the theory.
The RSS data should be ignored. It uses the same basic data as UAH but the processing results in values distinctly different not only to UAH, but also to all other temperature records. Until it is found out why that is, and a correction made, it must be regarded as inaccurate for short term trends.
Beyond that, by shifting forward the start point to 2001, you eliminate the large El Nino at the start of the series, but increase the impact of the large La Nina at the end of the series. Ergo, based on what we know about climate states about the world, we know that that trend is low due to short term variability rather than due to a low value in the underlying trend. Indeed, without AGW, we would have expected the trend to be strongly negative. (That still makes it an improvement over the previous post. The claim based on 1998 can be refuted by statistics alone. With regard to a 2001 start, you need to know something more about the climate system than is contained in the temperature data itself.)
If you want to know what the trend is like without the impact of ENSO states, the simplest method is to compare the trends for El Nino year, La Nina Years, and neutral years:
As you can see, they are very similar, quite close to the IPCC projection, and have not changed in recent years. What has changed is that we have got more than usual La Nina years of late following on froma period of slightly more than usual El Nino years.
As to why we shoud not simply project the recent temperature trend, the forcing from GHG is not expected to remain constant, or increase linearly over the 21st century. Ergo it is silly to expect temperature trends to continue as though they are going to increase linearly. Particularly if you take a short term trend known to be reduced by a late occuring La Nina to project it. If you are going to project statistically from the temperature record, you should determine the relationship between forcings and that temperature record and then project according to the assumption that the relationship between forcings and temperature record will remain fairly constant. Dr Cowtan has a model that allows you to do this. You can even scale the forcings to see if you can get a better fit to temperatures than that embodied in the assumption that temperatures respond equally to all forcings. Good luck finding a fit that doesn't either obviously fail relative to the intuitive assumption of equal effect from different forcings over past temperatures, or else more or less reproduce IPCC projections.
Further, Peter, you claim to be an "AGW skeptic," but your argument is in regards to climate modeling. The theoretical basis of AGW does not emerge from climate modeling. The theory of AGW is simply that humans have enhanced the greenhouse effect, causing greater-than-natural warming. Climate modeling--and here I'll refer specifically to comprehensive general circulation modeling--projects climate change on the multidecadal scale and at fairly low resolution. The resolution is getting better (in some ways) in both time and space, but accuracy is not at the subdecadal scale yet.
All models of real world phenomena are inaccurate. Are they also then failures? If you take a step back and look at where the observed trends could have reasonably gone based simply on past history (a layperson's heuristic), you'd be forced to come to the conclusion that climate modeling has done remarkably well with projecting temp, sea level rise, OHC, etc. (not Arctic sea ice area/extent).
Consider this. Here's the key quote from Easterbrook:
"I find these similarities remarkable, because none of these patterns are coded into the climate model – they all emerge as a consequence of getting the basic thermodynamic properties of the atmosphere right. Remember also that a climate model is not intended to forecast the particular weather of any given year (that would be impossible, due to chaos theory). However, the model simulates a “typical” year on planet earth. So the specifics of where and when each storm forms do not correspond to anything that actually happened in any given year. But when the model gets the overall patterns about right, that’s a pretty impressive achievement."
Anyway, any further discussion of modeling should be taken to one of the modeling threads. You can see all new comments across all threads by clicking on the "comments" link below the middle of the SkS header.
Peter:
You've already had Tom and DSL give you fairly lengthly replies. I will not add to much to the fray, as one of this site's policies is to try to prevent "dog-piling" - a case where an individual gets a large number of responses from many people, which can be overwhelming.
...but, in comment #326, you said "Selecting 2001 as a start date seems to me to be a fair compromise". Taking a skeptical approach, what does the following suggest to you:
Should this not be a warning signal that you should not put a lot of trust into any of these numbers, when trying to examine a long-term warming signal?
Global temperatures seem to have plateaud. It is not only skeptics saying this, but many prominent warmists such as…
Dr. Kevin Trenberth – CRU emails – 12 Oct. 2009
“Well, I have my own article on where the heck is global warming…..The fact is that we can’t account for the lack of warming at the moment and it is a travesty that we can’t.”
Dr. Phil Jones – BBC – 13th February 2010
[Q] “Do you agree that from 1995 to the present there has been no statistically-significant global warming”
[A] “Yes, but only just
Dr. James Hansen – NASA GISS – 15 January 2013
“The 5-year mean global temperature has been flat for a decade, which we interpret as a combination of natural variability and a slowdown in the growth rate of the net climate forcing.”
Notice they all acknowledge the pause and Hansen gives his “pause” interpretation. But apart from Hansen’s theory, there have been over 60 other different theories/reasons trying to explain where the “missing heat” has gone. But which one is correct? If the science is settled why are there so many and varied theories?
Hans von Storch is no AGW lightweight and to dismiss his quote above as “careless” is a bit presumptuous. Let me repeat the quote…
Dr. Hans von Storch – IPCC lead author - Spiegel – 20 June 2013
“…the increase over the last 15 years was just 0.06 degrees Celsius (0.11 degrees Fahrenheit) — a value very close to zero….If things continue as they have been, in five years, at the latest, we will need to acknowledge that something is fundamentally wrong with our climate models….”“So far, no one has been able to provide a compelling answer to why climate change seems to be taking a break
Did a very senior IPCC author get it wrong? If the pause continues for another 5 years will it be acknowledged that climate models have a fundamental problem as he claims? He obviously doesn’t think any of the 60 or so “missing heat” theories are “compelling”.
So my question is, if the pause continues, how many years must pass before it’s conceded that “something is fundamentally wrong with our climate models”? In other words, if the pause continues for n years then can that then be classed as a falsifiable criterion for AGW?
[JH] You are now skating on the thin ice of excessive repitition which is prohibited by the SkS Comments Policy.
Please note that posting comments here at SkS is a privilege, not a right. This privilege can be rescinded if the posting individual treats adherence to the Comments Policy as optional, rather than the mandatory condition of participating in this online forum.
Please take the time to review the policy and ensure future comments are in full compliance with it. Thanks for your understanding and compliance in this matter.
Peter, there is no 'pause' in any meaningful sense. CO2 hasn't magically stopped re-radiating thermal radiation.
Tom's graph demonstrates the illusory nature of the pause. Things can look like 'pauses' when you have an oscillation (weather) overlaid on a gradient (climate). Just because you can draw flat or negative lines starting from certain peaks to certain troughs doesn't mean that the underlying gradient has changed.
You will note that if you asked that exact question of Phil Jones today, he would be able to answer "since 1995 there has been statistically significant warming in the Surface Temperature Records". At some point within the next 5 years, you'll be able to say the same thing about 1998, and then the so-called skeptics will have to completely reject the surface temperature records, as they will no longer be convenient. Is that the team you want to be on, Peter?
Peter: "So my question is, if the pause continues, how many years must pass before it’s conceded that “something is fundamentally wrong with our climate models”? In other words, if the pause continues for n years then can that then be classed as a falsifiable criterion for AGW?"
Peter, let's not be ham-fisted about this, eh? The greenhouse effect is extremely well-established. It's been directly measured from the surface. And I don't think you want to argue that humans aren't responsible for most, if not all, of the increase in atmospheric CO2 over the last century. The general theory of AGW is not going to be falsified by the trend in surface temperature. CO2 does what it does. We have done and are doing what we've done and are doing.
What the trend in surface temp tells us is how well we've modeled energy circulation for Earth's climate system. It also helps us understand climate sensitivity past and present. If the surface trend goes flat or negative for thirty years, then it will indicate that we are missing a major factor in the climate process. If ocean heat content also goes flat for thirty years, then we've likely completely misunderstood the process.
Note that OHC (in the link I posted earlier) in no way shows a "pause." The oceans are still rapidly accumulating energy, and the oceans are 93%+ of the thermal capacity of the climate system.
As Tom has pointed out, and as several of your quotes--in fuller form--point out, drawing conclusions from a surface trend is tricky business. When does the thirty-year trend start? 1998? Not statistically sound, as Tom has pointed out. Trend is negative from x to y (a period of between 6 and 10 years)? So what? Happened before, as I pointed out. Trend is not statistically significant? Ok, but what exactly does that mean? Does it mean that the trend is not statistically distinguishable from zero, or does it mean that it's not statistically different from well above the expected trend? Both. It doesn't mean there's no trend (i.e., it doesn't mean what you think it means).
Your interest seems to be "falsifying AGW" rather than understanding the science. You shouldn't attack something you don't understand. Understanding the theory of anthropogenic global warming by working backward from the surface trend is a bad idea. You should start with the basics. When you start with the basics, you'll know what is "settled science" and what is still being actively researched.
In this latest comment, you're basically repeating the same argument. Tom has answered the question you just asked, and in detail. If you repeat it again, without recognizing what has been said in response, your posts will be in violation of the SkS posting policy.
And yes, Tom, I know we can argue about what exactly is contained within the "theory of AGW," but I don't think it applies in this case. I think it's best to establish that the greenhouse effect is pretty solid, and that we are enhancing that effect. If Peter will oblige us by accepting those two propositions, we can move much more quickly into areas with greater uncertainty (e.g. modeling). I would like Peter to do what many "skeptics" find so hard to do: recognize and accept the basic science.
Peter, you're also letting others lead you on. Read the full discussion surrounding those quotes:
1. Trenberth, when using the word "travesty," was engaged in discussing his recent paper "An Imperative for Climate Change Planning: Tracking Earth's Global Energy" (Trenberth 2009). Here's the abstract:
"Planned adaptation to climate change requires information about what is happening and why. While a long-term trend is for global warming, short-term periods of cooling can occur and have physical causes associated with natural variability. However, such natural variability means that energy is rearranged or
changed within the climate system, and should be traceable. An assessment is given of our ability to track changes in reservoirs and flows of energy within the climate system. Arguments are given that developing the ability to do this is important, as it affects interpretations of global and especially regional climate change, and prospects for the future."
In other words, Trenberth was calling our ability to track energy in the climate system a "travesty." We need better measures of deep ocean heat content, for example. If you just read the quote from some "skeptic" site, then shame on you for not digging for context.
2. Phil Jones. He was answering honestly. The trend was not statistically different from zero. It was also not statistically different from the expected trend. Guess how it was portrayed by those who wish to turn doubt into profit? Again, if you took it hook, line, and sinker, without checking out what "statistically significant" means, and without taking Jones at his word in response to the flabber that followed, then shame on you.
3. Hansen. Be careful: "slowdown in the growth rate of net climate forcing" is not equal to "global warming has stopped/slowed." It may mean that forcing from greenhouse enhancement remains steady but aerosol forcing has increased. What does it mean to you, after having read Hansen's full statement? Or have you read it . . .
4. Von Storch has already been addressed.
It doesn't really matter whether or not you think my explanation is 'one of sixty or so'. There are numerous oscillatory systems at play in weather, from the very short term (day/night) through seasonal differences and the decadal scale PDO (which is responsible for a lot of the year to year climate variation).
You need to learn the meaning of statistical significance before you start making claims about it, lest you look silly.
The trend (GISTEMP) for 1995-2010 is
+0.138 +/- 0.147 c/dec. Because the number after the +/- (the 2 sigma error) is larger than the number before it (the trend), you cannot statistically exclude zero.
The trend (GISTEMP) for 1995-2015 is
+0.113 +/- 0.092 c/dec. Because the error is smaller than the trend, you can statistically exclude zero.
Hence. To 2010 there is not 'statistically significant warming' and to 2015 there is.
Peter99
You left off some other quotes from the piece:
"Scientists at NASA's Jet Propulsion Laboratory (JPL) in Pasadena, California, analyzed satellite and direct ocean temperature data from 2005 to 2013 and found the ocean abyss below 1.24 miles (1,995 meters) has not warmed measurably. Study coauthor Josh Willis of JPL said these findings do not throw suspicion on climate change itself.
"The sea level is still rising," Willis noted. "We're just trying to understand the nitty-gritty details."
"Coauthor Felix Landerer of JPL noted that during the same period warming in the top half of the ocean continued unabated, an unequivocal sign that our planet is heating up. Some recent studies reporting deep-ocean warming were, in fact, referring to the warming in the upper half of the ocean but below the topmost layer, which ends about 0.4 mile (700 meters) down. "
Note that these quotes are attributed to the study authors. Your earlier quotes in contrast are commentary by the author of the NASA news release with no attribution to the actual study authors.
You said there was a NASA report. Rather it looks like there was a study conducted by scientists from NASA and published in the scientific literature in the normal way. Then the NASA media unit published a news report highlighting the study. Not a NASA report. And maybe the NASA journalist got some stuff wrong!
Like in particular, that the common suggestion of warming occurring 'deeper' has always referred to the lower levels of the upper half of the ocean. Specifically below 700 meters but above 2000 meters. There has been no significant suggestion that meaningful warming is occuring in the lower half of the ocean, below 2000 meters. And this study provides support for that view.
Further to an earlier comment by Peter99
"Seems to me that AGW is unfalsifiable. When temperatures were rising in the 1990's that was proof of AGW, but now that temperatures have plateaud so far this century, the "proof" of AGW moves elsewhere."
You seem to be misunderstanding falsifiability. Key to it is the making of reasonable predictions, understanding the accuracy with which the prediction can be made. Then evaluating all the available data to compare with the prediction. Several key things need to be considered:
Is the theory making a simple black and white prediction; is that a valid statement of the theory? Or is it predicting results within a range of values?
What range of results constitute validation of a theory? What range of results an invalidation? Is there a black-and-white distinction between the two or shades of grey?
Is the nature of the theory such that a failure to completely meet every prediction should be taken as an indication of the total failure of the theory. Or are there degrees of failure and degrees of prediction.
Falsifiability is a great idea but when treated as too black-and-white a criterion it becomes practically useless in many real world scientific contextx. Very few situations lend themselves to black-and-white arguments
So to your question: "One last question...If global temperature increase stays at the present near zero rate until 2100, will the theory of AGW need revision?"
Yes.
But which part of the theory? The part of the theory dealing with Radiative Heat Transfer, Planetary Energy Balance, the Greenhouse Effect etc.? Or the part of the theory dealing with Oceanography, heat distribution in the ocean, ocean overturning time etc?
What if air temperatures don't rise by 2100 but ocean heat content, sea level etc. do rise? Which part of the theory needs to be revised?
You seem to be trying to reduce a complex question down to the idea of the simple black-and-white falsifiability of a single, indivisible theory. When the reality is of a set of multiple intersecting theories, each contributing to the overall conclusion, and complex layered observations that they are being tested against.
Popperian Falsifiability is an important ideal in science; as an ideal! Highly applicable in simple contexts, less useful in more complex situations.
As with most areas in life, basic principles derived from a black-and-white world view only become useful when translated into a shades-of-grey world view. Till then they remain mere idealisations.
If its true that air heats up easier than water and heated air expands and rises , why would the Oceans store the heat and not the air ? What is the flaw in my logic ?, Does not heated water also expand and evaporate ?, Is the oceans heating up begin at the surface where the sun and the air have 1st contact ? If true then why is the heated water sinking down ?, is heated water heavier than cooler water ?, in my bath tub , the cooler water is at the bottom when it sits for a while before i get in, if i don't disturb the water and cause the warm and cold water to mix , i can let the cold water drain out , i'm not trying to prove anything, this is what i observe and what i was taught, i would like to be corrected any where i'm wrong, i have no desired comclusion , i desire only the facts and truth
[Rob P] - The thermohaline circulation (partially explained by Tom Curtis) also has a wind-driven component to it. In areas of surface water convergence (the subtropical ocean gyres) the water cannot go anywhere else but down into the ocean interior. This is known as Ekman pumping and is a consequence of the fact that we live on a rapidly rotating sphere - something known as the Coriolis Effect. There is no magic taking place in the subtropical ocean gyres, the warmest water is still at the surface.
Much of this can be understood by watching simple lab experiments of water in tanks on a rotating platter - such as these conducted by researchers at MIT.
DarylLynch @338:
1) The upper ocean is heated by short wave radiation (visible light) from the sun. It cools by evaporation and by radiation of IR energy. Obviously the rate of cooling depends primarilly on its ability to transfer net energy from its skin layer to the atmosphere (which absorbs most of that IR energy). If you warm the atmosphere, you restrict the rate at which it can cool. Ergo it must warm to gain a new balance between incoming solar energy and outgoing (IR and evaporative) energy.
2) Cold water sinks because it is more dense. But salty water is more dense as well. When ice forms in the arctic (or antarctic) winter, the water becomes more dense due to the excess salt left behind by the freezing process, and sinks. (The arctic and antarctic water is already unusually salty because of evaporation as it travels from the equator). Further, winds over the ocean can generate substantial force. They act in some ways to drive surface waters to depth. I am, however, very unfamiliar with that process, so you are better of asking Rob Painting for details.
@ 338, hot water doesn't rise: because it is energised and is relatively free to move due to its liquid state it moves in random directions allowing cold water to sink through it which conversely is moving in basically only one direction- that being down.
Is this density? I suppose it is!
The concept of hot water rising is not correct, apparently, though there is a concept called "Flotation": but the reality is a warmer body of water is spreading out due to it's more energetic state and if a cooler body of water happens to be sitting on top it will fall through it due to gravity having a stronger influence over the colder waters behaviour.
Of course the warm water is not sinking: heat energy doesn't belong anywhere- it moves from one object to another unlike the quantity we call mass which stays with the object being considered. (I forget the name for this idea..) When the heat energy moves out of the body of water you have under consideration (this is why dashed lines are drawn around things: it's called a system boundary and represents the system/body of water you are talking about) then this water will be sinking due to gravity.
Tom Curtis@327. I'm in an ongoing "exchange" with a skeptic who believes man's influence is there, but very minimal. He recently posted this:
"The 18 plus years of no warming, and the more than a decade of cooling, are factual data from the current version global satellite lower troposphere temperature anomaly datasets from both RSS and UAH(v6). Atmospheric temperature readings by satellite are NOT "surface station" temperature readings.
Go to woodfortrees dot org and plot the past 18 years, 5 months of RSS MSU/AMSU TLT global temperature and you will see not only has there been no warming for that period of time, but the past 14 years have been progressively cooler, and all are cooler than 1998."
I realize the 1998 cherry-pick, but could you please elaborate on these comments of your's?:
"the UAH trend from 2001 to current is 0.070 ±0.217 °C/decade. That compares to an IPCC projected trend over the interval of 0.2 °C/decade. That is, it is well within error of the IPCC projection. That the error margin on measurement is larger than the projected temperature rise, however, tells you that it is too short a period to test the theory."
What is the trend looking back further...how far previous to 1998 can you go with this UAH trend and what would it be?
"The RSS data should be ignored. It uses the same basic data as UAH but the processing results in values distinctly different not only to UAH, but also to all other temperature records. Until it is found out why that is, and a correction made, it must be regarded as inaccurate for short term trends."
Can you provide more detail on what is different about the data processing which results in distinctively different values for RSS vs. UAH?
Quick, two points you can make:
1) The entire earth system is accruing heat. To try to disprove that by looking at the lower troposphere alone is a bit silly. As most of the heat (95%) goes into the ocean+ice caps looking at a graph of sea level is going to be more useful (it tells you about the rate of thermal expansion and meltwater).
2) if you look in the 'resources' section of the website, and use the trend calculator to plot the RSS trend from 1997, you get a range of +0.17c to -0.17c / dec. Now, if your friend wants to call that cooling, well, that's an interesting interpretation. The central estimate might be a tiny cooling trend, but the error bars are huge. Furthermore, if you use UAH rather than RSS, you get substantially different estimates - given that, and the error bars, I'd be reluctant to make any statement based on those data.
JohnD - The science proving global warming is man-made, is skepticism at work. AGW (Global Warming as many call it), unlike the beliefs that Galileo also challenged, was not the accepted norm until very recently.
While the science of greenhouse gasses was settled science back in the 1800’s, when it came to the climate there were many competing scientific hypothesis as to what could/would and by how much affect something the size of the planet.
The threat of global warming, and the science to support AGW, only started to gain traction in the 70’s and it took until the 90’s before a consensus position was formed.
Even after overwhelming evidence with more and more discoveries being made, it is still an uphill battle against those wanting to cling to the old status quo.
Claiming that we should treat AGW with skepticism is like claiming that we should still treat the sun as the center of the solar system with skepticism.
Quick - Ask the denier why he is trying to pretend that the oceans below their surfaces do not exist?
Also ask him why anyone would go to wood for trees, or wherever, when they should only be going to the University of Alabama Huntsville for the University’s climate data to guarantee validity: http://nsstc.uah.edu/climate/
Glenn Tamblyn
The fact that the oceans are storing the heat down to the 700 meter level is all the proof needed that global warming has not plateaued, but that it continues to trend upwards. Just because we now have to measure the oceans in 3D does not change the fact that the globe is warming. Added heat is added heat.
Claims/headlines that “NASA says heat not in deep ocean” are BS. No one has seriously claimed that from what I have read/heard/seen.
I am also certain that when enough energy is absorbed down to the 700 meter level that it starts to heat “the deep ocean” that the oceans will be literally boiling, or hot enough that we won’t care that it isn’t technically boiling, at the equator at the surface level.
Josh Willis clearly said that “The oceans are absorbing more than 80 percent of the heat from global warming. If you aren’t measuring heat content in the upper ocean, you aren’t measuring global warming.”
Will the current declining in CO2 and pollution help at some point?
http://www.epa.gov/airtrends/aqtrends.html
Obviously, this is the US only, but we also use more energy than anyone, esp 3rd world countries, so not sure the weight of this trend.
It seems we are doing the right things here according to this chart, and I dont suppose we'd want to encourage the 3rd world to give up their growing economies just because ours is mature and we are rich. Other modern countries are likely to have the same or better trends. So with warming ocurring, population growth slowing, not sure what valuable actions could be implemented (besides more people buying into the "be more responsible" lifestyle).
[PS] Fixed link, but this has nothing to do with the topic. Perhaps copy it to here because it will be deleted shortly.
I read the full von Storch interview from Der Spiegel in 2013 that Peter99 quotes above. The quote, though edited, is not taken out of context— Storch is merely demonstrating appropriate scientific restraint. He stated that if the observed "pause" continued for 5 years at most (i.e. by about 2018) then climate models will need significant revision. He said that models can barely account for the past 15 years' data (his term (translated) was "stagnation" which was shown in only 2% of his simulations). The revisions Storch suggested were not at the level of tweaks but were instead fundamental changes: either (a) our effect on the climate is less than we had thought; or (b) natural variation is much larger than we had thought.
Does Storch's statement reflect the consensus view among climate scientists? Surely if Storch is an IPCC lead author then his view must be mainstream at least.
DW @347.
The interview responses from Storch should indicate to you that Storch is less inclined than most to see the dangers of AGW. Those who are less optimistic about the future that Storch would put it more strongly. Note Storch considers a conservative value for projected sea level rise is the way to handle uncertainty. Many would see that as a lack of caution, equivalent to playing Russian roulette.
When Storch is asked about the fix required if global surface temperature continues to lag model predictions, the specific area he describes (while starting by saying "Among other things,...") is an underestimation of ocean heat uptake. That doesn't really chime with your (a) weaker AGW than we thought or (b) more natural variation than we thought, although you do a fair job of reproducing Storch's specific comment.
Perhaps it is worth looking at what Storch et al (2013) - 'Can climate models explain the recent stagnation in global warming?' says on this same subject a few weeks after the interview. The paper's abstract concludes:-
The paper is very short and does not actually derive the conclusions quoted from the abstract here. However these conclusions are less ambiguous that the interview (perhaps it was meant as a direct clarification) and is a far stronger position from Storch (& his co-authors). I would suggest that to hear it from somebody so cautious about over-estimating AGW as Storch gives some cause for some concern, although note the prospect of a lower climate sensitivity (the one option that lessens AGW) is rewarded with the adjective "particularly".
MA Rodger@348
Agree, Storch seems more conservative, arguably to the point of complacency, than many other experts in the field. (Evens so, in the interview he says his "instinct" is that we will have >= 2 deg C warming by 2100.)
However, my question was about the state of the climate models. Storch, apparently a mainstream scientist in the field, says the climate models are nearly unable to reproduce current data, and if the trend continues, the models will require significant changes (the one specific change he mentions being better modeling of the role of the oceans.) Is this in fact consensus/ majority/ mainstream opinion among experts?
GW @349.
One correction to my comment @348. The Storch et al (2013) paper appears to predate the interview. This blog post seems to be saying Storch was trying to get it published in Nature but unsuccessfully. The blog post does provide Storch's position quite clearly. He in 2013 does not see the model mean as overstating the expected warming unless the period of lower rise in temperature continues. Since then 2014 was the warmest year on record & 2015 could well top that.
And the message in the blog post is to do with model data rather than the models themselves, "a wake-up call that scenarios have to be prepared better" rather than a problem with the models. I'd reckon, give the work addressing the discrepancy, that experts generally appear to see it the same way.