


 Arguments


What has global warming done since 1998?
What the science says...
| Select a level... |
 Basic
Basic
|
 Intermediate
| |||
|
Every part of the Earth's climate system has continued warming since 1998, with the ten record temperature years all occurring since 2010. |
|||||
Climate Myth...
It hasn't warmed since 1998
For the years 1998-2005, temperature did not increase. This period coincides with society's continued pumping of more CO2 into the atmosphere. (Bob Carter)
At a glance
This date-specific talking-point is now something of a historical curiosity, but we'll leave it in the database for now because it's such a good illustration of the simplistic yet reckless mindset of the serial climate change misinformer. And indeed, we could (out of sheer mischief) have revised this myth by replacing "1998" with "2016". In fact, that's what we started to see in the climate change misinformation stream, © the Usual Suspects. But 2023's record temperatures put a stop to that.
Anyway, as first predicted over a century ago, Earth's surface, oceans and atmosphere are all heating up. That's due to our increasing greenhouse gas emissions, but over the years the warming has occurred at varying rates. This should in no way come as a surprise. Other physical phenomena periodically act either to suppress or enhance temperatures.
A prime example of such a phenomenon is the effects of La Nina and El Nino. This natural climatic oscillation features variations in winds and sea surface temperatures over the tropical eastern Pacific Ocean. The cycle can at times strongly influence temperature and rainfall patterns right around the world.
In a La Nina year, temperatures are suppressed, whereas an El Nino year sees them enhanced. This is noise on the long-term upward trend. That's why climatologists work with multiple decades, not just a few years in isolation, in order to get a grasp on what is going on.
The year 1998 featured a massive El Nino. The temperature spike it caused was a huge outlier, like a pinnacle towering over the landscape of the temperature record. In the following years there was a return to more typical conditions, with an erratic but upward warming pattern. That sequence of events gave deniers a brief opportunity to insist that global warming had “paused” or had even stopped.
You only need to remember one thing here. Those who create and spread misinformation about climate change don't care about reality. Public confusion is their aim. In this instance, the misinformation exercise involved deliberately selecting a limited block of years starting with the massive El Nino of 1998 and using that very warm starting-point to insist that global warming had stopped. They knew this would likely work for a few years and that the public would quickly forget why that was the case. Mother Nature had handed them a gift. It was an irresistible bunch of low-hanging fruit to exploit: little wonder the tactic is known as 'cherry-picking'.
Talking about reality, what actually happened? Well, as of 2024, a couple of decades down the line, the top ten warmest years have all been since 2010, whatever observation-based dataset you choose, with eight of them being in the 2015-2023 period. 1998 is nowhere to be seen any more. By modern standards, it simply wasn't warm enough.
Please use this form to provide feedback about this new "At a glance" section, which was updated on May 27, 2023 to improve its readability. Read a more technical version below or dig deeper via the tabs above!
Further details
Even if we ignore long term trends (something deniers often do in order to make a point) and just look at the record-breakers, as of early 2024 the top ten warmest years have all been since 2010, whatever dataset you choose, with eight of them being in the 2015-2023 period. In this top ten grouping, 1998 is nowhere to be seen any more. It was not warm enough.
The myth of no warming since 1998 was largely based on the satellite record estimates of the temperature of the atmosphere. However, as discussed in the video below by Peter Sinclair, even that argument is no longer accurate. The satellites show warming since 1998 too.
There's also a tendency for some people just to concentrate on atmospheric or surface air temperatures when there are other, more useful, indicators that can give us a better idea how rapidly the world is warming. More than 90% of global warming heat goes into warming the oceans, while less than 3% goes into increasing the atmospheric and surface air temperature. Records show that the Earth has been warming at a steady rate before and since 1998 and there is no sign of it slowing any time soon (Figure 1).
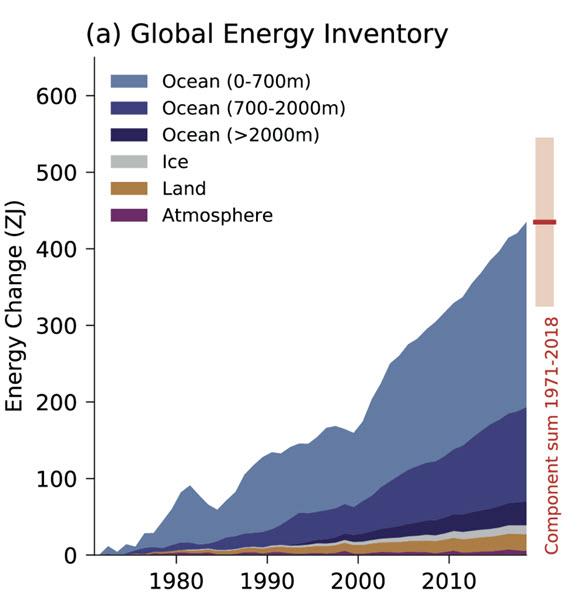
Figure 1: Global Energy Inventory: observed changes in the global energy inventory for 1971–2018 (shaded time series) with component contributions as indicated in the figure legend. Cross-Chapter Box 9.1 Figure 1 (part a) - From IPCC AR6 WGI Chapter 9.
Even if we focus exclusively on global surface temperatures, Cowtan & Way (2013) shows that when we account for temperatures across the entire globe (including the Arctic, which is the part of the planet warming fastest), the global surface warming trend for 1997–2015 is approximately 0.14°C per decade.
Ultimately, every part of the Earth's climate system is warming, and has continued warming since 1998.
Last updated on 8 March 2024 by John Mason. View Archives


Speaking as someone who did qualify as a Mechanical Engineer, I suppose I should step in to defend my profession. Mechanical Engineers, perhaps more than any other branch of engineering are actually uniquely qualified to evaluate climate science. So long as they are prepared to go back to their roots; to the core subjects they studied.
Mech Engies don't just deal with gear trains and machinery. At it's core is a lot of study of thermodynamics, fluid mechanics, physics, maths etc. Other branches of engineering have a different balance. Electrical engineers don't do much fluid mechanics, Civil engineers don't do as much thermodynamics, etc.
The problem for Mechanical engineers is that we tend to get channelled into dealing with machinery in our working lives and put the underlying core science we learn't on the back burner. If a Mech eng' can go back to their original training they have all the tools needed to assimilate climate science. As examples:
I would imagine that the apparent increased incidence rate of denialism among engineers and geologists has less to do with the curriculum or knowledge base of those disciplines and more to do with the industry they often find themselves working within.
Tristan @302, it is not just the industry (or not just the industry). Engineers (and doctors) are disproportionatly represented among creationists as well. I think what happens is that the engineers are aware that they have a good technical education in areas that are closely related to science. However, they are taught those skills as a recieved body of knowledge, so that they do not train themselves to not decieve themselves when it comes to science. That leaves some engineers (and by no means all, or even most) prone to assume they can speak authoritatively on a subject that they do not understand.
Nor should it be believed that this is a disease that only afflicts engineers, although the etiology is no doubt different for physicists:
Finally, I agree with Glenn Tamblyn - engineers not afflicted with this peculiar arrogance do have the skills to understand climate science quickly and well. They just have to be prepared to learn first.
Let me just say I am not skeptical of the fact the globe is warming so don’t think my comment is guided by that bias, but I do see a lack of predictability that I know is being worked on.
I too am an engineer. I’m not going to discuss in depth the notion that mechanical engineers have an unusual variation in skill. I assume the belief held by bozzza is that all scientists are equally brilliant and some of them haven’t barely gotten by in school? Futile point to say the least. There are poor scientists and poor engineers. Not realizing that is disappointing. I am not surprised how several people comment on the profession like it is subordinate. Many engineers view scientists the same way, but it is seen as a study that is ignorant of application, blind beyond their own work/views, completely void of practical understanding, and contributes nothing directly to the world. I’m kidding mostly – so relax.
But my point is that after decades of engineering research and enormous amounts of time working for/in/with teams of many different disciplines and backgrounds both scientific and engineering, the thing I have found to be a problem across the board is the lack of understanding most people have of their own inabilities. I have seen people work on something for 10 years and think they understand every facet of the topic because they explained why something has happened in the past, but couldn’t predict a thing. But the truth is their models were terrible and without a practical view they would never understood that and improve.
I have never seen an accurate prediction of global temperatures over any appreciable period of time. We should be very grateful for skepticism. Without it we would be worshiping the sun and sacrificing each other. Skepticism drives improvement. Blind faith in modeling is a very serious problem and outside academia (or at least in industry where the risk of error is critical as it should be for global warming) this is well understood.
Hi JohnD
Care to provide an example of blind faith in modelling within climate science?
JohnD
The key question isn't about a lack of predictbility. It is about what is reasonable to be able expect of prediction. If models are achieving the degree of predictability that one would expect of them given the nature of the problem being studied, then they are doing pretty well.
As an engineer, do you regard the acceptance of the basic Conservation Laws - Energy, Mass, Momentum etc - as 'blind faith'? Because that is what climate is; the application of the basic laws of physics. At its very simplest, Climate is an application of the 1st Law of Thermodynamics.
If we maintain the energy flow into a system while restricting energy flow out of that system, is expecting that the total energy within the system will increase, and thus tmperatures increase 'blind faith'? Is the 1st Law 'blind faith'?
JohnD wrote, "I have never seen an accurate prediction of global temperatures over any appreciable period of time."
This can only be true if you haven't looked very hard or are definining 'accurate' and/or 'appreciable' in ways that I would consider unreasonable. I mean, look at the list of top climate myths at the upper left part of this page. Number six is 'Models are unreliable'.
Climate models can not predict volcanic eruptions or fluctuations in various cycles (e.g. ~11 year solar cycle, ~30 year PDO, et cetera)... which is why they do multiple runs assuming different variations for these factors. Observed warming has consistently been within the range shown by those scenarios, and when you plug in a scenario matching the actual unpredicted variations you get results matching the actual observations. If that isn't 'accurate' then you're using the word in a way which reverses its most common meaning.
John D, being a skeptic is one thing but lying is another.
@ 307, how can an engineer not understand tolerance value for instrumentation?
John D, skepticism is a good thing indeed, when it is sincere. Refusing to acknowledge an entire body of evidence because one dislikes what it implies is not skepticism. Believing ideas that are not supported by evidence because they are more appealing or conform to one's preferred ideology is not skepticism. Stating that, in essence, one's ignorance is just as good as a bunch of other poeple's expertise is not skepticism. Choosing to trust an isolated fruitcake or a charlatan vs a large number of experts with converging results is not skepticism. The last time that I know of that a skeptic went about it with sincerity, the result was the BEST study. That's sincere.
You make claims of "blind faith" and inaccurate predictions that beg for further development. The thread mentioned higher would be the place to go for that.
It's childish and unnecessarily insulting to suggest I don't understand concepts of conservation laws. Perhaps poor reading comprehension by some lead to that conclusion. I’m not sure. But I never suggested the concept was wrong or I didn’t make sense to my weak and feeble mind. And the thought that I don’t understand that a complex system is difficult to predict or understand instrumentation errors and sensitivities is ridiculous because that is my point…
I do indeed believe that it has to be a fact that CO2 has many negative effects (and really I thought I made that obvious and even stated that to begin with). Like I said however, what is disturbing to me is the religious-type fervor on the subject in particular the condescension (such as insulting people’s intelligence over expressing a caution when trusting a model that cannot be validated except over time) and lack of good predictability (using early 2000s as a reference for myself). I only posted because the pretentious attitudes and condescension are disgusting. I did not suggest it is not a problem. But it is important to remember that there has to be a large band of confidence by any model with so many factors.
Perhaps a major issue is only the poor predictions are making it to the media, but all I have seen in the past is the extreme scenarios that has not panned out. I’m not going to devote large amounts of time to researching this because it’s better for me to devote my time to my own industry, but I am skeptical of the level of confidence many have in the problem’s *rate* not its existence and the fervor around predictions. I’m not even saying that it’s overstated… I’m just saying there cannot be an enormous level of confidence in the rate in which the effects of the added heat occur. If someone posts again that I don’t understand the concept of a closed system or the 1st law, then I will be disappointed. The questions I raise are about the confidence in rates not the mechanism.
[JH] You make numerous assertions in the above, some personal and some about the science. The tone of you personal assertions is argumentative and this argumentative tone should not be repeated in you future posts. Your assertions about the science are undocumented. If they are merely your personal opinion, they have little value in this venue.
John @311
You neglected to answer my question.
There are large confidence intervals for many of the projected future scenarios. Those confidence intervals aren't hidden. Fortunately, climate science isn't confined within any single paper or projection. The current state of climate science represents a consilience of evidence from thousands of papers. Most climate scientists aren't saying 'exactly x will happen by year y', they are saying 'these are the range of things that are likely to happen, given current trends and models based on physical constraints, and it is smart money to acknowledge these likelihoods'.
JohnD at 311
Two points. First I don't think the post you're responding to was suggesting that you did not understand the first law of thermodynamics. In fact, it was presuming that you did understand it. The point was that what confidence modelers have comes from the application of relatively simple laws of physics, albeit impliemented in a complex context. What looks like religiosity to you many stem from the confidence in those laws.
Second, until we understand what you are specifically talking about with respect to poor predictions, it's hard to discuss you concerns. For the most part models have done pretty well, especially when the inputs actually reflect reality. They certainly do well enough to discern a human influence on climate vs a natural one. Projections forward are very much dependent on basically random events like volcanoes and El nino and by the actions of humans, which may be influenced by the models.
If you gave us some specifics people could respond more constructively.
And a third point. I'm a bad typist.
JohnD wrote: "Perhaps a major issue is only the poor predictions are making it to the media..."
You have yet to identify, let alone substantiate, even one of these supposed 'poor predictions'. Until you do so it is not 'pretentious and condescending' to dismiss your position... because you have not presented a position.
Try to look at it from the other side. People who do not consider themselves to be acting on "blind faith" and "religious-type fervor", but rather accepting the strong scientific consensus based on the overwhelming evidence. Then you come in proclaiming that they are all wrong, while refusing to cite any evidence for your position and ignoring evidence to the contrary provided to you. Some might call such behaviour 'pretentious and condescending'.
If they were being kind.
I am a recent convert to AGW skepticism but am still trying to keep an open mind.
Following are two quotes by prominent global warmists accepting that atmospheric warming has had no statistically significant increase since the El Nino of 1998
Met Office Blog – Dave Britton (10:48:21) – 14 October 2012
“We agree with Mr Rose that there has been only a very small amount of warming in the 21st Century. As stated in our response, this is 0.05 degrees Celsius since 1997 equivalent to 0.03 degrees Celsius per decade.”
Source: metofficenews.wordpress.com/2012/10/14/met-office-in-the-media-14-october-2012
Dr. Hans von Storch – IPCC lead author - Spiegel – 20 June 2013
“…the increase over the last 15 years was just 0.06 degrees Celsius (0.11 degrees Fahrenheit) — a value very close to zero….If things continue as they have been, in five years, at the latest, we will need to acknowledge that something is fundamentally wrong with our climate models….”
“So far, no one has been able to provide a compelling answer to why climate change seems to be taking a break.”
But your article above is saying that we should be looking at the heat going into sea to determine "global warming".
However the IPCC's sole target is to keep atmospheric CO2 concentrations to within 2Deg C of preindustrial levels and if we add the 0.8DegC that the planet warmed prior to this century(0.8 degC), to the projected increase based on Hans Von Storch's figure above of 0.06 per 15 years then that gives us 0.8 + 0.06* 100 / 15 = 0.8 + 0.4 = 1.2 DegC which is well within the 2.0 DegC limit.
Seems to me that AGW is unfalsifiable. When temperatures were rising in the 1990's that was proof of AGW, but now that temperatures have plateaud so far this century, the "proof" of AGW moves elsewhere.
One last question...If global temperature increase stays at the present near zero rate until 2100, will the theory of AGW need revision?
Correction above...."atmospheric CO2 concentrations to within 2Deg C of preindustrial levels" should be "atmospheric temperatures to within 2Deg C of preindustrial levels
Peter, your account will be deleted if you persist with the "testing" garbage.
You're going to get plenty of response, and hopefully you'll engage honestly in dialogue. Here's the short version of what you're going to get:
1. Regardless of the language people are using, 93%+ of the thermal capacity of the climate system is wrapped up in the oceans.
2. Surface temp is noisy. As you can see from the "elevator," there have been many 6-8 year periods of insignificant or even negative trend over the last forty years.
3. 1998 is a cherry pick with regards to statistial significance. If you start a trend on a massive outlier, statistical significance is going to be hard to establish for a while.
4. Even so, look at the surface trend from 1970-2008. It's 0.178C per decade, right about the expected trend. How can that be! How can it be thus if there has been no significant warming for 17 years! It can be thus because the actual "pause" is not 17 years but more like seven years.
5. Start with the physics, like a real skeptic. Do you understand the greenhouse effect?
Correction: elevator > escalator. Also, ocean heat content: http://www.nodc.noaa.gov/OC5/3M_HEAT_CONTENT/heat_content2000m.png
And sea level rise (supporting OHC measures): http://sealevel.colorado.edu/
DSL,
Bit puzzled by your incredibly hostile and accusatory tone. This is my first time at your site and he two "testing" comments were because I was on page one and didn't see my comment appear as it was on page 7. Bit thick of me but why do you instantly attack me.
You say I have got the pause wrong but I quoted the UK met office and Hans Von Storch of the IPCC saying that the pause is real. Why attack me for their quotes?
Instead of personal attacks on me, could you please address specifically what I said in my first comment. Thanks.
The "testing" comment could have been read as impatience. I was signaled to read it that way by your substantial comment. In that comment, you focus on the language being used and do not show how the language is at odds with the science. You simply pit the language of those linked against the language of SkS. If you were truly skeptical, you'd be checking the language used against the actual science.
I did not claim there was no "pause." Indeed, I pointed out that there were others. However, my claim was that the pause was in global mean surface temperature and not in the overall (well, sub-stratospherical) climate system.
Hans Von Storch is simply wrong in applying "pause" to "climate change." Climate change and global warming aren't even the same thing (rather obviously, as there is more to climate than temp). Even if the enhanced greenhouse effect was done being enhanced, climate change would still be taking place--and would until the entire system came to equilibrium with the new level of forcing. Von Storch was being careless.
As for the Met Office quote, I can only assume that you snagged the quote from somewhere other than the Met blog post, as the post explains everything in detail.
The full quote from the Met in response to David Rose:
Q.1 “First, please confirm that they do indeed reveal no warming trend since 1997.”
"The linear trend from August 1997 (in the middle of an exceptionally strong El Nino) to August 2012 (coming at the tail end of a double-dip La Nina) is about 0.03°C/decade, amounting to a temperature increase of 0.05°C over that period, but equally we could calculate the linear trend from 1999, during the subsequent La Nina, and show a more substantial warming.
"As we’ve stressed before, choosing a starting or end point on short-term scales can be very misleading. Climate change can only be detected from multi-decadal timescales due to the inherent variability in the climate system. If you use a longer period from HadCRUT4 the trend looks very different. For example, 1979 to 2011 shows 0.16°C/decade (or 0.15°C/decade in the NCDC dataset, 0.16°C/decade in GISS). Looking at successive decades over this period, each decade was warmer than the previous – so the 1990s were warmer than the 1980s, and the 2000s were warmer than both. Eight of the top ten warmest years have occurred in the last decade.
"Over the last 140 years global surface temperatures have risen by about 0.8ºC. However, within this record there have been several periods lasting a decade or more during which temperatures have risen very slowly or cooled. The current period of reduced warming is not unprecedented and 15 year long periods are not unusual."
Peter99 @316, you are not a skeptic of the theory until you apply as much skepticism to criticisms of the theory as you do to the theory itself. Had you done so, and using the HadCRUT4 data, you would have noted that the temperature trend from 1975 to 1997 was 0.16 C per decade, while the temperature trend from 1975 to current is 0.17 C per decade. That is, the seventeen years of "temperatures [being] plateaued" has increased the trend by 6.25%.
This must be the first time in history that a decrease in the slope (the temperature plateauing) has actually increased the slope.
The reason for this unusual result is not hard to find. It is that you have been conned. Specifically, if you take a series with no overall trend and random fluctuations about the mean value, and look only at those segments which start at a local peak value above the mean, on average those segments will have a negative trend. If you only look at those segments that start well above the mean value and finish well below the mean value you might even find segments that show a statistically significant negative slope. That will not prove that the line does not exhibit no trend. It will only prove that you have cherry picked your start and end points.
That is exactly what the purported "skeptics" of AGW have done. They take an interval starting with a random fluctuation above the trend value due to the strongest or second strongest El Nino event on record (depending on which index you use). You then take the interval to a period containing one of the strongest La Nina events on record (2011/12), and which is consequently below trend values. They then treat that segment as important, even though the trend in that period is not statistically different from IPCC projections, let alone the ongoing long term trend.
On top of that they add a little verbal legerdemaine. They start by saying that in that period the trend is not statistically different from zero; and end by talking about a period with no trend ("trend has plateaued", "global warming has stopped"). The trend, however, is not statistically distinguishable from IPCC projections, so that it is no more true to say the trend has plateaued than to say it matches IPCC projections. This they are carefull not to mention.
So, please prove that you are in fact a skeptic about AGW, and apply your skepticism both ways. If you do so, you will stop buying the rubbish you just tried to propogate here and start wondering why the arguments of so-called AGW skeptics are so often indistinguishable from bald-faced lies.