


 Arguments


What has global warming done since 1998?
What the science says...
| Select a level... |
 Basic
Basic
|
 Intermediate
| |||
|
Every part of the Earth's climate system has continued warming since 1998, with the ten record temperature years all occurring since 2010. |
|||||
Climate Myth...
It hasn't warmed since 1998
For the years 1998-2005, temperature did not increase. This period coincides with society's continued pumping of more CO2 into the atmosphere. (Bob Carter)
At a glance
This date-specific talking-point is now something of a historical curiosity, but we'll leave it in the database for now because it's such a good illustration of the simplistic yet reckless mindset of the serial climate change misinformer. And indeed, we could (out of sheer mischief) have revised this myth by replacing "1998" with "2016". In fact, that's what we started to see in the climate change misinformation stream, © the Usual Suspects. But 2023's record temperatures put a stop to that.
Anyway, as first predicted over a century ago, Earth's surface, oceans and atmosphere are all heating up. That's due to our increasing greenhouse gas emissions, but over the years the warming has occurred at varying rates. This should in no way come as a surprise. Other physical phenomena periodically act either to suppress or enhance temperatures.
A prime example of such a phenomenon is the effects of La Nina and El Nino. This natural climatic oscillation features variations in winds and sea surface temperatures over the tropical eastern Pacific Ocean. The cycle can at times strongly influence temperature and rainfall patterns right around the world.
In a La Nina year, temperatures are suppressed, whereas an El Nino year sees them enhanced. This is noise on the long-term upward trend. That's why climatologists work with multiple decades, not just a few years in isolation, in order to get a grasp on what is going on.
The year 1998 featured a massive El Nino. The temperature spike it caused was a huge outlier, like a pinnacle towering over the landscape of the temperature record. In the following years there was a return to more typical conditions, with an erratic but upward warming pattern. That sequence of events gave deniers a brief opportunity to insist that global warming had “paused” or had even stopped.
You only need to remember one thing here. Those who create and spread misinformation about climate change don't care about reality. Public confusion is their aim. In this instance, the misinformation exercise involved deliberately selecting a limited block of years starting with the massive El Nino of 1998 and using that very warm starting-point to insist that global warming had stopped. They knew this would likely work for a few years and that the public would quickly forget why that was the case. Mother Nature had handed them a gift. It was an irresistible bunch of low-hanging fruit to exploit: little wonder the tactic is known as 'cherry-picking'.
Talking about reality, what actually happened? Well, as of 2024, a couple of decades down the line, the top ten warmest years have all been since 2010, whatever observation-based dataset you choose, with eight of them being in the 2015-2023 period. 1998 is nowhere to be seen any more. By modern standards, it simply wasn't warm enough.
Please use this form to provide feedback about this new "At a glance" section, which was updated on May 27, 2023 to improve its readability. Read a more technical version below or dig deeper via the tabs above!
Further details
Even if we ignore long term trends (something deniers often do in order to make a point) and just look at the record-breakers, as of early 2024 the top ten warmest years have all been since 2010, whatever dataset you choose, with eight of them being in the 2015-2023 period. In this top ten grouping, 1998 is nowhere to be seen any more. It was not warm enough.
The myth of no warming since 1998 was largely based on the satellite record estimates of the temperature of the atmosphere. However, as discussed in the video below by Peter Sinclair, even that argument is no longer accurate. The satellites show warming since 1998 too.
There's also a tendency for some people just to concentrate on atmospheric or surface air temperatures when there are other, more useful, indicators that can give us a better idea how rapidly the world is warming. More than 90% of global warming heat goes into warming the oceans, while less than 3% goes into increasing the atmospheric and surface air temperature. Records show that the Earth has been warming at a steady rate before and since 1998 and there is no sign of it slowing any time soon (Figure 1).
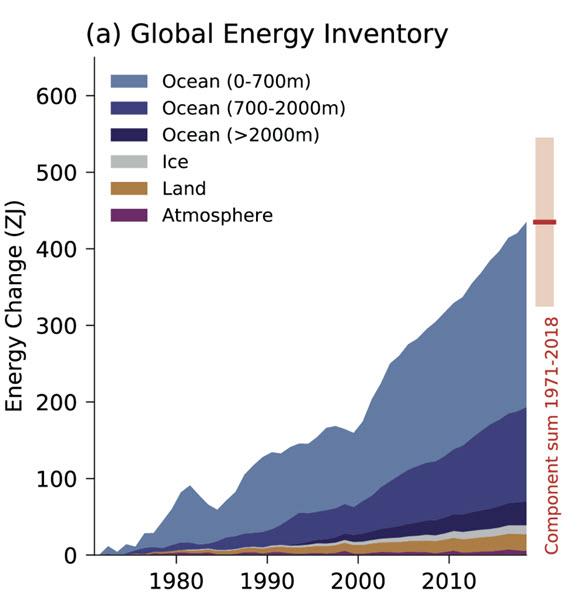
Figure 1: Global Energy Inventory: observed changes in the global energy inventory for 1971–2018 (shaded time series) with component contributions as indicated in the figure legend. Cross-Chapter Box 9.1 Figure 1 (part a) - From IPCC AR6 WGI Chapter 9.
Even if we focus exclusively on global surface temperatures, Cowtan & Way (2013) shows that when we account for temperatures across the entire globe (including the Arctic, which is the part of the planet warming fastest), the global surface warming trend for 1997–2015 is approximately 0.14°C per decade.
Ultimately, every part of the Earth's climate system is warming, and has continued warming since 1998.
Last updated on 8 March 2024 by John Mason. View Archives


Tom Curtis @275, thanks for your response.
I was looking at the data from the opposite perspective: a sharp increase in energy going into melting ice from 2003. Is the trend real? Where is the extra energy coming from? What other part of the system is losing out? I am assuming that the bulk of the heat is being transported to the sea ice via the Arctic near-surface waters which then have less heat to pass up to the atmosphere. If this absorption of heat from Arctic waters by ice melt does not produce a corresponding loss of atmospheric heat input, I will have to look elsewhere.
The amount of heat melting Arctic sea ice per average year since 2003 is minor but enough to raise the temperature of the top three metres of the Arctic Ocean by 1 degree C. I have not yet found a correlation with sea ice area minima which would be the case if the melting were due mainly to a progressive loss of albedo. I am not convinced of the relevance of sea ice extent in this case.
To come back on topic, although minor compared to oceanic heat absorption, melting sea ice demonstrates that a lot of near-surface heating has been going on since 1998 which will not have contributed to a global surface temperature rise.
The advantage with my hypothesis is that it can be proved wrong within the next four years - I hope!
I like, or am scared by, the last two graphs. It would be nice to have them in a higher resolution.
According to these graphs, yes, and the theory there has been a haiatus but that is because the heat has been melting ice, with potentially scarier postive-feedback calamitous potential if Polar Ice has a damping mechanism.
> "The advantage with my hypothesis is that it can be proved wrong within the next four years - I hope!"
I confess to being a bit of a sceptic, but I think that we are reaching a watershed. I guess a lot of people feel the same way. When the hiatus ends, the temperature is going to up or down. If it starts going up again, then I am going to junk my turbo charged car, and become a "realist".
(I hardly ever drive my car, and I have had it for 16 years. I cycle and try to behave like a realist anyway.)
CB... the IPCC alleges that of the most recent global warming ... non of it is natural and all of it is man made. ... do you agree with that hypothesis?
Donny... You're getting things wrong again. The IPCC states that the warming of the past 50 years is very likely primarily due to human activities. That's a very different statement. They make ample room for that to mean anything from 51% to over 100%, which they have to do because of uncertainties.
Donny - The IPCC reports qualify the statement appropriately, but note that they have stated (AR5 SPM):
Various attribution studies indicate that the anthropogenic contribution is 90-170% of recent warming, with the >100% values being balanced by cooling influences of natural forcings - without which we would see even warmer temperatures.
[Source]
You appear not to agree with this conclusion, which quite frankly is far beyond hypothesis status at this point. Do you have any support whatsoever for a less than dominant anthropogenic contribution? Any attribution studies, for example?
I expect not, as your posts so far have primarily consisted of arguments by assertion and out-of-context numbers that in reality don't support your positions, but I'm more than happy to be surprised.
Donny, it appears you think that a significant part of the warming is natural? Perhaps you could tell us what data informs this opinion, given the flat or negative natural forcing data?
You would also note the increasing warming of oceans consistant with the rise in CO2 (and after all that is where most of the extra surface radiation ends up).
Why didn't it end up in the ocean during the 80s and 90s?
Donny, go to the top of this page. Look at the first graph. Notice that it shows warming in the oceans during the 80s and 90s.
See the problem with your question?
Update:
"Varying planetary heat sink led to global-warming slowdown and acceleration"
Xianyao Chen, Ka-Kit Tung
Science 22 August 2014:
Vol. 345 no. 6199 pp. 897-903
DOI: 10.1126/science.1254937
RESEARCH ARTICLE
http://www.sciencemag.org/content/345/6199/897
===============
August 21, 2014
Cause of global warming hiatus found deep in the Atlantic Ocean
Hannah Hickey
http://www.washington.edu/news/2014/08/21/cause-of-global-warming-hiatus-found-deep-in-the-atlantic-ocean/
Following rapid warming in the late 20th century, this century has so far seen surprisingly little increase in the average temperature at the Earth’s surface. At first this was a blip, then a trend, then a puzzle for the climate science community.
More than a dozen theories have now been proposed for the so-called global warming hiatus, ranging from air pollution to volcanoes to sunspots. New research from the University of Washington shows that the heat absent from the surface is plunging deep in the north and south Atlantic Ocean, and is part of a naturally occurring cycle. The study is published Aug. 22 in Science.
Subsurface ocean warming explains why global average air temperatures have flatlined since 1999, despite greenhouse gases trapping more solar heat at the Earth’s surface.
...
The results show that a slow-moving current in the Atlantic, which carries heat between the two poles, sped up earlier this century to draw heat down almost a mile (1,500 meters). Most of the previous studies focused on shorter-term variability or particles that could block incoming sunlight, but they could not explain the massive amount of heat missing for more than a decade.
“The finding is a surprise, since the current theories had pointed to the Pacific Ocean as the culprit for hiding heat,” Tung said. “But the data are quite convincing and they show otherwise.”
Tung and co-author Xianyao Chen of the Ocean University of China, who was a UW visiting professor last year, used recent observations of deep-sea temperatures from Argo floats that sample the water down to 6,500 feet (2,000 meters) depth, as well as older oceanographic measurements and computer reconstructions. Results show an increase in heat sinking around 1999, when the rapid warming of the 20th century stopped.
Some images from the net which appear to originate from the Chen & Tung paper linked @284.
Caption @CarbonBrief.org - Heat stored in the global ocean (top) and major oceans compared to the 1970 to 2012 average. Coloured lines show heat from the surface down to different depths (left scale). Black lines are average sea surface temperature (right scale) Source: Chen & Tung (2014)
Caption @Science20.com - (Top) Global average surface temperatures, where black dots are yearly averages. Two flat periods (hiatus) are separated by rapid warming from 1976-1999. (Middle) Observations of heat content, compared to the average, in the north Atlantic Ocean. (Bottom) Salinity of the seawater in the same part of the Atlantic. Higher salinity is seen to coincide with more ocean heat storage. Credit: University of Washington
Attribution @ScienceMag.org - Xianyao Chen/Ka-Kit Tung
COMMENT TO SKEPTICALSCIENCE re PAUSE IN GLOBAL WARMING
(snip)
I wonder if the so-called pause in global warming as expressed by surface atmospheric temperature can be quite easily explained as follows? The measured net atmospheric temperature was increasing at an annual rate of about 0.025º C prior to the late 90's. It then leveled off rather abruptly and increased at a much slower pace. Climate change deniers have been celebrating this as evidence that global warming has stopped and there's nothing to worry about. But what really happened? If increased atmospheric CO2 is trapping more energy, where is it going? What has changed? Andrew Shephard et al. in(Science, 2012, 338: 1183-1189 ), document a new phenomenon which began in the late 90's: significant net melting of arctic and antarctic land based ice. Greenland in particular and West Antarctica are losing about 400 gigatonnes per year (including allowances for increases of ice from increased snowfall in East Antarctica) as net ice melt. Prior to the late 90's there was no significant loss of land based ice mass. Their paper discusses the effect in terms of sea level rise (also measurable). But let's do the energy balance math. It appears that this recently arrived phenomenon of net ice melting coincides well with the abrupt change in the rate of atmospheric temperature increase. So, the energy required to melt 400 Gt of ice (its latent heat of fusion) is quite close to the amount of energy required to warm the earth's atmosphere by 0.025 º C. Wouldn’t such a newly arrived heat sink be taking up the so called missing energy? As has been widely reported, this “missing” energy is going into the oceans in the form of liquid water. So global warming has not paused at all! The earth is continuing to gain energy because of the increased energy absorption caused by the increased level of atmospheric CO2. Ice melting is accelerating and the atmosphere is still showing signs of warming. Thus we could rightly assume that global warming and its effects on climate are continuing and even accelerating as more and more energy is embedded in our global environment as we burn our way into a high risk future. Short term greed, instant gratification, discounting the future, delusional economics, and denial of reality are the hallmarks of humanity's dis-function and abuse of our only home.
[RH] Snipped all caps (per policy) and resized font to standard size.
Richard Hampton @286.
I usually trot out the following levels of current annual ice loss - Arctic Ocean 300Gt, Greenland 450Gt, Antarctica 150Gt, Other 300Gt. Thise are far bigger numbers than last decade with today a total latent energy gain of 0.4 Zj pa. However that figure is a lot smaller than the extra annual increase in OHC which would be something like an extra 3Zj pa in just the measured bit of the oceans 0-2000m.
So it is correct that more energy is being used melting ice but a whole lot more of the extra energy is ending up in the oceans. Further, if the atmosphere had been warmed significantly, most of that energy entering the oceans would be required to keep the atmosphere at the higher temperature and thus be radiating back into space.
M. A. Rodger @287
You are absolutely correct that the moderating effect of energy absorption by the oceans is much greater than the effect of melting glacial ice. However the ocean effect has been continuous and is reflected in the historical atmospheric temperature record. My point is that the newly active heat sink effect of arctic/antarctic net land ice melting coincides with the inflection in the atmospheric temperature record curve in both timing and energy balance. Direct cause and effect must be examined in the context of energy transfer mechamisms to develop a full understanding of the process. Nevertheless, whenever a continuing process (atmospheric warming) shows an inflection there has to be a coincidental cause. Here with arctic/antarctic ice melting we have a good fit in the data and therefore a strong candidate for a cause of the "pause".
Richard Hampton @288.
There certainly is a conicidence. 2007 was the year the global temperatures started showing signs of a pause and it was also the first starting melt year for Arctic Sea Ice. And the energy fluxes are not dissimilar in size (although as ice loss continues to accelerate that equivalence will fail). Yet reasons for the 'pause' proposed by the climatologists, which are quite far reaching, to date don't include a diversion of heat from atmospheric warming to ice melting. I'd guess the main problem with the theory is how such a diversion would work in practice. And the 'pause' has symptoms that date back before 2007. So the changes in rate of surface warming and ice loss remain solely a coincidence.
I can think of one. Rain. The objection would be that we don't, as far as I am aware, see more rain yet on the ice. Yet.
sidd
Looks like this handy rebuttal to a commonly expressed "skeptic" argument needs an update... where it states that the warmest 12 consecutive months on record are June 2009 - May 2010, this has just been surpassed according to NOAA, by the October 2013 - September 2014 interval. Time for a quick edit already!
Excellent new post about the pause/hiatus (not) at RealClimate.
Hello,
I wonder if someone from the Skeptical Science team or commentators could give their opinion on the linked spreadsheet. (See below)
It takes a different approach to de-bunking arguments such as "no warming for 15 years" or "AGW theory predicts an increase in CO2 should result in an increase in temperature". It does so by taking a qualitative description of some of the factors that affect atmospheric temperatures (CO2 concentration, solar cycles, IPO cycles and volcanic erruptions) and models them as simple algebraic functions.
The intent is use this as de-bunking tool to show that (a) this qualitative description of factors affecting the atmospheric temperature record give rise to plausible looking temperature graphs and (b) the description does indeed predict short periods of "hiatus" or slowing in the temperature record, as well as accelerated periods too. It is not (obviously) an attempt to predict the Earths recent atmospheric temperature changes.
The user can play with the relative strength of the various contributing factors by changing the "factors" in cells H3, I3, J3 and K3. The simple algebraic functions can be examined by looking at the formulae in cells C3-G3
Link here.
Suggestions, improvements, corrections welcome ...
May need updating? 2014 now warmest year on record in several temperature databases.
Hi. The year 1977 was the last year that the global temperature was ~the 20th century average of 13.9D C. - 21 years later, 1998 the gt was ~14.5. The 21st centruy average is so far 14.44D C. - 2005, 2010 and 2014 beat the 1998 temperature by a margin-total of just 0.1D C. -w/2014 being 14.6D C (warmest ever - with a measurement magin of error of 0.1D C ??)
Today's rate of CO2 emissions has increased over the last century. The oceans of today that are "accumulating" heat existed back in the 20th century as well, yet the rate of change over 21 years was 0.6D C and the rate of change over the past 17 years (since) is only 0.1D C.
2/3rds of the globe is ocean. Oceans are warming, per your statements, yet the 2/3rds of the planets atmosphere, above the oceans are only warming by 1/9th the rate, of previous warming.
It would seem to this engineer in my 45th year as an engineer, that the atmosphere has reached a warming saturation and that all the heat trapping GHGs can't seem to provide any additiona warming in the atmosphere no matter how much the "plate" at our feet warms (accumulates) or how much CO2 enters the atmosphere.
Something is not adding up. It would appear we need more heat-in to warm pass the curent highs we have been seeing. The highs can be beat by 0.01 or 0.03 degrees C but they will not increase by 0.6 without more heat input, it would seem.
AL
Albert, where are you getting your OHC figures?
See http://www.nodc.noaa.gov/OC5/3M_HEAT_CONTENT/heat_content2000m.png
Albert H, for the following I have used the Berkely Earth Surface Temperature (BEST) as I consider it the best currently available surface temperature index. That is because it is constructed using (by far) more temperature records in determining the series than any other temperature index, and also constructed with a less controversial method than any other temperature index.
Using the SkS trend calculator, I find the trends are as follows:
1977-1997: 0.11 C per decade
1999-2014: 0.121 C per decade
I notice that the 1999 onward trend is slightly greater than the 1977-1997 trend.
Of course, if I use 1998 for a terminal and initial year respectively, if find trends of 0.126 C per decade (1977-1998) and 0.09 C per decade (1998-2014).
I will note first that that is not so large a difference as to justify your conclusion. Your conclusion, therefore, is based on using an alternative, unspecified, and objectively inferior temperature index.
More importantly, your conclusion is shown to follow primarilly from using 1998 as your bridge year. 1998, however, is an unusual year in that it was the year of the strongest or second strongest El Nino event on record. (Its only rival occured at the same time as a major volcanic erruption, with the effects of the two events on temperature essentially cancelling each other out.) 1998's unusual warmth, on which your claim relies, is therefore a consequence of short term internal variability, not radiative forcing.
Finally, the trend over the whole period was 0.164 C per decade, within error of model predictions.
So much for the technical discussion. I notice as an aside you claim to be an engineer with 40 years experience. As such you would clearly know certain basic principles of data usage:
1) You would know to use trends rather than end points in analysing rates to avoid "endpoint effects";
2) You would know to use clearly identified sources of data;
3) You would know to use the best available data, or at least to justify your choice when you do not; and
4) You would know not to cherry pick end points for data analysis.
You have clearly violated each of these principles. I am therefore forced to conclude that your claim to tenuous authority (engineers often have very bad understanding of science, together with an over inflated belief in their understanding of science) is false; or that you have deliberately violated good practise to strengthen a very weak argument. Which is it?
Albert H... That might seem like a logical assumption, but with all due respect to your engineering experience, the assumption would be wrong. There's far more that you should endeavor to learn about ocean-atmosphere coupling before coming to any conclusions. Here is a good place to start: LINK
There are also many great informative articles here on SkS that you should take the time to read through. Nearly all of the articles here are fully cited with the relative current research which, if you have further questions, you should locate and read through.
Albert H, you forget the possiblity of the ice sucking up the added heat content: it is my considered (lol, check me out: failed engineering student!!) opinion that the energy is going toward phase-change-mode.
Politically the IPCC reports are by default conservative as all Governments involved have to agree as to what goes into them thus giving rise to my slightly panicked thoughts on this matter.
The idea of 'diminishing returns' can be easily interpreted by the masses as wasted effort and the double-handling of matters tires us all. The need to Nip this problem of correlation with gap between rich and poor means climate denialism is over and the disinvestment campaign by the aroused consuming voter wins. What else is economics but a reason to get out of bed and do what needs to be done as the problem presents itself?
It saddens me to agree with one of the specific comments regarding engineers as having a poor grasp of science. I failed Mechanical engineering and basically can't have a considered opinion by default but do know this: Mechanical engineers are the most variedly paid engineers, presumably meaning some barely passed and possibly took decades to finish just for the status involved with such a title.
I have talked to retired engineers who simply don't accept CO2 as being mechanically forced into the closed system called our atmostphere even though that is exactly what they were involved with doing all those years: truly weird, I must admit, but seemingly not an uncommon phenomenon.
The well paid would never talk like this, would they?