


 Arguments


What has global warming done since 1998?
What the science says...
| Select a level... |
 Basic
Basic
|
 Intermediate
| |||
|
Every part of the Earth's climate system has continued warming since 1998, with the ten record temperature years all occurring since 2010. |
|||||
Climate Myth...
It hasn't warmed since 1998
For the years 1998-2005, temperature did not increase. This period coincides with society's continued pumping of more CO2 into the atmosphere. (Bob Carter)
At a glance
This date-specific talking-point is now something of a historical curiosity, but we'll leave it in the database for now because it's such a good illustration of the simplistic yet reckless mindset of the serial climate change misinformer. And indeed, we could (out of sheer mischief) have revised this myth by replacing "1998" with "2016". In fact, that's what we started to see in the climate change misinformation stream, © the Usual Suspects. But 2023's record temperatures put a stop to that.
Anyway, as first predicted over a century ago, Earth's surface, oceans and atmosphere are all heating up. That's due to our increasing greenhouse gas emissions, but over the years the warming has occurred at varying rates. This should in no way come as a surprise. Other physical phenomena periodically act either to suppress or enhance temperatures.
A prime example of such a phenomenon is the effects of La Nina and El Nino. This natural climatic oscillation features variations in winds and sea surface temperatures over the tropical eastern Pacific Ocean. The cycle can at times strongly influence temperature and rainfall patterns right around the world.
In a La Nina year, temperatures are suppressed, whereas an El Nino year sees them enhanced. This is noise on the long-term upward trend. That's why climatologists work with multiple decades, not just a few years in isolation, in order to get a grasp on what is going on.
The year 1998 featured a massive El Nino. The temperature spike it caused was a huge outlier, like a pinnacle towering over the landscape of the temperature record. In the following years there was a return to more typical conditions, with an erratic but upward warming pattern. That sequence of events gave deniers a brief opportunity to insist that global warming had “paused” or had even stopped.
You only need to remember one thing here. Those who create and spread misinformation about climate change don't care about reality. Public confusion is their aim. In this instance, the misinformation exercise involved deliberately selecting a limited block of years starting with the massive El Nino of 1998 and using that very warm starting-point to insist that global warming had stopped. They knew this would likely work for a few years and that the public would quickly forget why that was the case. Mother Nature had handed them a gift. It was an irresistible bunch of low-hanging fruit to exploit: little wonder the tactic is known as 'cherry-picking'.
Talking about reality, what actually happened? Well, as of 2024, a couple of decades down the line, the top ten warmest years have all been since 2010, whatever observation-based dataset you choose, with eight of them being in the 2015-2023 period. 1998 is nowhere to be seen any more. By modern standards, it simply wasn't warm enough.
Please use this form to provide feedback about this new "At a glance" section, which was updated on May 27, 2023 to improve its readability. Read a more technical version below or dig deeper via the tabs above!
Further details
Even if we ignore long term trends (something deniers often do in order to make a point) and just look at the record-breakers, as of early 2024 the top ten warmest years have all been since 2010, whatever dataset you choose, with eight of them being in the 2015-2023 period. In this top ten grouping, 1998 is nowhere to be seen any more. It was not warm enough.
The myth of no warming since 1998 was largely based on the satellite record estimates of the temperature of the atmosphere. However, as discussed in the video below by Peter Sinclair, even that argument is no longer accurate. The satellites show warming since 1998 too.
There's also a tendency for some people just to concentrate on atmospheric or surface air temperatures when there are other, more useful, indicators that can give us a better idea how rapidly the world is warming. More than 90% of global warming heat goes into warming the oceans, while less than 3% goes into increasing the atmospheric and surface air temperature. Records show that the Earth has been warming at a steady rate before and since 1998 and there is no sign of it slowing any time soon (Figure 1).
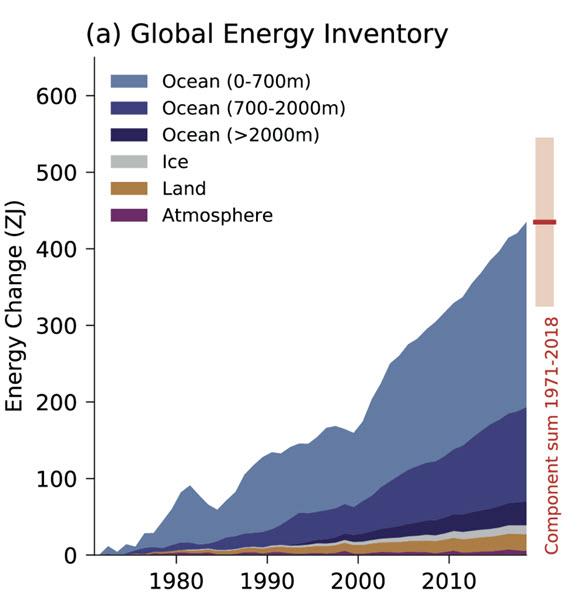
Figure 1: Global Energy Inventory: observed changes in the global energy inventory for 1971–2018 (shaded time series) with component contributions as indicated in the figure legend. Cross-Chapter Box 9.1 Figure 1 (part a) - From IPCC AR6 WGI Chapter 9.
Even if we focus exclusively on global surface temperatures, Cowtan & Way (2013) shows that when we account for temperatures across the entire globe (including the Arctic, which is the part of the planet warming fastest), the global surface warming trend for 1997–2015 is approximately 0.14°C per decade.
Ultimately, every part of the Earth's climate system is warming, and has continued warming since 1998.
Last updated on 8 March 2024 by John Mason. View Archives


Hi all. I am a high school AP Envrironmental Science teacher who does his best to stay "up-to-date" with the science of climate change. I have a quick question for anybody willing to help.
I keep reading about the current hiatus, pause, stagnation, etc. in global surface temperature and I am fairly confident that I understand the meaning of statistical significance...at least well enough. My question is, however, with 2014 being another record year have we gotten past the "no statistically significant warming" bit yet or was 2014 not sufficiently anomalous to bring us out of the "hiatus?" Any help here would be great.
Hi chud, the nature of noisy data means that you can't expect to see statistically significant trends over short time frames. Hence, you will almost always be able to say "no significant warming since <some year>" if you draw the line from the last major el nino year. It's not that unlikely that if 2030 is a la nina year, we will be able to draw a line from 2015, and say "no significant warming in 15 years!".
When every major temperature set shows significant warming since 1998, all the so-called skeptics will do is change the meme from '98 to '02, then '05, then '10 etc etc. It's an utterly meaningless claim.
plfreeman and stewart: Here is a relatively simple statistical analysis for 2014 global records which indicates there is a special cause for the percentage of hot all time records.
Thanks
Stephen Thomas (psthomas01@yahoo.com)
M.S., Mathematics, Northwestern
Based on around the globe weather station reports and historical records, in terms of all time Hot and Cold records set: 74 New all time high temperature records were set this past year (NOAA global records summary) and 19 New all time cold temperature records were set this past year. So we have set 79.6% Hot records vs. Cold records. Based on the binomial distribution for percentages, assuming a 50% underlying probability (the null hypothesis of no global warming) the expected range for 50% based on N=93 is 34.4% to 65.6%. I.e., expect by chance over 99% of the time for actual percentage to be between 34.4% to 65.6%. But for 2014 the actual percentage of Hot records set out of total records set is 79.6%, which is considerably above the P-chart 'upper control limit' of 65.6%. We see the data gives us an objective conclusion that it is NOT 50%. There must be a special cause.
The currently available temperature records show pauses in warming from about 1880 until about 1910 and from the early 1940's until the early 1970's. Approximately equal length periods of warming were interspersed with the pauses. If this possible pattern was real then there was cause to expect another pause in warming to begin at about the year 2000. It appears that such a pause did begin but now its presence is in dispute. It would probably be a good idea not to put too much emphasis on individual years (or months) during this period but rather assess whether or not it was a pause at ar near its probable end around 2030.
[TD] It is best to read the original post before commenting. Actually read it. Thoroughly. This post is not about individual years or months. After you read the Basic tabbed pane, read the Intermediate one, and watch the Denial 101x video at the bottom of that tabbed pane. Then read the recent post "In a Blind Test," not just because of that most recent blind test being reported, but more importantly for links to the multiple previous studies using a diversity of approaches that all found there has been no recent pause in the long term warming trend. It simply does not exist. The assessment you suggested in your comment has been done already. Repeatedly. To exhaustion.
I still say wait and see. Some of the years during the next pause (about 2060-2090) will be even warmer than those during this pause.
[TD] Now you've focused on a topic that does not belong on this thread. If you want to claim that there are natural periodic cycles in temperature, first read the post countering the myth that It's a Natural Cycle, including watching the Denial 101x video at the bottom. Probably you are repeating reverberations from the debunked Loehle and Scafetta data torturing, so you should read that post too. Then comment on one of those threads. For yet more debunking of what climate statistician Tamino calls "mathturbation," enter "mathturbation" into the Search field on his site.
billev... Except that it's been fairly well established at this point that there's been no pause. Any potential pause from natural forcings is overwhelmed by the much larger radiative forcing of man-made greenhouse gases.
I base my observations on a perusal of the NOAA temperature charts from 1880 to the present. Those charts indicate pauses in temperature rise from about 1880 until about 1910 and again from the early 1940's until the early 1970's. A few years ago these same charts indicated a leveling of average global temperature. It seems thjat in recent years the scale of these charts has been changed to make them smaller and render it difficult to discern a trend. I am also concerned that officials of NOAA and possibly GISS have given press releases citing particular years and months as the hottest on record. I would prefer that they remain dispassionate providers of the most accurate temperature data possible. I am confused be the response to my comments. I thought, by virtue of its title, that this thread was concerned with the plausability of any pause in the rise of global temperature.
[TD] You will be less confused if you actually read the original post. No, wait, don't type yet; really read it for understanding. Now read my previous comments to you. Again, read carefully for understanding. This original post is about the myth of a recent pause in the long term trend of global warming. There is another post devoted to the other myth you asserted, which is that natural cycles are responsible for pauses, coolings, and warmings. (Edit: Better phrasing is that the myth you asserted is that the recent warming circa 1970 on is due to natural cycles rather than anthropogenic causes.)
You are incorrect about the scale of the charts being changed to make trends harder to see. The data all are available for anyone to graph, and there are a bazillion graphs from both official and unofficial producers, with a variety of scales and many that are user-settable. One example is the Skeptical Science trend calculator. Statistical analyses do not in any way depend on graph scales.
Your concern over press releases is off topic. It is also bizarre since those agencies merely are stating facts that you and anyone else can check.
Billev... You really wouldn't want to try to discern a trend by eye, since your eyes can easily deceive you. You need to test for trends through statistics. As the moderator pointed out, SkS has a trend calculator you can use to test trends on any of the data sets for any time period you like.
Billev @358 (and prior)
1) Using GISS LOTI, the peak 18 year trend in recent decades is from 1992-2009. At 0.23 C per decade, it is 39% greater than the trend from 1981-1998, and is statistically significant. Given that, claiming the "pause" or "hiatus" started "...about the year 2000" is clearly based "put[ting] too much emphasis on individual years" - specifically, 1998.
2) The following are the successive record years (including ties) since 1880:
Year Record Interval
1880 -0.21
1881 -0.12 1
1882 -0.11 1
1900 -0.09 18
1926 -0.09 26
1931 -0.09 5
1937 -0.02 6
1940 0.08 3
1941 0.13 1
1943 0.14 2
1944 0.25 1
1980 0.28 36
1981 0.33 1
1987 0.34 6
1988 0.4 1
1990 0.44 2
1995 0.46 5
1997 0.48 2
1998 0.63 1
2002 0.63 4
2005 0.69 3
2010 0.72 5
2014 0.75 4
(Interval is the number of years since the last year that set or equaled the then previous temperature record.)
As you can see, three new records have been set since 1998, and 1998 was equalled in 2002 as well. Your other putative "pause" is noted for the complete absense of records in the interval. Therefore the two phenomenon are not analogous, even if we ignore the fact that the current "pause" is an artifact of cherry picking 1998 as the start year.
3) The following is the GISS LOTI showing the running five year mean:
Looking at the five year moving average, it is very clear that there has been a more or less constant upward trend from about 1915-1970 with a single large excursion peaking in 1945. The description of the temperature history as a warming trend from 1910 to 1940 followed by a cooling trend/pause from 1940-1970 imposes a preconcieved pattern onto the data, and is not supported by that data. The 60 year sawtooth or sine pattern in the temperature data are a figment of the imagination. Therefore even if we were to be so statistically adventurous as to infer a long term cycle from a single repetion of the cycle, you would have no basis for predicting a pause from about 2000 (said pause not existing in any event).
The chart, just above, shows me a pause in temperature rise from 1880 until about 1910 and one from the mid 1940's until about the mid 1970's. it also could be indicating another pause beginning about 2000 but that is not clear from this chart. I realize that I used my eyes to observe this chart but wasn't it intended that I do that?
billev... You have to understand that global temperature changes for physical reasons. The 1880-1910 trend is during a period when human greenhouse gas emissions were still very low, but starting to have an effect. At that point in time, natural forcings could have more of an influence on global temperature.
Then, think about what was happening from the 1940's through 1970, and what specifically happened in 1970. First you had WW2 and then a huge amount of industrial growth post war, which put out atmospheric aerosols which tend to block sunlight and cool the planet. Then 1970 saw The Clean Air Act, which cleaned up a large portion of the aerosol output and, essentially, unmasked the underlying greenhouse gas forcing.
billev - I would suggest reading (and commenting upon) the Why did climate cool in the mid-20th Century, or possibly It's a natural cycle, where your recent posts would be relevent. They aren't in this thread.
Hint - Cooling mid-20th century isn't due to a natural cycle, but rather primarily due to anthropogenic factors and volcanic variability. Nor is there any reason whatsoever to expect some cycle-induced cooling to kick in.
Following KR's suggestion, I have responded to billev elsewhere.
Tamino yesterday posted temperatures with updated removal of influences for solar, reflective aerosols, and El Nino. Still no recent pause visible. Surprise.
Hi, The link to the ECMWF analyis of the HadCRUT data is broken. Any chance of a link to this study? Have Googled but can't find anywhere.
[DB] An archive copy of the study can be found here. I've also updated the rebuttal with this same link.
2 things...
using a trend as an answer as to why the current data doesnt matter is crazy. you cant say it doesnt matter look at the other 10 data points they lead to this... obviously they dont if they did there would be no cooling trend... lets break it down.. this is like a straight a student someone who had got 10 straight A's but on the final got an F.. The Proffesor then grades accordingly.. but the student says no... you didnt take into account the "Trend" my grade should be reflective of the past 10 measurements... would that really fly?
Also come on guys words have meaning.. you cant say that 2010 was the highest temerature on record, it was tied with 2005. if 2005 was just as warm 2010 cant be higher...
AJC1973 @366 : You will need to explain yourself more clearly ~ since your post [above] does not make much sense.
Words ( even "Proffesor" ) can have meaning ~ but they need to be allied with commonsense thinking. Is the world warming . . . or isn't it? The evidence shows clearly that it is . . . and word-games cannot alter the physical reality of it all.
AJC1973 @366:
1) You seem very confused about trends and variation. The point about the final point of data is that it tells you nothing about any other data point. In contrast, the trend sums up information about all the data, and does so in a way that usefully informs you about the next likely datapoint (see video below). People who only want us to look at the first and last datapoint are really cherry picking - trying to blind us to the truth by the carefull exclusion of data contrary to their narrative.
(Further comments)
2) Words to indeed have meaning, and expostulating about that fact won't lead us to ignore those meanings. Thus, here are the four most recent annual temperature records for the three major surface temperature records:
Year_____: _1998, _2005, _2010, _2014
HadCRUT4: 0.536, 0.544, 0.559, 0.567
NOAA____: _0.63, _0.66, _0.70, _0.74
GISS_____: _0.63, _0.69, _0.72, _0.74
As can easilly be seen, in each case 1998 < 2005 < 2010 < 2014. You want to say that 2014 = 2010, but that is not true.
Probably you have been confused by people inaccurately talking about a "statistical tie". That is because in each case 2005 lies within the uncertainty interval of 2010. Therefore, given the data it is statistically possible that 2010 was actually the warmest year, but the nominal value (or the mean estimate) places 2010 above 2005.
Note, this is not a 'statistical tie' (or worse, a case where 2010 is 'statistically indistinguishable' from 2005). That is because there are years which may have been (given uncertainty) warmer than 2005, but which could not have been (given uncertainty) warmer than 2010. Put another way, the probability that 2010 was the warmest year given the data is greater than the probability that 2005 was the warmest year.
Note, the same can be said of the relation between 1998 and 2005, and 2010 and 2014.
I went looking for whatever set of satellite data were least challengeable, and found the excellent graph by Dr. Mears. Since he is a firm believer in AGW and would not be somehow trying to manipulate data to make less of any warming trend, that seemed the safest bet.
However, examining his graph, what I see is that, neglecting the spike at 1998, the ups&downs of the chart from about 1994 or so make a classic SPC chart that shows a stable process. While the various computer programs predict a 1 to 1.5 increase in the time, the actual level is about 0.3 deg above centerline. Clearly the models are badly flawed, and in science, when your models don't work, you discard them. Thus it is not some kind of biased "denial" to take the position that there is no compelling evidence of a warming trend. Dr. Mears goes into all the reasons why we are seeing a "pause", but this is basically trying to discount what his own data indicate, based on the belief, not reasoning, that there MUST be warming going on.
The counter arguments of skeptics deserve something more than personal attacks on "denialists". The very use of such terminology is unworthy of those seeking truth. In Science the back and forth of discussions is supposed to be the norm up until there is compelling evidence to prove an hypothesis is valid. There may yet come clearer evidence of warming, or some of the alternative theories about sunspots, etc, may gather more evidence. Until then it would behoove all of us (yes, I am a scientist with degrees and long practice) to remain at least tolerant of views other than our own.
MarDivPhoto @369.
I assume you refer to the Carl Mears blog post here. You seem to be arguing here that it is Mears who is in denial, not you. That isn't a very good example for the "back & forth of discussions" you describe as being the stuff of science. And in dismissing Mears and his analysis, you replace it with "sunspots, etc." It is all a bit shallow, do you not think?
MarDivPhoto... Dr Mears actually suggests that the satellite data is not so good. On the blog MA Rogers links to he clearly states, "A similar, but stronger case [for model/observations] can be made using surface temperature datasets, which I consider to be more reliable than satellite datasets (they certainly agree with each other better than the various satellite datasets do!)."
You can't casually discard models when you don't fully understand the accuracy of the observations. It's just as likely, at this point, that models are doing a better than observations are.
I think at the heart of the problem is the question of "what is a good diagnostic for global warming". Neither the tropospheric temperatures (which the satellites attempt to measure) nor the surface temperature record (what actually matters to most to human activity) are particularly great because both are very noisy datasets with short term variations dominated by ENSO. You need long time spans to assess underlying behaviour. Tropospheric measurements (RSS/UAH) are particularly sensitive to ENSO showing much larger responses to La Nina and El Nino events than the surface record. Arguably, OHC is the best diagnostic we have. See here for more detail.
On top of that, determining ttropospheric temperatures from satellite MSU measurements is a tough problem. MSU isnt only way to measure tropospheric temperature - radiosondes also do it. However, it looks like the measurements systems have started to diverge.
Watch for science being published on this.
For MA Rodger-
Ah, the instant attack, how sadly predictable. No, I was not accusing Dr. Mears of being in denial, I was pointing out that he posted data that is easily interpreted one way, and then chose to offer reasons why it should not be interpreted that way. I did not immediately claim he must be wrong, or that there cannot be a warming process going on. I do not accuse those who believe strongly in AGW of being "alarmists" just as I don't think people should talk about "denialists". I believe in forming hypotheses and looking for data to confirm them, and that sometimes it will take time and more data to provide either the compelling evidence to support them, or to demonstrate that the reality is somehow different than was thought. After which the scientist goes back to the drawing board, so to speak, and starts thinking anew about how to understand the reality that has so far proven elusive. Hasn't this happened myriad times in science that we all know about?
Science in the ideal is practiced with total objectivity, and although we humans are probably incapable of achieving that ideal, as scientists we are supposed to be working really hard at it. The discussion of Climate Change long ago fell into deep pools of emotion on both sides, which is most unfortunate. But there should always be room for discussion without rancor among scientists.
As was pointed out recently at a congressional hearing, in very many areas, including NYC, the intelligent thing to do is to prepare for higher water and more frequent storms, rather than fighting about how to make people use less energy. After all, assuming AGW is actually valid, since we have no remotely practical ways to remove gigatons of CO2 from the atmosphere, then preparation for coming changes is mandatory. If AGW is valid, then we'll be better off, and if it turns out we don't need the levees, dikes, etc, there really won't be any harm. Shouldn't that be a focus for leaders all over the world? Especially since India and China are not about to stop their increase in the use of coal.
" I believe in forming hypotheses and looking for data to confirm them, and that sometimes it will take time and more data to provide either the compelling evidence to support them, or to demonstrate that the reality is somehow different than was thought." And for some reason you think this isnt what is happening in climate science? It also appears that you are also assuming that slower warming in say RSS is evidence against the AGW hypothesis? For this to be the case, then you need to present the case where climate science would think the current RSS measurements incompatible with theory. I am not aware of such published science. Quite the reverse.
You are also presenting a false dichotomy of adapt to change or use less energy. A third option is change to non-carbon generation. Studies to date suggest the latter is cheaper than adaptation (though yes, it should have started to happen decades ago). It is also more equitable because richer nations created the problem, and yet many poorer nations will feel the more severe effects and be less able to adapt.
Proposals have mostly focussed on getting sharp reduction in FF use in developed nations (they are both responsible for most of the damage to climate and most able to afford the transition), while giving poorer nations longer to change. If you want more pressure on China/India etc. then you put border carbon tax on goods created FF-generated energy.
MarDivPhoto [ @373 ] . . . You would considerably improve your "total objectivity" if you looked at the context of the situation you describe.
~ Dr Mears has made a number of suggestions on probabilities and possiblities regarding surface temperature short-term variations [ and not including his half-humorous Point No. 4 ]. Remember also, his blog entry was written in September 2014; well before the "warming effect" of the present big El Niño. [ an El Niño, of great embarrassment to denialists ]
~ Also implicit in his comments, is the objective background of the [surface temp] warming/not-warming question. We are dealing with a real physical world here . . . not some thought-experiment where coins are tossed / dice are rolled / etcetera. Thus, we have to deal with the observed couple of watts/m2 of planetary heat gain, which is occurring every day and every month of every year (volcano eruptions excepted!).
Where has this heat energy gone, and where is it going? No, it hasn't been teleported onto the Starship Enterprise or been teleported into the nearest Black Hole. MarDivPhoto, you yourself know [since you deny being a denialist] that this ongoing inflow of heat energy is 90% going into the oceans . . . and so it would be foolish to turn a blind eye on such a large fact. A fact, which (so to speak) tilts the playing field in favour of long-term surface warming: and which renders it ridiculous to hint that a "hiatus" is equally as likely as a "warming".
Indeed, ridiculous to suggest a "hiatus" in the sense of a "halt" in AGW.
(off-topic) As to building dikes & levees : of course that is an intelligent move, and sadly necessary . . . but it is far from intelligent to abandon effort to reduce the size of the CO2-caused problem.
"If AGW exists" . . . is a vacuous phrase, in view of the vast amounts of melting ice, the rising sea-levels, and all the other objective evidence of our global warming problem. It's a matter of overall context, isn't it !?