Climate Science Glossary

Term Lookup

Enter a term in the search box to find its definition.

Settings

Use the controls in the far right panel to increase or decrease the number of terms automatically displayed (or to completely turn that feature off).

Term Lookup

Settings


All IPCC definitions taken from Climate Change 2007: The Physical Science Basis. Working Group I Contribution to the Fourth Assessment Report of the Intergovernmental Panel on Climate Change, Annex I, Glossary, pp. 941-954. Cambridge University Press.

Home Arguments Software Resources Comments The Consensus Project Translations About Support

Bluesky Facebook LinkedIn Mastodon MeWe

Twitter YouTube RSS Posts RSS Comments Email Subscribe


Climate's changed before
It's the sun
It's not bad
There is no consensus
It's cooling
Models are unreliable
Temp record is unreliable
Animals and plants can adapt
It hasn't warmed since 1998
Antarctica is gaining ice
View All Arguments...


Username
Password
New? Register here
Forgot your password?

Latest Posts

Archives

Are surface temperature records reliable?

What the science says...

Select a level... Basic Intermediate Advanced

The warming trend is the same in rural and urban areas, measured by thermometers and satellites, and by natural thermometers.

Climate Myth...

Temp record is unreliable

"We found [U.S. weather] stations located next to the exhaust fans of air conditioning units, surrounded by asphalt parking lots and roads, on blistering-hot rooftops, and near sidewalks and buildings that absorb and radiate heat. We found 68 stations located at wastewater treatment plants, where the process of waste digestion causes temperatures to be higher than in surrounding areas.

In fact, we found that 89 percent of the stations – nearly 9 of every 10 – fail to meet the National Weather Service’s own siting requirements that stations must be 30 meters (about 100 feet) or more away from an artificial heating or radiating/reflecting heat source." (Watts 2009)

At a glance

It's important to understand one thing above all: the vast majority of climate change denialism does not occur in the world of science, but on the internet. Specifically in the blog-world: anyone can blog or have a social media account and say whatever they want to say. And they do. We all saw plenty of that during the Covid-19 pandemic, seemingly offering an open invitation to step up and proclaim, "I know better than all those scientists!"

A few years ago in the USA, an online project was launched with its participants taking photos of some American weather stations. The idea behind it was to draw attention to stations thought to be badly-sited for the purpose of recording temperature. The logic behind this, they thought, was that if temperature records from a number of U.S. sites could be discredited, then global warming could be declared a hoax. Never mind that the U.S. is a relatively small portion of the Earth;s surface. And what about all the other indicators pointing firmly at warming? Huge reductions in sea ice, poleward migrations of many species, retreating glaciers, rising seas - that sort of thing. None of these things apparently mattered if part of the picture could be shown to be flawed.

But they forgot one thing. Professional climate scientists already knew a great deal about things that can cause outliers in temperature datasets. One example will suffice. When compiling temperature records, NASA's Goddard Institute for Space Studies goes to great pains to remove any possible influence from things like the urban heat island effect. That effect describes the fact that densely built-up parts of cities are likely to be a bit warmer due to all of that human activity.

How they do this is to take the urban temperature trends and compare them to the rural trends of the surrounding countryside. They then adjust the urban trend so it matches the rural trend – thereby removing that urban effect. This is not 'tampering' with data: it's a tried and tested method of removing local outliers from regional trends to get more realistic results.

As this methodology was being developed, some findings were surprising at first glance. Often, excess urban warming was small in amount. Even more surprisingly, a significant number of urban trends were cooler relative to their country surroundings. But that's because weather stations are often sited in relatively cool areas within a city, such as parks.

Finally, there have been independent analyses of global temperature datasets that had very similar results to NASA. 'Berkeley Earth Surface Temperatures' study (BEST) is a well-known example and was carried out at the University of California, starting in 2010. The physicist who initiated that study was formerly a climate change skeptic. Not so much now!

Please use this form to provide feedback about this new "At a glance" section, which was updated on May 27, 2023 to improve its readability. Read a more technical version below or dig deeper via the tabs above!


Further details

Temperature data are essential for predicting the weather and recording climate trends. So organisations like the U.S. National Weather Service, and indeed every national weather service around the world, require temperatures to be measured as accurately as possible. To understand climate change we also need to be sure we can trust historical measurements.

Surface temperature measurements are collected from more than 30,000 stations around the world (Rennie et al. 2014). About 7000 of these have long, consistent monthly records. As technology gets better, stations are updated with newer equipment. When equipment is updated or stations are moved, the new data is compared to the old record to be sure measurements are consistent over time.
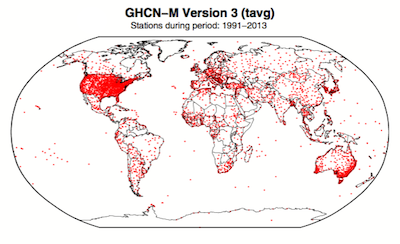
 GHCN-M stations

Figure 1. Station locations with at least 1 month of data in the monthly Global Historical Climatology Network (GHCN-M). This set of 7280 stations are used in the global land surface databank. (Rennie et al. 2014)

In 2009 allegations were made in the blogosphere that weather stations placed in what some thought to be 'poor' locations could make the temperature record unreliable (and therefore, in certain minds, global warming would be shown to be a flawed concept). Scientists at the National Climatic Data Center took those allegations very seriously. They undertook a careful study of the possible problem and published the results in 2010. The paper, "On the reliability of the U.S. surface temperature record" (Menne et al. 2010), had an interesting conclusion. The temperatures from stations that the self-appointed critics claimed were "poorly sited" actually showed slightly cooler maximum daily temperatures compared to the average.

Around the same time, a physicist who was originally hostile to the concept of anthropogenic global warming, Dr. Richard Muller, decided to do his own temperature analysis. This proposal was loudly cheered in certain sections of the blogosphere where it was assumed the work would, wait for it, disprove global warming.

To undertake the work, Muller organized a group called Berkeley Earth to do an independent study (Berkeley Earth Surface Temperature study or BEST) of the temperature record. They specifically wanted  to answer the question, “is the temperature rise on land improperly affected by the four key biases (station quality, homogenization, urban heat island, and station selection)?" The BEST project had the goal of merging all of the world’s temperature data sets into a common data set. It was a huge challenge.

Their eventual conclusions, after much hard analytical toil, were as follows:

1) The accuracy of the land surface temperature record was confirmed;

2) The BEST study used more data than previous studies but came to essentially the same conclusion;

3) The influence of the urban stations on the global record is very small and, if present at all, is biased on the cool side.

Muller commented: “I was not expecting this, but as a scientist, I feel it is my duty to let the evidence change my mind.” On that, certain parts of the blogosphere went into a state of meltdown. The lesson to be learned from such goings on is, “be careful what you wish for”. Presuming that improving temperature records will remove or significantly lower the global warming signal is not the wisest of things to do.

The BEST conclusions about the urban heat effect were nicely explained by our late colleague, Andy Skuce, in a post here at Skeptical Science in 2011. Figure 2 shows BEST plotted against several other major global temperature datasets. There may be some disagreement between individual datasets, especially towards the start of the record in the 19th Century, but the trends are all unequivocally the same.
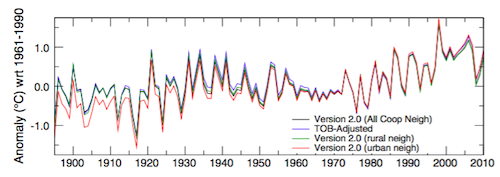
rural-urban T

Figure 2. Comparison of spatially gridded minimum temperatures for U.S. Historical Climatology Network (USHCN) data adjusted for time-of-day (TOB) only, and selected for rural or urban neighborhoods after homogenization to remove biases. (Hausfather et al. 2013)

Finally, temperatures measured on land are only one part of understanding the climate. We track many indicators of climate change to get the big picture. All indicators point to the same conclusion: the global temperature is increasing.


See also

Understanding adjustments to temperature dataZeke Hausfather

Explainer: How data adjustments affect global temperature recordsZeke Hausfather

Time-of-observation Bias, John Hartz

Berkeley Earth Surface Temperature Study: “The effect of urban heating on the global trends is nearly negligible,” Andy Skuce

Check original data

All the Berkeley Earth data and analyses are available online at http://berkeleyearth.org/data/.

Plot your own temperature trends with Kevin's calculator.

Or plot the differences with rural, urban, or selected regions with another calculator by Kevin

NASA GISS Surface Temperature Analysis (GISSTEMP) describes how NASA handles the urban heat effect and links to current data.

NOAA Global Historical Climate Network (GHCN) DailyGHCN-Daily contains records from over 100,000 stations in 180 countries and territories.

Last updated on 27 May 2023 by John Mason. View Archives

Printable Version  |  Offline PDF Version  |  Link to this page

Argument Feedback

Please use this form to let us know about suggested updates to this rebuttal.

Related Arguments

Further reading

Denial101x video

Here is a related lecture-video from Denial101x - Making Sense of Climate Science Denial

Additional video from the MOOC

Kevin Cowtan: Heat in the city

Comments

Prev  1  2  3  4  5  6  7  8  9  Next

Comments 176 to 200 out of 203:

  1. Joe RG Those changes, besides being very small, do not increase the appearance of global warming in the data set. You have to pay attention to the timing. The diffs in temp anomalies are similar for the most important part of the record from 1950 and on, and the increase in late data is matched by an increase in very early data. If you want to do a proper comparison that prvides the correct context, you should compare the NCDC records on the same graph before and after the corrections. You should also calculate the temp change since the 70s in the two data sets - that's the period when we think GHG forcing has become dominant. When I do the latter in excel, very quickly. I get a 0.164C/decade in the first and 0.166/decade in the second. Those are within 1% of each other and certainly within the error in the data. It would take not just 10, but 100 such revisions (all in the same direction) to produce anything near the temp trend apparent in the record. Your doubts are unfounded, and the insinuation unnecessary.
  2. Does anyone understand how to get to the raw data (i.e. the actual individual temperature measurements)? All I can find on line is various averages.
  3. giniajim @177, yes! Go to each separate national meteorological agency that supplied the data to either the Hadley Center/CRU or NOAA and purchase the data of each such agency, or arrange access to the data on a research basis. That is what has been done by each of the major global temperature indices, and each is bound by contract to not release the individual data, which remains the commercial property of the particular national meteorological agency that supplied it. You may want to note, however, that every independent attempt to determine the mean global temperature, whether based on thermometer or satellite data, has come up with effectively the same trend, including Muller's BEST project, and most recently (for US data only) Anthony Watt's team. The chance of finding significant error, therefore, seems remote.
  4. #178 You are omitting important finding in the Watt's et al. paper, poor station siting. The opposite-signed differences of maximum and minimum temperature trends are similar in magnitude, so that the overall mean temperature trends are nearly identical across site classifications (dumb luck?). The best-sited stations show no century-scale trend in diurnal temperature range in the lower 48 states. Time-of-observation corrected minimum temperature measurements at poorly sited stations have grown increasingly warm, compared to the best sited stations (sounds like possible contamination from urbanization). The poorly sited stations show an average temperature bias of +0.3 C, after taking into account the differing geographical distribution of stations. The authors recommend comprehensive siting studies be extended to the global historical climate network temperature data.
  5. Compare and contrast : John Nielsen-Gammon (i.e. one of the authors of Fall et al - not Watts et al, unfortunately for those who admire the blog scientist so much) had this to say on his website, comparing Fall et al to Menne et al : Menne et al - We find no evidence that the CONUS average temperature trends are inflated due to poor station siting. "Neither do we, but important questions remain regarding the effect of the adjustments and the different effects of siting and instruments that may bear on the CONUS average temperature trends." Compare that with the following : 1. Instrumental temperature data for the pre-satellite era (1850-1980) have been so widely, systematically, and unidirectionally tampered with that it cannot be credibly asserted there has been any significant “global warming” in the 20th century. 2. All terrestrial surface-temperature databases exhibit very serious problems that render them useless for determining accurate long-term temperature trends. 3. All of the problems have skewed the data so as greatly to overstate observed warming both regionally and globally. 4. Global terrestrial temperature data are gravely compromised because more than three-quarters of the 6,000 stations that once existed are no longer reporting. 5. There has been a severe bias towards removing higher-altitude, higher-latitude, and rural stations, leading to a further serious overstatement of warming. 6. Contamination by urbanization, changes in land use, improper siting, and inadequately-calibrated instrument upgrades further overstates warming. 7. Numerous peer-reviewed papers in recent years have shown the overstatement of observed longer term warming is 30-50% from heat-island contamination alone. 8. Cherry-picking of observing sites combined with interpolation to vacant data grids may make heat-island bias greater than 50% of 20th-century warming. Joseph D’Aleo and Anthony Watts Which does Watts believe now ? Has he squared the circle somehow ?
  6. #179 thepoodlebites at 00:47 AM on 27 May, 2011 The best-sited stations show no century-scale trend in diurnal temperature range in the lower 48 states. Time-of-observation corrected minimum temperature measurements at poorly sited stations have grown increasingly warm, compared to the best sited stations Very important finding, for it trashes one of the 10 Indicators of a Human Fingerprint on Climate Change (number 7). If an increased greenhouse effect is causing global warming, we should see certain patterns in the warming. For example, the planet should warm faster at night than during the day. This is indeed being observed (Braganza 2004, Alexander 2006). Unfortunately what is observed, is just the opposite. That is, the decreasing trend in diurnal temperature range is entirely due to poor station siting, which means it is a local thing, not a global one. The phenomenon is important enough to have a separate post at this site: The human fingerprint in the daily cycle. Now this claim has to be retracted as soon as practicable (ASAP). Journal of Geophysical Research - Atmospheres, 2011 in press (accepted 6 May 2011) doi:10.1029/2010JD015146 Analysis of the impacts of station exposure on the U.S. Historical Climatology Network temperatures and temperature trends Fall, S., A. Watts, J. Nielsen-Gammon, E. Jones, D. Niyogi, J. Christy & R. A. Pielke Sr. The logic is pretty simple and undeniable. If global warming is caused by an increased greenhouse effect, then the planet should warm faster at night than during the day. The planet is not warming faster at night than during the day. Therefore global warming is not caused by an increased greenhouse effect. (A => B) & ~B implies ~A. There is no escape route.
  7. thepoodlebites "The best-sited stations show no century-scale trend in diurnal temperature range in the lower 48 states." And with a lovely grinding noise the goalpost is moved. Watts started that project to "demonstrate" that poor siting induced a long term false trend in mean temperatures. It did not, as his analysis demonstrated. He found higher variances in poorly sited stations - no huge surprise. And now he's claiming that's invalidating the temperature record? Please...
  8. #182 KR at 02:52 AM on 27 May, 2011 And with a lovely grinding noise the goalpost is moved. KR, you are smarter than that, it's about attribution. It is a serious issue, can't make it go away by simple handwaving.
  9. Not so fast BP and Poodle, Zhou et al. (2010): "Observations show that the surface diurnal temperature range (DTR) has decreased since 1950s over most global land areas due to a smaller warming in maximum temperatures (Tmax) than in minimum temperatures (Tmin). This paper analyzes the trends and variability in Tmax, Tmin, and DTR over land in observations and 48 simulations from 12 global coupled atmosphere-ocean general circulation models for the later half of the 20th century. It uses the modeled changes in surface downward solar and longwave radiation to interpret the modeled temperature changes. When anthropogenic and natural forcings are included, the models generally reproduce observed major features of the warming of Tmax and Tmin and the reduction of DTR. As expected the greenhouse gases enhanced surface downward longwave radiation (DLW) explains most of the warming of Tmax and Tmin while decreased surface downward shortwave radiation (DSW) due to increasing aerosols and water vapor contributes most to the decreases in DTR in the models. When only natural forcings are used, none of the observed trends are simulated. The simulated DTR decreases are much smaller than the observed (mainly due to the small simulated Tmin trend) but still outside the range of natural internal variability estimated from the models." As for "There is no escape route." Indeed, Watts has been hung by his own petard. And Fall et al. (2010) is not without its problems. I will concede that DTR is perhaps not the best fingerprint for AGW, just because it is affected by so many factors other than GHGs, and there are clearly problems measuring it. The changes in the seasonal patterns (winter warming faster than summer) is a robust fingerprint. Looks like SkS will have to do a post to refute the chatter in denier circles about the Fall et al. paper.
  10. #184 Albatross at 03:11 AM on 27 May, 2011 Zhou et al. (2010): "Observations show that the surface diurnal temperature range (DTR) has decreased since 1950s over most global land areas due to a smaller warming in maximum temperatures (Tmax) than in minimum temperatures (Tmin). OK. This paper does not do any DTR data analisys of its own, it uses Vose 2005 (Maximum and minimum temperature trends for the globe: An update through 2004), which says: "a widespread decrease in the DTR was only evident from 1950-1980." Indeed. And that with no correction for station quality whatsoever. Therefore we know warming trend in the data at least since 1980 is not caused "by an increased greenhouse effect", but something else. That fingerprint thing should really be retracted.
  11. Berényi - The original contention by Watts was that the long term mean global temperature was not rising, and the indication was an artifact of distorted data. Are you claiming that this is correct? Watt's data shows that it isn't. The issues with day/night temperature range are quite different - you might profitably look at Braganza et al 2004, who note that observed diurnal temperature range (DTR) changes are actually much larger than predicted by models, most likely because of insufficient accounting for temperature driven cloud increases in those models. From that paper: "Observed DTR over land shows a large negative trend of 0.4C over the last 50 years that is very unlikely to have occurred due to internal variability. This trend is due to larger increases in minimum temperatures (0.9C) than maximum temperatures (0.6C) over the same period." Your call to "retract" the fingerprint statement is quite premature. But all that aside - Watt's initial accusations did not pan out, and shifting to the DTR is indeed a shifting of the goalposts.
  12. BP #185 -
    "Therefore we know warming trend in the data at least since 1980 is not caused "by an increased greenhouse effect", but something else."
    Is that a joke? Because one 'fingerprint' isn't obvious in one study over one period, we can ignore all other evidence and physics and blame the warming on some other unknown cause? All I can say is wow.
  13. I mean seriously, think about what you're saying. Even ignoring all the other mounds of evidence for anthropogenic warming, you're admitting the warming from 1950-1980 was largely anthropogenic, yet even though atmospheric CO2 has continued to grow rapidly since 1980, somehow it's no longer causing warming? Is that really what you're arguing? That the laws of physics were different in 1950-1980 than 1980-2011?
  14. #188 dana1981 at 04:58 AM on 27 May, 2011 you're admitting the warming from 1950-1980 was largely anthropogenic, yet even though atmospheric CO2 has continued to grow rapidly since 1980, somehow it's no longer causing warming? Are you confabulating? A have never admitted such a thing. Read carefully: warming trend in the data at least since 1980 is not caused "by an increased greenhouse effect", but something else. How can you read it as "the warming from 1950-1980 was largely anthropogenic" is beyond me. On top of that according to GISS there was hardly any warming between 1950 and 1980. Are you trying to say no-warming is also anthropogenic?
  15. BP @ 189--the implication of this statement: 'warming trend in the data at least since 1980 is not caused "by an increased greenhouse effect", but something else.' is clearly that prior to 1980, the warming was due to an increased greenhouse effect. You provide some wiggle room "at least since", but it's a fairly weak caveat.
  16. #186 KR at 04:52 AM on 27 May, 2011 observed diurnal temperature range (DTR) changes are actually much larger than predicted by models I see. You say the proposition "If global warming is caused by an increased greenhouse effect, then the planet should warm faster at night than during the day" is a false one. That's certainly a possibility. However, the fingerprint thing even in this case should be retracted. Because if A => B is false, the truth-value assigned to B should also be false. That false proposition reads "The planet is warming faster at night than during the day." In other words, you are claiming the temperature record is unreliable in this respect, which is exactly what Fall 2011 says. Or, alternately, you can insist the temperature record is reliable, but the fast increasing DTR is inconsistent with model predictions. In that case computational climate models (which, as you claim, indicate much smaller changes) are falsified.
  17. KR @186, Dana@187, It certainly is entertaining to watch those in denial about AGW and certain contrarians pounce on this finding by Fall et al. (2011) concerning the DTR over the US. John Nielsen-Gammon, one of the authors of Fall et al. agrees with the findings in Zhou et al. (2010). Also, as has been noted elsewhere, the findings by Fall et al. bring the model projections concerning DTR into closer alignment with observations, at least for the contiguous USA. The obfuscators should also look carefully at the Figures in Zhou et al. For example, Figs. 2 and 3 show that the observed and modeled decrease in DTR was not statistically significant over large portions of the contiguous US between 1950 and 1999. But step back and see what was observed and modeled for the globe, you now anthropogenic global warming. Zhou et al. say, "Evidently the ALL [natural and anthro forcing]simulations reproduce the global signal much better than the regional variations." What is critical to note is that without including anthro GHGs, the model projections in Zhou et al. (2010) were unable to produce the observed trends and patterns in both mean temperature and DTR (see their Fig. 5). A caveat though, Zhou et al. also conclude that: "The model simulated warming in Tmax and Tmin and the general decrease in DTR may reflect large-scale effects of enhanced global GHGs and direct effects of aerosols. The strong and persistent increase in DLW, which mainly reflects GHGs effects of a warmer and wetter atmosphere and to some extent of a warmer surface, is the dominant global forcing in explaining the simulated warming of Tmax and Tmin from 1950 to 1999, while its effect on DTR is very small. Decreases in DSW due to enhanced aerosols and PRW contribute most to the simulated decreases in DTR."
  18. BP @191, Please substantiate this "but the fast increasing DTR is inconsistent with model predictions", in particular the reference to "fast increasing". Vose et al. (a extended conference abstract it appears) state that: "Both maximum and minimum temperature increases from 1979-2004 whereas the DTR is basically trendless." And "Given the similarity between maximum and minimum temperature, the trend in the DTR (-0.001 °C dec-1) is not statistically significant at the 5% level." No reference to increasing, so one has to wonder how you arrived at the conclusion that DTR is rapidly increasing. And please actually read Zhou et al. (2010).
  19. More from Zhou et al. (2009) [with Vose a co author]: "In general, the magnitude of the downward trend of DTR and the warming trend of Tmin decreases with increasing precipitation amount, cloud cover, and LAI, i.e., with stronger DTR decreasing trends over drier regions. Such spatial dependence of Tmin and DTR trends on the climatological precipitation possibly reflects large-scale effects of increased global greenhouse gases and aerosols (and associated changes in cloudiness, soil moisture, and water vapor) during the later half of the twentieth century." So the decrease in DTR from elevated GHGs is (and should be) greatest where the signal is not swamped/muted by moisture-- that is in should be greatest in Arid and semi-arid areas. An interesting question is how changing atmospheric moisture, rainfall and cloud in response to AGW are affecting DTR. This is another reason why the seasonal fingerprint (winters warming faster than summers) is a more robust fingerprint. But it would be a huge mistake for the contrarians and those in denial to claim that issues with the DTR is a silver bullet that refutes the theory of AGW, or that is demonstrates that warming in the satellite era is not attributable to enhanced GHGs, especially if they choose to ignore/neglect the numerous other fingerprints in the process.
  20. One bizzare aspect of Berényi Péter's campaign to retract the fingerprints article is that it assumes that only one effect can be influencing the climate at any one time. Specifically, increasing GHG concentrations and increasing aerosol load will both decrease the Diurnal Temperature Range, although the former warms the globe while the latter cools it. In contrast decreasing GHG concentrations and decreasing aerosol load will increase DTR, although the former cools the globe and the later warms it. As it happens, over the continental US, from the 1950s to 1980, both GHG concentrations and aerosol load were increasing, generating a significant reduction in DTR, but since the early 1980's, GHG concentrations have been increasing but aerosol load has been decreasing. Absent the effect of GHG, we would expect an increase in DTR over that period. That we do not see it is therefore evidence of GHG warming (although not the strongest evidence). Even more bizzare, BP seems to think that the continental US is the Earth. If we check the data for Australia, which has a similar area to the continental US, we find a clear reduction in DTR with a trend of -0.05 degrees C per decade. The annual fluctuations are, of course, very large, and dominated by variations in humidity. Australia is also not the Earth, but the clear difference shows it is foolish to draw a conclusion about global trends from a study of 1.8% of the world's surface area.
  21. #192 Albatross at 06:26 AM on 27 May, 2011 What is critical to note is that without including anthro GHGs, the model projections in Zhou et al. (2010) were unable to produce the observed trends and patterns in both mean temperature and DTR What is critical to note is that without including equants, the model projections in Ptolemy (~150) were unable to produce the observed planetary orbits So what? Does that make equants real? Of course if you suppose the model is basically correct, you can prove (using observations) the equant can't be located at the center of the deferent circle (and neither one is colocated with the center of the Earth). Same logic.
  22. #195 Tom Curtis at 07:56 AM on 27 May, 2011 Even more bizzare, BP seems to think that the continental US is the Earth. If we check the data for Australia, which has a similar area to the continental US, we find a clear reduction in DTR with a trend of -0.05 degrees C per decade. No, I do not think that, I am not American. But as far as I know the SurfaceStations project is not a global one yet, specifically it is not extended to the surface stations of Australia. Therefore you can not tell us how much of the Australian trend is due to poor siting and how much of it is genuine. The aerosol card is also a convenient joker, for global atmospheric aerosol concentrations are not measured properly (and never were).
  23. Berényi - Straws, grasping at, see here. You, of all people, know that regional data can give contradictory indications to full global data. Yeesh.
  24. To be honest I don't usually pay a lot of attention to BP's comments (no offense intended - he just tends not to comment on posts I monitor the most). But I saw this comment and it just floored me. The lack of logic is staggering. In BP land, the lack of DTR trend from 1980-Present means the warming wasn't caused by GHGs. But the presence of a DTR trend from 1950-1980 somehow doesn't mean the warming during that period was caused by GHGs. WTF?? Of course as Tom Curtis notes in #195, DTR is influenced by other factors besides just GHGs (not to mention the world being larger than the USA), so concluding that the warming wasn't anthropogenic just because the DTR trend isn't evident during that period is, well, it's not very wise. Especially since it requires ignoring all other anthropogenic fingerprints, not to mention that pesky...what's the word I'm looking for? Oh yeah, physics! Sorry BP, but you really need to think about what you're arguing here. It's patently absurd.
  25. And BP @196, to fill the vacuity of his argument elects to argue a strawman about equants. Did you miss the bolded text from Zhou et al. (2009) and Zhou et al. (2010). You are making a fool of yourself BP. I remind you again that John Nielsen-Gammon, an author of Fall et al., agrees with Zhou et al. (2010). Unlike you,these guys are experts in this field and do in fact know better. Also, please read my post @192 very carefully, and actually look at the Figs. 2 and 3 in Zhou et al. (2010), better yet read the paper. "No, I do not think that, I am not American." But apparently you do when you mistakenly think that certain data from the US support your preconceived ideas and/or beliefs. Does your silence indicate that you implicitly agree that you fabricated the phrase "but the fast increasing DTR"? Please substantiate your claim or admit that you made it up.

Prev  1  2  3  4  5  6  7  8  9  Next

Post a Comment

Political, off-topic or ad hominem comments will be deleted. Comments Policy...

You need to be logged in to post a comment. Login via the left margin or if you're new, register here.

Link to this page


The Consensus Project Website

THE ESCALATOR

(free to republish)


© Copyright 2024 John Cook
Home | Translations | About Us | Privacy | Contact Us