Climate Science Glossary

Term Lookup

Enter a term in the search box to find its definition.

Settings

Use the controls in the far right panel to increase or decrease the number of terms automatically displayed (or to completely turn that feature off).

Term Lookup

Settings


All IPCC definitions taken from Climate Change 2007: The Physical Science Basis. Working Group I Contribution to the Fourth Assessment Report of the Intergovernmental Panel on Climate Change, Annex I, Glossary, pp. 941-954. Cambridge University Press.

Home Arguments Software Resources Comments The Consensus Project Translations About Support

Bluesky Facebook LinkedIn Mastodon MeWe

Twitter YouTube RSS Posts RSS Comments Email Subscribe


Climate's changed before
It's the sun
It's not bad
There is no consensus
It's cooling
Models are unreliable
Temp record is unreliable
Animals and plants can adapt
It hasn't warmed since 1998
Antarctica is gaining ice
View All Arguments...


Username
Password
New? Register here
Forgot your password?

Latest Posts

Archives

Are surface temperature records reliable?

What the science says...

Select a level... Basic Intermediate Advanced

The warming trend is the same in rural and urban areas, measured by thermometers and satellites, and by natural thermometers.

Climate Myth...

Temp record is unreliable

"We found [U.S. weather] stations located next to the exhaust fans of air conditioning units, surrounded by asphalt parking lots and roads, on blistering-hot rooftops, and near sidewalks and buildings that absorb and radiate heat. We found 68 stations located at wastewater treatment plants, where the process of waste digestion causes temperatures to be higher than in surrounding areas.

In fact, we found that 89 percent of the stations – nearly 9 of every 10 – fail to meet the National Weather Service’s own siting requirements that stations must be 30 meters (about 100 feet) or more away from an artificial heating or radiating/reflecting heat source." (Watts 2009)

At a glance

It's important to understand one thing above all: the vast majority of climate change denialism does not occur in the world of science, but on the internet. Specifically in the blog-world: anyone can blog or have a social media account and say whatever they want to say. And they do. We all saw plenty of that during the Covid-19 pandemic, seemingly offering an open invitation to step up and proclaim, "I know better than all those scientists!"

A few years ago in the USA, an online project was launched with its participants taking photos of some American weather stations. The idea behind it was to draw attention to stations thought to be badly-sited for the purpose of recording temperature. The logic behind this, they thought, was that if temperature records from a number of U.S. sites could be discredited, then global warming could be declared a hoax. Never mind that the U.S. is a relatively small portion of the Earth;s surface. And what about all the other indicators pointing firmly at warming? Huge reductions in sea ice, poleward migrations of many species, retreating glaciers, rising seas - that sort of thing. None of these things apparently mattered if part of the picture could be shown to be flawed.

But they forgot one thing. Professional climate scientists already knew a great deal about things that can cause outliers in temperature datasets. One example will suffice. When compiling temperature records, NASA's Goddard Institute for Space Studies goes to great pains to remove any possible influence from things like the urban heat island effect. That effect describes the fact that densely built-up parts of cities are likely to be a bit warmer due to all of that human activity.

How they do this is to take the urban temperature trends and compare them to the rural trends of the surrounding countryside. They then adjust the urban trend so it matches the rural trend – thereby removing that urban effect. This is not 'tampering' with data: it's a tried and tested method of removing local outliers from regional trends to get more realistic results.

As this methodology was being developed, some findings were surprising at first glance. Often, excess urban warming was small in amount. Even more surprisingly, a significant number of urban trends were cooler relative to their country surroundings. But that's because weather stations are often sited in relatively cool areas within a city, such as parks.

Finally, there have been independent analyses of global temperature datasets that had very similar results to NASA. 'Berkeley Earth Surface Temperatures' study (BEST) is a well-known example and was carried out at the University of California, starting in 2010. The physicist who initiated that study was formerly a climate change skeptic. Not so much now!

Please use this form to provide feedback about this new "At a glance" section, which was updated on May 27, 2023 to improve its readability. Read a more technical version below or dig deeper via the tabs above!


Further details

Temperature data are essential for predicting the weather and recording climate trends. So organisations like the U.S. National Weather Service, and indeed every national weather service around the world, require temperatures to be measured as accurately as possible. To understand climate change we also need to be sure we can trust historical measurements.

Surface temperature measurements are collected from more than 30,000 stations around the world (Rennie et al. 2014). About 7000 of these have long, consistent monthly records. As technology gets better, stations are updated with newer equipment. When equipment is updated or stations are moved, the new data is compared to the old record to be sure measurements are consistent over time.
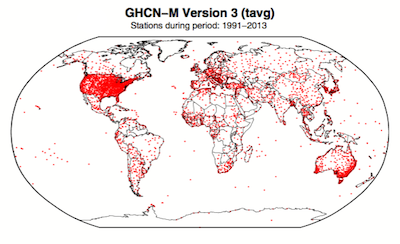
 GHCN-M stations

Figure 1. Station locations with at least 1 month of data in the monthly Global Historical Climatology Network (GHCN-M). This set of 7280 stations are used in the global land surface databank. (Rennie et al. 2014)

In 2009 allegations were made in the blogosphere that weather stations placed in what some thought to be 'poor' locations could make the temperature record unreliable (and therefore, in certain minds, global warming would be shown to be a flawed concept). Scientists at the National Climatic Data Center took those allegations very seriously. They undertook a careful study of the possible problem and published the results in 2010. The paper, "On the reliability of the U.S. surface temperature record" (Menne et al. 2010), had an interesting conclusion. The temperatures from stations that the self-appointed critics claimed were "poorly sited" actually showed slightly cooler maximum daily temperatures compared to the average.

Around the same time, a physicist who was originally hostile to the concept of anthropogenic global warming, Dr. Richard Muller, decided to do his own temperature analysis. This proposal was loudly cheered in certain sections of the blogosphere where it was assumed the work would, wait for it, disprove global warming.

To undertake the work, Muller organized a group called Berkeley Earth to do an independent study (Berkeley Earth Surface Temperature study or BEST) of the temperature record. They specifically wanted  to answer the question, “is the temperature rise on land improperly affected by the four key biases (station quality, homogenization, urban heat island, and station selection)?" The BEST project had the goal of merging all of the world’s temperature data sets into a common data set. It was a huge challenge.

Their eventual conclusions, after much hard analytical toil, were as follows:

1) The accuracy of the land surface temperature record was confirmed;

2) The BEST study used more data than previous studies but came to essentially the same conclusion;

3) The influence of the urban stations on the global record is very small and, if present at all, is biased on the cool side.

Muller commented: “I was not expecting this, but as a scientist, I feel it is my duty to let the evidence change my mind.” On that, certain parts of the blogosphere went into a state of meltdown. The lesson to be learned from such goings on is, “be careful what you wish for”. Presuming that improving temperature records will remove or significantly lower the global warming signal is not the wisest of things to do.

The BEST conclusions about the urban heat effect were nicely explained by our late colleague, Andy Skuce, in a post here at Skeptical Science in 2011. Figure 2 shows BEST plotted against several other major global temperature datasets. There may be some disagreement between individual datasets, especially towards the start of the record in the 19th Century, but the trends are all unequivocally the same.
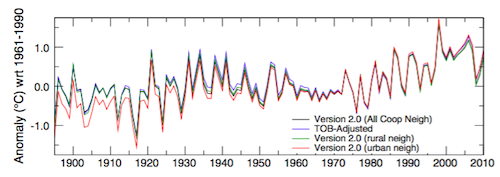
rural-urban T

Figure 2. Comparison of spatially gridded minimum temperatures for U.S. Historical Climatology Network (USHCN) data adjusted for time-of-day (TOB) only, and selected for rural or urban neighborhoods after homogenization to remove biases. (Hausfather et al. 2013)

Finally, temperatures measured on land are only one part of understanding the climate. We track many indicators of climate change to get the big picture. All indicators point to the same conclusion: the global temperature is increasing.


See also

Understanding adjustments to temperature dataZeke Hausfather

Explainer: How data adjustments affect global temperature recordsZeke Hausfather

Time-of-observation Bias, John Hartz

Berkeley Earth Surface Temperature Study: “The effect of urban heating on the global trends is nearly negligible,” Andy Skuce

Check original data

All the Berkeley Earth data and analyses are available online at http://berkeleyearth.org/data/.

Plot your own temperature trends with Kevin's calculator.

Or plot the differences with rural, urban, or selected regions with another calculator by Kevin

NASA GISS Surface Temperature Analysis (GISSTEMP) describes how NASA handles the urban heat effect and links to current data.

NOAA Global Historical Climate Network (GHCN) DailyGHCN-Daily contains records from over 100,000 stations in 180 countries and territories.

Last updated on 27 May 2023 by John Mason. View Archives

Printable Version  |  Offline PDF Version  |  Link to this page

Argument Feedback

Please use this form to let us know about suggested updates to this rebuttal.

Related Arguments

Further reading

Denial101x video

Here is a related lecture-video from Denial101x - Making Sense of Climate Science Denial

Additional video from the MOOC

Kevin Cowtan: Heat in the city

Comments

Prev  1  2  3  4  5  6  7  8  9  10  11  12  13  14  15  16  17  18  19  20  Next

Comments 201 to 225 out of 521:

  1. The so-called "Surface Stations Project" is a pile of idiotic nonsense that is of use only to those defined by Trenberth as "fools and charlatans." It has been proven irrelevant frome early on by the ones interested enough to follow up on it with real data analysis. It is not worth bothering with.
  2. #199 dana1981 at 09:08 AM on 27 May, 2011 But the presence of a DTR trend from 1950-1980 somehow doesn't mean the warming during that period was caused by GHGs. WTF?? There was in fact no warming between 1950 and 1980. Especially since it requires ignoring all other anthropogenic fingerprints Whenever you do not know what to say, start talking about something else. After all that's the way science is done. Or was it politics?
  3. #200 Albatross at 09:21 AM on 27 May, 2011 Does your silence indicate that you implicitly agree that you fabricated the phrase "but the fast increasing DTR"? Please substantiate your claim or admit that you made it up. Try reading the thread every now and then. It was KR quoting Braganza et al 2004, who said "observed diurnal temperature range (DTR) changes are actually much larger than predicted by models". It's a pity it was fabricated.
  4. Berényi - Then you have clearly misread the information I provided. "...observed diurnal temperature range (DTR) changes are actually much larger than predicted by models" (emphasis added) And you then failed to read the quote about the data: "This trend is due to larger increases in minimum temperatures (0.9C) than maximum temperatures (0.6C) over the same period." The DTR has reduced over this period, BP - you've read into it what you wanted, and not encompassed the entire quote. Which means, apparently, that you did not read the paper, either.
  5. #201 Philippe Chantreau at 10:04 AM on 27 May, 2011 The so-called "Surface Stations Project" is a pile of idiotic nonsense I see. Checking the quality of a measurement system is "a pile of idiotic nonsense" along with NOAA directive 10-1302 of course, Requirements and Standards for NWS Climate Observations. Is it some innovative new trend in science?
  6. [DB] More cherries for BP Come on. Until 1943 there was a single GHCN station south of 60S, BASE ORCADAS (-60.75 -44.72). Therefore the huge 1950-1980 positive temperature anomaly in the south (relative to 1919-1949) is entirely believable, isn't it?
    Response:

    [DB] Curious, that the temperature records show an inexorable rise every single year, isn't it? ;)

    Let us not focus on the few cherry-flavored flat or declining spots lest we miss that overall rising signal in the noisy background:

    10

    [Source]

  7. Berényi Péter @197, the diurnal temperature range data for Australia are taken from the Australian high-quality climate site network, which has been vetted for the quality of the stations, with stations rating poor(4) or very poor(5) on a five point scale having been removed from the network. I have seen some attempts by Australian deniers to question the network, and they are pathetic. Indicative of how desperate they are, they have argued that one outback site should be classified as urban because it is located near some graded runways, ie, because it is near (within 50 meters) of exposed dirt in an area which is 80% exposed dirt. is a discussion of another site they considered to be "urban". Had there been substantial issues to raise, I'm sure the deniers would have latched on to them. By inference, therefore, the genuine efforts of the Bureau of Meteorology to maintain high quality meteorological data have paid of. Further, aerosol optical depth is not well quantified, and indirect aerosol effects on cloud albedo are even less well quantified, but aerosol emissions are well known. Therefore, whatever the net aerosol forcing for a given aerosol load, we know that it increased from the 1950's through to the 1970's, decreased there after, and has been increasing again over the last decade:
  8. Berényi Péter @206:
    "Come on. Until 1943 there was a single GHCN station south of 60S, BASE ORCADAS (-60.75 -44.72). Therefore the huge 1950-1980 positive temperature anomaly in the south (relative to 1919-1949) is entirely believable, isn't it?"
    We should also note that: 1)There was also a very large whaling fleet operating in Antarctic waters; and 2)With the exception of water near the West Antarctic Peninsular, and hence Orcadas Base, the anomaly south of about 60 degrees is not shown in the anomaly map you are objecting to. Your objection, therefore, is without substance.
  9. #208 Tom Curtis at 14:01 PM on 27 May, 2011 With the exception of water near the West Antarctic Peninsular, and hence Orcadas Base, the anomaly south of about 60 degrees is not shown in the anomaly map you are objecting to. But it is shown in the accompanying "zonal mean" graph (with no error bars whatsoever). Your remark, therefore, is without substance.
  10. Berényi Péter @209, the accompanying "zonal mean" graph is exactly that, an accompanying graph. It is not published by GISS apart from the relevant map which is hte primary data; and nor was it published apart from it here. As such people seeing it are unlikely to be confused into thinking the zonal mean from 60 to 80 degrees south represents anything but the obvious measured anomaly rather that the equally obvious grey unmeasured areas. Further, the important thing is the 0.05 global mean anomaly between the respective periods. If you think noticing a large number of temperature measurements where you claim there was only one, and noticing that no claim was made of measurements in unmeasured areas contrary to your claim is without substance, then no wonder you are a denier. However, seeing you object to that map, consider the following which, as it compares 1940-1960 to 1970-1990 is more relevant to your claim of no warming between 1950 and 1980. Notice that the anomaly is 0.08 degrees C. Or perhaps you would prefer a simple comparison of 1950 with 1980 which has a 0.29 degree c anomaly. Clearly you claim is false. As this post shows that, you will no doubt consider it also without substance.
  11. If BP is refering to Anthony Watts' miserable operation, I stand by my statement. There is data analysis to substantiate.
  12. BP @203, Try reading the thread every now and then. It was KR quoting Braganza et al 2004, who said "observed diurnal temperature range (DTR) changes are actually much larger than predicted by models". It's a pity it was fabricated." Actually BP, you need to read very carefully what you wrote @191. I know what Braganza found, and KR's reading of the paper @186 is correct. Braganza (2004): "Observed DTR over land shows a large negative trend of 0.4C over the last 50 years that is very unlikely to have occurred due to internal variability. This trend is due to larger increases in minimum temperatures (0.9C) than maximum temperatures (0.6C) over the same period." Inconvenient for you and Watts is that Fall et al's work brings the models into closer agreement with the observations. Watts loses again. Also, the models did not predict a statistically significant decline over much of the contiguous USA between 1950 and 1999, consistent with the findings of Fall et al. (see Fig. 3 in Zhou et al. 2010). Watts loses again. What was fabricated? By whom? The only things that was possibly fabricated was the following claim made by you @191 when you said: "Or, alternately, you can insist the temperature record is reliable, but the fast increasing DTR is inconsistent with model predictions." Do you see that word "increasing" that you typed? Perhaps you meant to say was something like "the rate of decrease in observed DTR is greater than that predicted by the models over the USA". Do you not read what you type before disparaging others? Again, if anything, Fall et al's work actually brings the models into closer agreement with the observations over the USA, and one of the paper's authors Dr. John Nielsen-Gammon agrees with that. Another "skeptic" bubble burst.... KR, @186 "The issues with day/night temperature range are quite different - you might profitably look at Braganza et al 2004, who note that observed diurnal temperature range (DTR) changes are actually much larger than predicted by models, most likely because of insufficient accounting for temperature driven cloud increases in those models."
  13. Read this recently: ...data manipulation the GISS gets away with every day. You see, although the GISS receives temperature readings from thousands of global stations, it uses only a fraction of them. Unbelievably, the GISS still fills out the thousands of spreadsheet cells, using figures from other sources. So what does the GISS put in a cell that used to have actual data readings? Well, it is using a smoothing technique that allows it to use any temperature reading taken within 750 miles of the location the empty cell represents. For instance, rather than use a temperature reading from a mountaintop in Bolivia, the GISS can substitute a reading from the coast of Peru or from a steamy Brazilian jungle. Does no one in government see how a warming bias might, therefore, be baked into the global record? Accurate?
    Response:

    [DB] "Accurate?"

    Nope.  Not in the least.  The various datasets (not just GISS) have been checked & rechecked, both internally and independently.  Even amateur "scientists" have replicated the global rise in temperatures using as little as 10% of the station data because there is a global warming signal in the data.

    You are repeating memes long ago proven false.  Care to share where you heard this and why you bring it up here (meaning SkS; this is definitely an appropriate thread)?

  14. 213, econ101lab, Your quote is from Climate Realists. The tone there is blatantly anti-science and conspiratorial, to the extent of being what I would label lunatic fringe. Other comments from that same page include:
    ...no shortage of warmists waiting to pounce... What is troubling, however, is that some of the other candidates for the Republican nomination still accept the theory of man-made warming. Worse, they are apparently prepared to act on their beliefs if elected president. The planet is warming. Well, it was until 1998, when the warming trend abruptly ceased. In truth, it has been warming since 1850, when the last mini–Ice Age ended. The scientists at Great Britain’s Climatic Research Unit (CRU) admit to using statistical sleights of hand to change the temperature record, so as to show more warming.
    How can you take such utter nonsense seriously? How can you even bother to ask about such drivel?
  15. Actually it's from a Jim Lacy article in National Review online followed by: The graph below shows how damaging this smoothing is to the data record. Note the warming in the Arctic region. It seems like reason for concern, until one realizes that almost no actual data were used to create those dangerous-looking red zones. Instead, readings from almost 1,000 miles south of the polar regions were substituted for the missing data. How does such a substitution make sense unless one can convince oneself that it gets colder the closer one gets to the equator? The graph doesn't copy and paste. You can check out the whole piece here: http://www.nationalreview.com/articles/275396/perry-and-global-warming-jim-lacey If true, it's not drivel. If false, I like to check around and see what other people have to say. Your affronted attitude I find odd. Why should I trust you any more than Lacy? I don't know either one of you. I like to read from a broad spectrum of opinions and then check around. I bring it here as there seems to be an attempt to use real data. Of course the same could be said from sites on the other side of the question. That being said, I recently read about the CERN results here:http://wattsupwiththat.com/2011/08/24/breaking-news-cern-experiment-confirms-cosmic-rays-influence-climate-change/ and here: http://pajamasmedia.com/tatler/2011/07/20/cern-update-bombshell-in-the-cosmic-ray-data/ and here: http://www.thegwpf.org/science-news/3699-cern-experiment-confirms-cosmic-rays-influence-climate-change.html Not being a scientist but an economist, I find the lack of certainty familiar (the "science" of economics is equally fraught with uncertainty) which makes me question the "settled science" position of one side of this arguement. I also find the proposed solutions by the AGW group absurd when looked at economically. In Michael Levitt's Superfreakonomics, there are proposed mitigation solutions (vs prevention) by a company called Intellectual Ventures headed by Nathan Myrvold (ex CTO of Microsoft) which would cause far less global economic disruption but achieve the same end result. SoSphaerica, pls keep you patronizing comments out of the thread.
    Response:

    [DB] Do you mean this graphic:

    Junk Science

    You seem to frequent disinformation websites, where the focus is on conspiracy theories and not on the primary literature itself.

    No wonder you take the position you do.

  16. Re: 213 Can you point me to some of the data to which you refer regarding the data sets being checked? Not that I find what you say not credible, but I like to check things for myself. Thanks
    Response:

    [DB] "Not that I find what you say not credible, but I like to check things for myself."

    Then you would be the first skeptic to actually follow through and do the hard work.  However, I suggest you start here, with additional resources available here and here.

    Please be sure to report back your results to us.

  17. Any comment on the CERN results? Are you seriously saying you support the "science is settled" position? If so, this site just lost all credibility with me if you leave no room for new scientific evidence or serious scientific inquiry. Sorry to take up your time.
    Response:

    [DB] As someone new to SkS, you probably don't know how to best take advantage of all the resources this site has to offer.

    There is an immense amount of reference material discussed here and it can be a bit difficult at first to find an answer to your questions.  That's why we recommend that Newcomers, Start Here and then learn The Big Picture.

    I also recommend watching this video on why CO2 is the biggest climate control knob in Earth's history.

    Further general questions can usually be be answered by first using the Search function in the upper left of every Skeptical Science page to see if there is already a post on it (odds are, there is).  If you still have questions, use the Search function located in the upper left of every page here at Skeptical Science and post your question on the most pertinent thread.

    Remember to frame your questions in compliance with the Comments Policy and lastly, to use the Preview function below the comment box to ensure that any html tags you're using work properly.

    Participants who take the time to ensure a less incendiary tone will also find a great deal of positive and contributory dialogue with other, more knowledgeable participants here (some of whom are actual climate scientists).

  18. econ101lab @217 There is an entire post on the CERN results. No one is ignoring. You're just not looking hard enough. You could also read previous posts in this very thread touching on the very issues you mention in other posts. If you are just going to (re)post insinuation of fraud without basis, I don't see how you will add anything here.
  19. econ101lab - Welcome to SkS! Regarding CERN, I would suggest taking a look at: * ConCERN Trolling on Cosmic Rays, Clouds, and Climate Change * The CERN/CLOUD results are surprisingly interesting… (RealClimate) Now, on Arctic temperatures: * DMI and GISS Arctic Temperatures: Hide the Increase? Local temperatures vary a lot. However, the temperature anomaly, the change in temperature over time, season, climate changes, etc., that anomaly does not vary much over fairly large distances. Please look at some of the information on how these averages are done - on this site, that can be found at: * Of Averages and Anomalies - Part 1A. A Primer on how to measure surface temperature change * Part 1B. * Of Averages & Anomalies - Part 2A. Why Surface Temperature records are more robust than we think * Part 2B There's a lot of (dis)information out there, and it all sounds plausible at first glance. I would strongly encourage taking a look at how these temperatures are arrived at, and seeing why what gets posted on these 'skeptical' blogs is incorrect.
  20. Thank you KR!
  21. econ101lab, you stated you like to look at a variety of sources and check. That would be the right attitude. However, from what you wrote so far, I see little variety in the type of sources you look at and you are asking others to check for you. How come? In one of your posts, you say "if true." That suggests you have not actually looked into whether or not it is. As for the CERN results, one would be hard pressed to point exactly what words or numbers from Kirkby et al can be used to support the flashy headlines that you deemed appropriate to reproduce here. Others have supplied the links you need to check into that but, once again, I am surprised that you had not already found these on your own. The kind of skeptical attitude you claim would have allowed you to find these sources in only a few minutes of search engine use.
  22. econ101lab @215, your source appears to suggest that GISSTEMP temperatures are arrived at by simply cutting and pasting some other temperature from within a 1200 km radius. That is simply false. Rather, all stations within a 1200 km radius (over land) are given a weighting depending on their distance from center of the cell. The weighting is (1200 - distance in km from the center of the cell)/1200. All stations within range are then used to give a weighted average for the cell. The procedure is explained in detail in Averages and Anomalies part 1B. Very importantly, the HadCRUT is calculated by taking a simple mean of all stations within a cell, with no extrapolation. This is important because HadCRUT and GissTemp show effectively the same trend if you exclude polar regions, ie, the regions HadCRUT does not cover due to lack of surface stations. That shows the GissTemp procedure does not introduce a spurious trend. The comparison between GistTemp and DMI in the Arctic shows their extrapolation does not introduce a spurious trend in the Arctic either. Beyond that I heartily recommend you read the links provided by DB (inline comment @216) and KR @219. You should also add Ned's article on Assessing global surface temperature reconstructions to your reading. Finally, climate science is a diverse beast. Some parts of it are as well established as any other scientific theory, while other parts are relatively tenuous. Very little of it is as tenuous as even the best established theorems of macro-economics, and certainly the recent temperature record is not open to serious dispute. Is it settled science? Well researchers in the field will always try to improve their methods and eliminate assumptions that may have led them astray. But the results are sufficiently well established that people outside that narrow field can take the current results as being settled for the purposes of any further research they need to do.
  23. Tom, I will read your recommendation re: Ned's article. I fully accept your observation of the tenuous nature of macro economics as accurate due to the long time spans needed for observation and the virtually infinite and unobservable micro variables which can cumulatively affect the macro picture. This is why I have a tough time getting my arms around the "settled science" position. I'm not trying to be difficult but when two thirds of the planet isn't observed (either water temp or air temp over water) and one of the most significant variables isn't even modeled or clearly understood (clouds and cloud formation), the certainty smacks of intellectual hubris. As a non-climatologist, are there other untracked or unobservable variables of which I am unaware? Again, not trying to be a butt here. While I think Keynes and Galbraith were wrong based on the observable record and Friedman on the money, others dispute that looking at the exact same historical record (of course perhaps taking different micro impacts into account). OK, I've begun doing the reading suggested by KR (thank you again KR). I used the search function, unsuccessfully, to try and find previous posts for a few questions I have. My questions are regarding temperature records and how they're calculated. I ask the questions because I do not understand so please take them in that vein. First, wouldn't the cumulative error in a cell or block that is extrapolated vs observed, quickly make the data from that cell meaningless and affect the long term results more the longer it was used? Particularly if it was in close proximity to the central station and hence had a greater weighting? Second, Mr. Tamblyn does an excellent job laying this out for a non-climatologist. I understand the teleconnection concept and it makes sense as long as the station extrapolations take place from similar altitudes. I can think of numerous locations where I have been personally, where locations 50-60 miles apart might vary 50-60 degrees F. Palm Springs vs Big Bear Lake in California during the winter is an excellent example. I have played golf in the morning in 80 degrees in PS and then gone to the top of the tram where there's snow on the ground and the temp is in the 20's. If Big Bear were to be extrapolated from either LA or Palm Springs (both about 60 miles away) they would have significant weight due to proximity but no relevance. And is his contention that the Andes and coastal Peru have the same weather systems passing over accurate? The Andes are much higher than the San Gabriel Mtn's and the SGM's actually stop weather from the coast from moving inland. Meaning that one location (LA) has totally different weather from one 90 miles away (PS) precisely due to a geographical feature. Western and eastern Colorado create a similar situation. As do the Ngorongoro Crater and the Serengeti (went both places this summer, put it on your bucket list!) I looked at the gridded map and can see numerous places globally where this could logically happen. I see how it can be adjusted for if there are only occasional lapses in observed temp, but how is it adjusted when there is no station? Satellite? Thank you. Back to my homework.
  24. Philippe, you question my sources. What do you think I am doing here? Rather than snarky comments about my motives, I appreciate the willingness of KR, Tom, and DB to show me how the site works and give me a start on how to find information. Geez, lighten up.
    Response: You'll find less "snarkiness" in responses to you if you refrain from writing so stridently and confidently before you have read up on the rudiments. Folks here have a hair trigger for such behavior because it happens so often. Your failure to understand the really, really fundamental fact that temperature anomalies are used, is exactly such a case.
  25. econ101ab @223, it is very late here, and I am very tired, so I will only respond to your second point tonight. Essentially, you are ignoring the fact that the temperature calculations are for temperature anomalies rather than for absolute temperatures. An extrapolation of absolute temperatures would be absurd for exactly the reasons you give. The temperature anomaly, essentially the absolute temperature minus the mean temperature over some period, will not be so affected. Specifically, if it is an unusually warm day at Palm Springs, it will probably be an unusually warm day at Big Bear Lake as well. The difference in their anomalies on any day will be small even though the difference in their absolute temperature on every day is large. This is explained in greater detail in On Averages and Anomalies Part 1. (Link give by KR in 219 above.)

Prev  1  2  3  4  5  6  7  8  9  10  11  12  13  14  15  16  17  18  19  20  Next

Post a Comment

Political, off-topic or ad hominem comments will be deleted. Comments Policy...

You need to be logged in to post a comment. Login via the left margin or if you're new, register here.

Link to this page


The Consensus Project Website

THE ESCALATOR

(free to republish)


© Copyright 2024 John Cook
Home | Translations | About Us | Privacy | Contact Us