


 Arguments


Are surface temperature records reliable?
What the science says...
| Select a level... |
 Basic
Basic
|
 Intermediate
|
 Advanced
| ||||
|
The warming trend is the same in rural and urban areas, measured by thermometers and satellites, and by natural thermometers. |
|||||||
Climate Myth...
Temp record is unreliable
"We found [U.S. weather] stations located next to the exhaust fans of air conditioning units, surrounded by asphalt parking lots and roads, on blistering-hot rooftops, and near sidewalks and buildings that absorb and radiate heat. We found 68 stations located at wastewater treatment plants, where the process of waste digestion causes temperatures to be higher than in surrounding areas.
In fact, we found that 89 percent of the stations – nearly 9 of every 10 – fail to meet the National Weather Service’s own siting requirements that stations must be 30 meters (about 100 feet) or more away from an artificial heating or radiating/reflecting heat source." (Watts 2009)
At a glance
It's important to understand one thing above all: the vast majority of climate change denialism does not occur in the world of science, but on the internet. Specifically in the blog-world: anyone can blog or have a social media account and say whatever they want to say. And they do. We all saw plenty of that during the Covid-19 pandemic, seemingly offering an open invitation to step up and proclaim, "I know better than all those scientists!"
A few years ago in the USA, an online project was launched with its participants taking photos of some American weather stations. The idea behind it was to draw attention to stations thought to be badly-sited for the purpose of recording temperature. The logic behind this, they thought, was that if temperature records from a number of U.S. sites could be discredited, then global warming could be declared a hoax. Never mind that the U.S. is a relatively small portion of the Earth;s surface. And what about all the other indicators pointing firmly at warming? Huge reductions in sea ice, poleward migrations of many species, retreating glaciers, rising seas - that sort of thing. None of these things apparently mattered if part of the picture could be shown to be flawed.
But they forgot one thing. Professional climate scientists already knew a great deal about things that can cause outliers in temperature datasets. One example will suffice. When compiling temperature records, NASA's Goddard Institute for Space Studies goes to great pains to remove any possible influence from things like the urban heat island effect. That effect describes the fact that densely built-up parts of cities are likely to be a bit warmer due to all of that human activity.
How they do this is to take the urban temperature trends and compare them to the rural trends of the surrounding countryside. They then adjust the urban trend so it matches the rural trend – thereby removing that urban effect. This is not 'tampering' with data: it's a tried and tested method of removing local outliers from regional trends to get more realistic results.
As this methodology was being developed, some findings were surprising at first glance. Often, excess urban warming was small in amount. Even more surprisingly, a significant number of urban trends were cooler relative to their country surroundings. But that's because weather stations are often sited in relatively cool areas within a city, such as parks.
Finally, there have been independent analyses of global temperature datasets that had very similar results to NASA. 'Berkeley Earth Surface Temperatures' study (BEST) is a well-known example and was carried out at the University of California, starting in 2010. The physicist who initiated that study was formerly a climate change skeptic. Not so much now!
Please use this form to provide feedback about this new "At a glance" section, which was updated on May 27, 2023 to improve its readability. Read a more technical version below or dig deeper via the tabs above!
Further details
Temperature data are essential for predicting the weather and recording climate trends. So organisations like the U.S. National Weather Service, and indeed every national weather service around the world, require temperatures to be measured as accurately as possible. To understand climate change we also need to be sure we can trust historical measurements.
Surface temperature measurements are collected from more than 30,000 stations around the world (Rennie et al. 2014). About 7000 of these have long, consistent monthly records. As technology gets better, stations are updated with newer equipment. When equipment is updated or stations are moved, the new data is compared to the old record to be sure measurements are consistent over time.
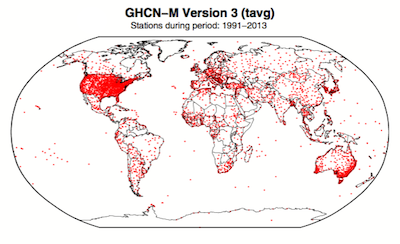
Figure 1. Station locations with at least 1 month of data in the monthly Global Historical Climatology Network (GHCN-M). This set of 7280 stations are used in the global land surface databank. (Rennie et al. 2014)
In 2009 allegations were made in the blogosphere that weather stations placed in what some thought to be 'poor' locations could make the temperature record unreliable (and therefore, in certain minds, global warming would be shown to be a flawed concept). Scientists at the National Climatic Data Center took those allegations very seriously. They undertook a careful study of the possible problem and published the results in 2010. The paper, "On the reliability of the U.S. surface temperature record" (Menne et al. 2010), had an interesting conclusion. The temperatures from stations that the self-appointed critics claimed were "poorly sited" actually showed slightly cooler maximum daily temperatures compared to the average.
Around the same time, a physicist who was originally hostile to the concept of anthropogenic global warming, Dr. Richard Muller, decided to do his own temperature analysis. This proposal was loudly cheered in certain sections of the blogosphere where it was assumed the work would, wait for it, disprove global warming.
To undertake the work, Muller organized a group called Berkeley Earth to do an independent study (Berkeley Earth Surface Temperature study or BEST) of the temperature record. They specifically wanted to answer the question, “is the temperature rise on land improperly affected by the four key biases (station quality, homogenization, urban heat island, and station selection)?" The BEST project had the goal of merging all of the world’s temperature data sets into a common data set. It was a huge challenge.
Their eventual conclusions, after much hard analytical toil, were as follows:
1) The accuracy of the land surface temperature record was confirmed;
2) The BEST study used more data than previous studies but came to essentially the same conclusion;
3) The influence of the urban stations on the global record is very small and, if present at all, is biased on the cool side.
Muller commented: “I was not expecting this, but as a scientist, I feel it is my duty to let the evidence change my mind.” On that, certain parts of the blogosphere went into a state of meltdown. The lesson to be learned from such goings on is, “be careful what you wish for”. Presuming that improving temperature records will remove or significantly lower the global warming signal is not the wisest of things to do.
The BEST conclusions about the urban heat effect were nicely explained by our late colleague, Andy Skuce, in a post here at Skeptical Science in 2011. Figure 2 shows BEST plotted against several other major global temperature datasets. There may be some disagreement between individual datasets, especially towards the start of the record in the 19th Century, but the trends are all unequivocally the same.
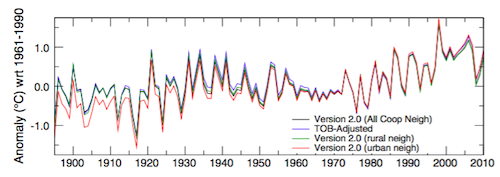
Figure 2. Comparison of spatially gridded minimum temperatures for U.S. Historical Climatology Network (USHCN) data adjusted for time-of-day (TOB) only, and selected for rural or urban neighborhoods after homogenization to remove biases. (Hausfather et al. 2013)
Finally, temperatures measured on land are only one part of understanding the climate. We track many indicators of climate change to get the big picture. All indicators point to the same conclusion: the global temperature is increasing.
See also
Understanding adjustments to temperature data, Zeke Hausfather
Explainer: How data adjustments affect global temperature records, Zeke Hausfather
Time-of-observation Bias, John Hartz
Check original data
All the Berkeley Earth data and analyses are available online at http://berkeleyearth.org/data/.
Plot your own temperature trends with Kevin's calculator.
Or plot the differences with rural, urban, or selected regions with another calculator by Kevin.
NASA GISS Surface Temperature Analysis (GISSTEMP) describes how NASA handles the urban heat effect and links to current data.
NOAA Global Historical Climate Network (GHCN) Daily. GHCN-Daily contains records from over 100,000 stations in 180 countries and territories.
Last updated on 27 May 2023 by John Mason. View Archives


Pink @ 375 , the guy called Tony Heller also calls himself Steve Goddard.
He is well-known for his "economy with the truth" - indeed, he is notorious for his misleading presentations. Pink, you should always look very skeptically and carefully at anything he presents (under either name).
Here, if we generously assume he has not presented false or distorted information, then we should next look to see :-
(a) if he used data which is out of date (outdated because the temperatures were not corrected for systematic errors in themselves, or in relation to worldwide standardising methods).
(b) if he has cherry-picked data which he thinks is good "denier" propaganda - while carefully avoiding presenting the vast amount of data which points in the opposite direction.
(c) if he has used only continental USA data and not worldwide data. The worldwide records show strong warming, and continental USA records being only 2% of global area, are therefore rather unimportant in comparison.
(d) if he has not been contradicting himself by also (elsewhere) claiming the denier meme that CONUS temperatures are showing higher over the past half-century but only because of the Urban Heat Island Effect. ( Pink, as a well-informed guy, you will of course be aware that "UHI Effect" has been completely debunked as a cause of apparent rising temperature records ). You have to laugh when you see deniers trying to play for both sides at the same time !
Another interesting point is that there certainly were some unusually hot summer days in central continental USA in the 1930's. It is uncertain if they were the entire cause of the Oklahoma-type droughts - or whether they were (in part) a consequence of desertifying effect from extensive poor management of those agricultural areas.
A further point, Pink, is to find comparable graphs of night-time low temperatures for summer , and also find graphs of day/night winter temperatures. You might find those to be very interesting, in comparison ! Has Mr Heller/Goddard supplied those, too ?
A final matter, Pink, is the important common sense test you yourself can apply to Mr Heller/Goddard's graphs - graphs which on first glance seem to indicate a rapid trend toward a New Ice Age. Look around you : warming changes are already happening within CONUS, and even more strongly in Alaska - and most of the "non-CONUS" world is recording higher temperatures and new records in heat waves. Sea levels are rising faster and faster; huge amounts of glacier and arctic ice are disappearing. The ocean is warming ( and acidifying from excess CO2 ).
Mr Heller/Goddard is clearly very wrong in what he is implying.
James Hansen has recently suggested using an early-industrial baseline of 1880-1920 (rather than 1951-1980) to plot GISS temperature anomolies in "a better graph" (www.columbia.edu/~mhs119/Temperature/ and http://csas.ei.columbia.edu/2016/09/26/a-better-graph/).
To find how to convert from 1951-1980 baseline to 1880-1920, I calculated the mean anomoly for all 41 years of GISS for 1880-1920 to be -0.276 oC (and, reassuringly, 0 oC for 1951-1980) using the annual temperatures at http://data.giss.nasa.gov/gistemp/graphs_v3/Fig.A2.txt
Therefore, to calculate the change in temperature relative to 1880-1920 for GISS, do you add 0.28 oC to the temperatures at nasa.gov? For 2015, that gives 0.86 (from nasa.gov) + 0.28 = 1.14 oC which approximates the value for 2015 in the graph at columbia.edu.
pink @375:
1) First and most obviously, the data is for the contiguous USA alone, and is not indicative of global temperatures.
2) The 1930s were noted for some years with very large areas showing some of the hotest temperatures on record, along with months in the same years showing large extents of very cold temperatures. That shows up in a spike in maximum temperature records, and in a spike in minimum temperature records; but the end of the 20th century, both minimum and maximum temperatures have increased. That results in a stronger increase in the mean temperature than occured in the 1930s. Heller carefully selects data that obscures that fact.
In the post by Heller I found which discusses these charts, he actually compares directly the NOAA graph of hot daily highs, which he purports to reproduce. That graph, however, also shows hot daily lows, which obviously climb much more at the end of the century than in the 1930s; again resulting in a greater increase in mean temperatures at the end of the century.
3) Heller graphs a simple count of the number of USHCN stations, but compares it to a graph of the percentage of the CONUS surface area affected by hot temperatures. Given that USHCN stations are very unevenly scattered across the CONUS surface, the two would not have the same shape unless exactly the same regions experienced heat waves in the 1930s as at the end of the century. The map of areas of the US that have experienced more (red) or less (blue) high temperatures since 1948 shows clearly a decrease across the midwest and most eastern regions (which have a very high number of stations) whereas the increase has mostly been in the west (with a very few number of stations):
The 1930s heatwaves, in contrast, were centered on the midwest (with a high number of stations):
Not using percentage of land area rather than numbers of stations in making the comparison shows either an absolutely abysmal level of incompetence, or a very deliberate fraud.
4) Heller uses an asolute temperature criterion, whereas NOAA uses a criterion depending on the percentage of the time a station exceeds a particular temperature. That is because what counts as a heatwave in Maine might by considered a cool spell in Miami. Thus the annual mean temperature in 1936 for Florida is "Near Normal", despite being 12oF warmer than the "record warmest" temperature for Montana. Again, this change in method will distort the comparison unless the geographical pattern of temperature variation is identical in different years (as it clearly is not).
5) Heller probably uses unadjusted temperatures, despite there having being a clear downward bias in the raw data due to changes in instruments used, in times of observation, station moves, etc.
OK thank you for the extensive reply. Basically what your saying is that he uses the unadjusted temps and the noaa has adjusted historical temperatures for "systemic errors" and other things. But I would be suspicious that these 'hot daily lows' you mentioned are the result of black asphalt, concrete etc. at night time. I have personally felt this effect, riding a motorcycle in a built-up tourest area(small town) in a hot climate I went back to my bungalow at about sometime after 2am. driving down a narrow road surrounded by vegitation, I'm wearing only T-shirt & suddenly it gets very cold, like i have to slow down because suddenly i'm freezing. I'm skeptical that these adjustments can ever be accurate when we're only talking about a degree or so since the 1800's.
The only solution seems to be to use only very consistent climate network instrumentation in area's that are far from any human activity for a long time.
What you said about this only being the USA. What skeptics are saying about that is most countries have not been in the business of measuring climate other than the USA. Czarist Russia did not see measureing 'climate change' as a priority, neither was the German Kaiser. Lawerence of Arabia and King Faisal did not battle the Ottoman empire and take temperature readings.
[PS] This is dangerously close to sloganeering. If you want to quote "pseudo-skeptics", make it a direct quote and cite. These sentences are unsubstantiated nationalist rhetoric and the last sentence absurb. I doubt Davy Crockett didnt battle with the Mexicans and took temperature readings either. The global tide gauge record and glacial retreat are consilient with the global instrument record and would strongly contradict a cooling since 1930s. Cherry picking of evidence in denier tactic. I am quite sure that the glories of Chinese science would be lauded if there was a Chinese record that suggested some cooling.
1 other thing, his graphs are not showing that "we're going into an Ice Age" They just suggests that the 30's were the peak of the current warm period, which will naturally end as the Earth goes into another post Roman warm era, post medeival warm era, cold era. I take it you guys think that warm periods are now permanent and humans have to 'cap' the warm era so it doesn't get too warm, and they can do this by not burning stuff. Is that your outlook?
pink @380.
The warm 1930s experienced by parts of the US does not constitute part of "another post Roman warm era, post medeival warm era." It was solely a regional warming. If you use this GISTEMP mapping tool, you will see that for the year 1934 it is only a tiny part of the globe, indeed only a tiny part of the USA that plots a temperature anomaly +2ºC (and the global average is -0.14ºC). But for last year 2015, the map shows the +2ºC area is much much greater (and the global average is +0.85ºC).
In the grand scheme of things, climate is a global thing. As such, it would be an utter fool who insisted that the global view should not be "your outlook."
I didn't say it was a 'warm era', what I meant was that it was just the peak of THIS warm period. The Roman warm period, followed by the 'dark' cold period, followed by the medeival warm period, followed by the 'LIA' cold period, followed by the current warm period. The 1930's was probably the peak of several hundred years of warming.
[PS] This is more sloganeering. Please back your assertion "the 1930's was probably the peak of several hundred years of warming" with some shred of evidence. As other commentators have shown, there is massive evidence against this.
pink @382.
I don't know of evidence for a natural warm era of any significance for which "the 1930's was probably the peak of several hundred years of warming."
The IPCC graphic (AR5 Fig BoxTS5.1) below shows a NH temperature reconstruction. While this reconstruction does show a period of NH warming over the last 300-400 years, the top panel of the graphic shows the majot agent of forcing to be the "well mixed GHGs." So it is mostly not natural warming.
And do be mindful of the implications of your proposal. You suggestion is that man-made climate change is responsible not just for the +0.99ºC temperature rise 1934-2015, but also some additional warming to reverse the onset of your proposed "cold period." How much additional warming would depend on the strength of your proposed "cold period," the significance of which I couldn't begin to assess as your proposal in my view an entirely fanciful.
Pink @379-382 , you will have to explain your ideas more clearly.
You seem to be stating that the world surface temperature has been swinging back and forth like a pendulum, between hotter and colder every few centuries.
But that's not really so. If you have a look at scientific temperature assessments of past times, you will see that the average worldwide temperature has been slowly falling during the last 6,000 years. There have been localised (regional) variations, particularly in parts of the Northern Hemisphere - but these have been very minor variations indeed (though often given very grand names, like "Roman This" or "Medieval That" or "Little Ice Age" etcetera, which make them sound far bigger and more important than they actually were). But overall there's been a slow cooling until now.
The major worldwide swings in heating/cooling have occurred on a scale of thousands and tens of thousands of years (including the "Ice Ages" = more correctly called the "Glacial Ages"). Those big swings have occurred for a reason - predominantly from subtle changes in Earth's tilt and orbit.
But nowadays we are in a completely new ball game : temperature rise very fast in the past 100+ years and being caused by a new factor - the new factor being a large rise in greenhouse gas effect from "fossil fuel" CO2. This really is very new and different, compared with recent millions of years.
Very strangely, Mr Heller/Goddard seems to be trying to misinform you and give you the impression that the world has been cooling since the 1930's. He couldn't be more wrong - and you can see the evidence that he's wrong, by looking yourself at all the melting ice and rising ocean level and all the other stuff that's going on to show that rapid global warming is occurring. Exactly as all the climate scientists are saying.
You would have to ask yourself why Mr Heller/Goddard is going against common sense!!
pink @379 thanks Eclectic and I for our extensive responses, and then proceeds to ignore nearly all of those reponses. In particular, he ignores the very clear evidence that Heller compares "apples to oranges", or more specifically, he compares a simple percentage of station data to a percentage of surface area covered. It is known that the meteorological stations in the US are not evenly distributed across the land mass, and that the regions of the 1930s warming are not those of the more recent warming in the CONUS. I repeat, "Not using percentage of land area rather than numbers of stations in making the comparison shows either an absolutely abysmal level of incompetence, or a very deliberate fraud." pink evidently wants to be party to either the incompetence or fraud, in his deliberate ignoring of this factor, even when it is brought to his/her attention.
He/she also persists without warrant in treating a percentage of stations (not area adjusted) exceeding an absolute temperature limit as a better proxy for Global Mean Surface Temperature than the actual GMST; and of treating the 1.58% of the Earth's surface represented by the CONUS as a better proxy of GMST than the mean surface temperature of the globe. He/she defends that last with some jingoistic nonsense about where did, and did not have significant temperature records in the 1930s. In fact, where did or did not have significant surface temperature records is a matter of record, and is well illustrated by a video from the Berkeley Earth Surface Temperature project:
As can easily be seen, every continent except Antarctica has significant coverage by 1880 (the reason GISS and NOAA start there temperature records at that time). Sea Surface Temperature records are also extensive by 1880, such that HadCRUT4 shows 30-37% global coverage in 1880, rising to 61-66% by 1930 and 75-81% by 1960. So, at its best, pinks argument is that we should use only the CONUS temperature record (not weighted by surface area) as the gold standard because the 30-37% coverage by HadCRUT4 in 1880 doesn't cover sufficient of the globe to be relevant. I am unconvinced of the coherence of his/her case.
pink is also certain that the adjustments in temperature records to account for changes in equipment, observation times and station moves cannot be rellied on, but will be (I am certain) equally unwilling to accept the unadjusted GMST record (red line):
Tom @385,
Your post was well documented as usual, but I think you need to be more specific about your last graph to help Pink understand what it shows.
Your graph clearly shows that the adjustments to the raw temeprature record strongly lowers the amount of observed warming in the record since 1900 (it lowers it if you go back to the beginning of the record also). Thus the claim by Pink that adjustments have been made that raise the amount of observed warming is clearly contradicted by the data.
Claims by deniers like Goddard that the record has been altered to raise the amount of warming are deliberate lies. Goddard has seen your graph and knows that the data adjustments have lowered the amount of warming.
[PS] From comments policy: "No accusations of deception. Any accusations of deception, fraud, dishonesty or corruption will be deleted. This applies to both sides. You may critique a person's methods but not their motives."
michael sweet @386, while I agree with your emphasized point, I think the more germane point is that in the unadjusted data (red line), the 1930s are barely above late 19th century values. Indeed, given what we know about 19th century GMST from HadCRUT4, the unadjusted 1930s values more or less match the 1850s values. They are well below the 1940s/early 1980s values and even further behind late 20th, early 21st century values. These facts all directly contradict his attempt to portray the 1930s as "...probably the peak of several hundred years of warming".
He's not going against common sense he just created a chart using unadjusted data. NY Times articles like this from 1989:
http://www.nytimes.com/1989/01/26/us/us-data-since-1895-fail-to-show-warming-trend.html?src=pm
[ U.S. Data Since 1895 Fail To Show Warming Trend
After examining climate data extending back nearly 100 years, a team of Government scientists has concluded that there has been no significant change in average temperatures or rainfall in the United States over that entire period. ]
and then going to the current time where the NOAA declares every year 'the hottest ever' even though warming is flat on satelite data, and some area's even show recent cooling cooling makes skepticism.
Also I don't know if you guys are aware of this, look at the sunspot chart:
http://facweb.bhc.edu/academics/science/harwoodr/geog101/study/images/sunspots.gif
ALL the big volcano's since the 1600's have occured during solar maximums or solar minimums, with the ones that erupted during solar minimums bigger that the ones during maximums. pinatabo, mtst helens, krakatoa, 1991,1980, 1883 during maximums. Tambora 1815, Laki 1783 dalton and maunder mins. Tambora and Laki were so powerful that they created freezing summers.
So the warming probably isn't 'that' abnormal, it isn't 'that' much-considering the weather and seasons are currently stable, crop production the past few decades has been stellar and food is cheap. There hasn't been a big volcano for a while- a few years from now they probably start going off due to solar minimums.. and the warming is erased. There's no reason to think the greenhouse gas effect is so powerful that it can make warming continue despite such powerful forces.
Pink, you are not making much sense.
How can sunspots and cheap food have anything to do with volcanoes?? Pink, the friendly Mr Heller/Goddard is feeding you misinformation.
Ask yourself WHY you would believe him , rather than all the world's climate scientists - who tell a very different story, and who have all the evidence to prove they are right.
And use your common sense, Pink. The sea level is rising because thousands of Gigatons of ice are melting - melting because the world is getting warmer, not colder (and not "paused", either! ). Please just use your common sense, Pink.
Also - follow the money. WHY would you choose to believe Mr Heller/Goddard ( paid by the oil industry ) rather than believe the thousands and millions of scientists worldwide, who are paid from all sorts of separate sources - paid by thousands of independent universities; by more than 100 independent sovereign national governments; by dozens of meteorological organisations; by dozens of research organisations . . . and in addition there are the vast number of scientists, now retired and independently paid by their own superannuation moneys, who support what the "working scientists" have all been saying too.
As for the temperatures being recorded by the satellites - Pink, you are also wrong about that. They show a picture of rising temperatures (not flat or falling). They do not show genuine surface temperature , but a temperature which is predominantly of the upper atmosphere - mostly from thousands of feet above ground level. Quite misleading, to rely on that as a substitute for real genuine ground-level / sea-level temperatures. Mr Heller/Goddard is conning you there! Yet even then, when you look at recent satellite data, the trend is rising, and not flat or falling. Pink, you have let yourself be led up the garden path, into Mr Heller/Goddard's fairyland !!
Also, Pink, why do you quote from a New York Times reporter in January 1989 - that is very nearly 30 years ago. A lot has happened since then. Pink, how do YOU justify ignoring all the events since then? Ignoring a spectacular rise in the world's surface temperature; ignoring a 60% loss of arctic sea ice volume, and a great reduction of glacier volumes; ignoring a big rise in heat content of the ocean; as well as ignoring many other changes in the world (too many to list here).
You might just as well pretend you are living 20,000 years ago.
Pink, you are not making much sense.
Eclectic @389.
I think you will find the comment of pink @388 makes perfect sense.
In support of the position of Heller/Goddard, pink @388 kicks-off with that 1989 NYT article. As you say, it is now old. Indeed, it describes research using data that is even older. But note that even back then, the researchers were having to insist to the NYT that their findings are not in any way supportive of climate deniers.
But if you are in denial over AGW, the words of Dr Kirby Hanson are an irrelevance. The title of the article is "U.S. Data Since 1895 Fail To Show Warming Trend" and that is all a dener needs to read.
Of course 1989 isn't now. So it is only reasonable for pink @388 to supply more recent evidence to support his position that Heller/Goddard is "not going against common sense." Satellite data is always a good prop for deniers. Or so they think. If they actually looked they would see that even the much criticised UAH & RSS TLT data is showing warming, unless you deny it at which point it becomes flat. And not all satellite data does what deniers want to see. Consider RSS TTTv4.0. It shows (usually 2 clicks to 'download your attachment') significant warming on a par with surface measurements. But global temperatures can still be "flat on satelite data" if you deny the existence of satellite data that isn't "flat."
Of course, pink @388 does not entirely depend on simple denial. Even deniers needs a 'happy place' to provide that 'feel-good factor'. After all, deniers don't all suffer from psychopathy. So we are treated to a blunderful new theory from pink @388. Big volcanoes all occur during solar maximums & minimums Ooops. That isn't true. So it is big volcanoes that make a mess of the climate all occur during solar maximums or minimums.
But doesn't the eruption of El Chichón rate as one of those "big volcanoes that make a mess of the climate?" And wasn't El Chichón in 1982? And wasn't there a solar maximum in 1980? And a solar minimum in 1986?
So the 'happy place' described by denier pink @388 is, as with most such 'happy places' falls at the first hurdle. It is entirely dellusional. Note how this 'happy place' is also entirely incompatable with the 'happy place' described by pink @382. (Whether the Heller/Goddard position stands & falls with the loss of pink's 'happy place' is not clear: I think it falls independently.)
I'm not geting everything i write from tony heller, he doesn't say anything on his blog about volcanoes, etc. most of what i'm writeing is just my own opinion.
[PS] There is no interest on this site of opinion that is not backed with evidence.
and the point of using old articles and charts is to demonstrate that over time the 'warming' keeps getting adjusted up in latter years and down in earlier years.
This just came out, that animated gif is very disturbing.. it shows that even the satelite graphss are being 'adjusted'
https://wattsupwiththat.com/2016/10/10/remote-sensing-systems-apparently-slips-in-a-stealth-adjustment-to-warm-global-temperature-data/
[PS] This again is very close to an accusation of fraud. If you find it very disturbing, then you need to show that the adjustment was wrong or unnecessary. Look at why the adjustment was made and whether it is justified rather than going into conspiracy theory mode.
It also looks like you have been taken in by denier nonsense again. See here for detail.
pink @388 again evades discussion of points that conclusively refute his claims on this site. Instead he launches of with a whole new lot of out of context factoids and a half baked theory of his own. I will continue once more responding to pink's game of "look, squirrel", but do request that the moderators constrain pink to actually responding to the points raised against his claims in this and prior posts, either by raising cogent and germane evidence, or conceeding the point.
1) pink's first new "argument" is to misrepresent a New York Times article of January, 1989. The Times article does indeed say that there were no significant trend temperature over the CONUS from 1895-1987. "No significant trend", is of course, not the same as no trend, or zero trend. It means only that whatever trend exists was not statistically significant. Indeed, the modern NOAA data over the same period shows an Ordinary Least Squares trend of 0.033 +/- 0.0324 C/decade (two standard deviation range). Given that the error margins based on standard deviations do not account for autocorrelation, if autocorrelation was included the trend would not be statistically significant. So, not only did NOAA scientists in 1989 think the 1895-1987 CONUS temperature trend was not significant, their modern counterparts would agree. In contrast, the 1895-2015 OLS trend is 0.076 +/- 0.0234 C/decade. That is clearly statistically significant, and would be so even allowing for autocorrelation. So, pink's outrageiously dated evidence is clearly irrelevant given that the full record disproves the apparent point.
Of course, the article also included caveattes that should have prevented the misuse of it by pink, as already quoted by MA Rodger @390. Indeed, it goes on from the quoted section to mention that the area of the CONUS is too small to be representative of global trends, and to mention that "... average global temperatures have risen by nearly 1 degree Fahrenheit in this century and that the average temperatures in the 1980's are the highest on record". Failing to mention the caveats on the CONUS data, and the global data actually reported in the article is definitely out of context quotation, something which in academic circles is tantamount to fraud.
pink then procedes to contrast the articles results with the modern pronouncements by NOAA (in 2014, 2015, and 2016) that each year has been successively, the hotest on record. He fails to note that the person making those pronouncements was Dr Thomas Karl, one of the authors of the research which he indirectly cites. Given the credence he gives to the research of Dr Karl in 1989, his refusal to accept Dr Karl's research in 2016 is a clear case of special pleading.
2) pink then mentions the satellited data, without mentioning that all TLT satellite series show a statistically significant positive trend from 1978-2016. The curious thing is that there are (at least) four satellite series, of which only the two with the lowest trends are commonly cited. They all use the same data, and all come up with different answers as to what the trend was. That is unsurprising because converting satellited data to a temperature series requires more, and more controversial adjustments of the raw data, than does the analysis of the surface temperature record. Thus it is no surprise that the five official (and about six unofficial) surface temperature records, using distinct but overlapping datasets, and different methods all come up with the same trends, while the various approaches to the satellite data fail to do so. It is with good reason that Dr Carl Mears (the author of one of the satellite data sets) has said, "I consider [surface temperature datasets] to be more reliable than satellite datasets (they certainly agree with each other better than the various satellite datasets do!)." pink, not being aware of the complexities involved, merely prefers that data which appears to best support his/her previously arrived at position.
3) pink then invokes Sunspots and Volcanoes (Oh my!). Let me first state that I believe MA Rodger to have misinterpreted the theory. By solar minimums, pink means such extended periods of low solar activity as the Maunder Minimum (c1645-1715), the Dalton Minimum (c1790-1830), and the Modern Maximum (c1950-2000):
Constraining ourselves to volcanic erruptions with a VEI of 6 or above, from 1600 onwards we have:
(Underlined volcanoes occur durring a named minimum or maximum. Source)
In all, 5 out of 10 eruptions occcur durring a named minimum or maximum. In all, named minimums and maximums occupy 39% of the time from 1600-2015, and durring those named periods, 50% of VEI 6 plus eruptions during that period occurred. In short, there might be a slight statistical link between the volcanic eruptions and the data, but you could not prove it on this data. You certainly could not prove it with pink's data, which counts Laki and Krakatoa as being during named minimums/maximums despite the fact that they clearly are not.
I do not discount a solar minimum/maximum effecting the rate of volcanos. Any factor significantly changing the quantity of ice in glaciers and ice sheets, could by the resulting change in the Earth's rate of rotation, cause stresses in the Earth's crust making eruptions more likely. Of course, that applies to any factor significantly effecting climate, including the strongest recent impact, AGW. But this, of course, is just a possibility - not a proven theory. Even if true, the impact is minor; and as the strong warming through the 1990s, despite the Pinatubo erruption shows; any consequent volcanic effect is likely to cause only temporary slowdowns in the onset of global warming.
Despite this slight possible connection, pink's treatment of the situation is, at best, very bad science fiction.
pink @391.
I think we can tell. Should I be concerned (as is Tom Curtis @393) that you seem to go all silent on assertions like "The 1930's was probably the peak of several hundred years of warming." or "There hasn't been a big volcano for a while- a few years from now they probably start going off due to solar minimums.. and the warming is erased."? Or should we forget about them, as you potentially have?
pink @392.
If I missed something relevant in that old NYT item, do say. If it did "demonstrate that over time the 'warming' keeps getting adjusted up in latter years and down in earlier years," then I'm afraid I didn't spot it.
I note you consider an adjustment to the RSS TLT V3.3 ocean temperatures (1997-2016) to be "very disturbing"? I would therefore strongly suggest you sit down and take a deep breath when RSS TLT v4.0 is eventually published. The effect of this adjustment you refer to is a massive +0.0023ºC/decade, well within the statistical confidence of the result. The conversion to v4.0 will likely have twenty-times that impact, or more. So be warned!!
Tom Curtis @393.
Thank you for spotting the intended meaning of "solar maximums or solar minimums" @388. If it were more than "Oh my!" I would consider the implications of such a correction of interpretation. But "Oh my!" is about the sum of it.
pink, from an earlier comment of yours
" U.S. Data Since 1895 Fail To Show Warming Trend" &
"and then going to the current time where the NOAA declares every year 'the hottest ever"


NOAA's declarations are for the entire globe. Wheras the US is only 1.5% of the Earths surface. Don't you see the logical fallacy in in using this contrast. Contrasting a tiny paet of the world with the whole world is rather pointless.
Look at these two maps, of temperature anomalies for 2 periods - 1930-35 & 2010-15. Both have the same baseline period of 1951-1980.
The first shows the US as somewhat warmer than the 1951-80 global average, but not the planet as a whole. In contrast, the planet as a whole is significantly warmer than 51-80 although the US is actually showing less warming than elsewhere.
See why drawing conclusions from a small region is mesleading?
Simple suggestion. Whenever someone present data for only one region to you and then makes argumants about the entire globe, explicitly or implied, you should distruct them. Whether from ignorance, stupidity or deceit they aren't a realiable source.
tx for taking the time to write extensive answers.. but the sunspot chart i'm using:
http://facweb.bhc.edu/academics/science/harwoodr/geog101/study/images/sunspots.gif
shows krakatoa 1883 at a maximum as well
but also note that Tambora was a VEI 7s (dalton min) and Laki (maunder) was a 6 but dragged on for 8 months so it was the same as a 7 as far as cooling is concerned. There hasn't been anything like that for a while which probably raises the chances of a BIG one sometime in the next few decades, possible as soon as 2020's .. or it could be something like two 6's in a row.
also i noticed in bold type when i was looking up 'tony heller paid by oil industry' , he denies that and I would ask for evidence that he was paid a significant amount by an oil company(s), what company(s) is this, what oil executive(s) authorized it, etc. Such accusations bring blowback to orgs like SS that they are just here topromote the funneling of government money to certain research and technology ventures or to lobby for regulations that benefit a certain economic sector.
[JH] The striked-through paragraph is sloganeering which is prohibited by the SkS Comments Policy.
Please note that posting comments here at SkS is a privilege, not a right. This privilege can be rescinded if the posting individual treats adherence to the Comments Policy as optional, rather than the mandatory condition of participating in this online forum.
Please take the time to review the policy and ensure future comments are in full compliance with it. Thanks for your understanding and compliance in this matter.
pink @397, using data from the site which provided the data for your chart, and calculating an 11 year running average of montly sunspot numbers from 1750-2016, 1883 is at about the 20th percentile, and about 70% of the mean sunspot number. Neither of these is consistent with 1883 being a grand solar maximum.
With respect to Laki, I repeat, it occurred prior to the Dalton Minimum. Indeed, 1783 is in the 98th percentile of sunspot numbers, with 1.56 times the mean number of sunspots. Arguably that makes it grand solar maximum, but solar astronomers do not so describe it, presumably due to the brevity of the peak.
Your persistent ascription of voclanic eruptions to minimums when they are more likely to lie in a maximum, and to maximums (ie Laki), when they are quite ordinary years (ie, Krakatoa) shows your theory is not emperically derived. Further, because of the low forcing associated with fluctuations in the solar cycle, only persistent large fluctuations (positive or negative) can plausibly result in increased volcanic activity. Your wanting to ascribe Krakatoa to a maximum suggests you care nothing for that, giving your theory all the hallmarks for a deux ex machina for a "anything but CO2" paradigm. That is, your only evidence for your theory is that you want to believe it to be so to avoid believing that increasing CO2 is likely to have a significant impact on globat temperatures.
[PS] This is offtopic. No further responses to Pink here on sunspots and volcanoes. Pink, if want to discuss "its not us" myths, then perhaps here (sunspots) or here (volcanoes)
And dont even think of making another assertion without backing your claim ( eg a link to a specific claim or evidence to support your argument). I'll delete your entire comment.
I love how you guys blow off human error in discussing the accuracy of historical global temperature records. Wars, revolutions, empty government coffers all existed for centuries prior to weather satellites giving us accurate temps. This presumes that these current results are not being doctored. What caused the warm up after the ice age?
[PS]
Thank you for taking the time to share with us. Skeptical Science is a user forum wherein the science of climate change can be discussed from the standpoint of the science itself. Ideology and politics get checked at the keyboard.
Please take the time to review the Comments Policy and ensure future comments are in full compliance with it. Thanks for your understanding and compliance in this matter. Note the prohibition of accusations of fraud and the requirement to be on topic. If you dont like how records are adjusted for station shift, TOB bias, instument change etc, then state where the methodology is flawed and back your argument with data/references.
In particular please take the time to investigate what science really does say rather than repeating long-debunked myths. The Search function at the top is great place to start. Questions are welcome (when on topic) so long as you want to hear the answer.
Bulthompson @399 :-
The warm up since the ice age [the most recent Glacial Age] was caused about 90% by CO2 and more minor Greenhouse Gasses (and the initial 10% by temporary Earth orbit changes).
Funnily enough, Bulthompson, you can learn some of these very basic things by reading the very first of the "Most Used Climate Myths". Yes, that's right : Climate Myth Number 1 , which you will find on the Home Page, top left corner.
You will also benefit yourself by reading Myth Number 12 . . . as well as many of the others.
You seem to be suffering from a (misplaced) belief in Alternative Facts.
Also please note that the "weather satellites" [as you have misnamed them] don't really measure world surface at all, but rather measure air temperature in the upper atmosphere (mid and upper troposphere, predominantly) miles above where humans, plants and animals do live. Bulthompson, you will be falling into a trap for fools, if you take the "satellite temperatures" as a replacement for plain straightforward thermometers at ground level & ocean level.
There seems to be a lot of science that you don't understand. Best for you, would be a long course of reading and thinking, as you work your way down the Climate Myths — starting of course at the Number One .
That will help you avoid making embarrassing assertions based on false ideas.