


 Arguments


Are surface temperature records reliable?
What the science says...
| Select a level... |
 Basic
Basic
|
 Intermediate
|
 Advanced
| ||||
|
The warming trend is the same in rural and urban areas, measured by thermometers and satellites, and by natural thermometers. |
|||||||
Climate Myth...
Temp record is unreliable
"We found [U.S. weather] stations located next to the exhaust fans of air conditioning units, surrounded by asphalt parking lots and roads, on blistering-hot rooftops, and near sidewalks and buildings that absorb and radiate heat. We found 68 stations located at wastewater treatment plants, where the process of waste digestion causes temperatures to be higher than in surrounding areas.
In fact, we found that 89 percent of the stations – nearly 9 of every 10 – fail to meet the National Weather Service’s own siting requirements that stations must be 30 meters (about 100 feet) or more away from an artificial heating or radiating/reflecting heat source." (Watts 2009)
At a glance
It's important to understand one thing above all: the vast majority of climate change denialism does not occur in the world of science, but on the internet. Specifically in the blog-world: anyone can blog or have a social media account and say whatever they want to say. And they do. We all saw plenty of that during the Covid-19 pandemic, seemingly offering an open invitation to step up and proclaim, "I know better than all those scientists!"
A few years ago in the USA, an online project was launched with its participants taking photos of some American weather stations. The idea behind it was to draw attention to stations thought to be badly-sited for the purpose of recording temperature. The logic behind this, they thought, was that if temperature records from a number of U.S. sites could be discredited, then global warming could be declared a hoax. Never mind that the U.S. is a relatively small portion of the Earth;s surface. And what about all the other indicators pointing firmly at warming? Huge reductions in sea ice, poleward migrations of many species, retreating glaciers, rising seas - that sort of thing. None of these things apparently mattered if part of the picture could be shown to be flawed.
But they forgot one thing. Professional climate scientists already knew a great deal about things that can cause outliers in temperature datasets. One example will suffice. When compiling temperature records, NASA's Goddard Institute for Space Studies goes to great pains to remove any possible influence from things like the urban heat island effect. That effect describes the fact that densely built-up parts of cities are likely to be a bit warmer due to all of that human activity.
How they do this is to take the urban temperature trends and compare them to the rural trends of the surrounding countryside. They then adjust the urban trend so it matches the rural trend – thereby removing that urban effect. This is not 'tampering' with data: it's a tried and tested method of removing local outliers from regional trends to get more realistic results.
As this methodology was being developed, some findings were surprising at first glance. Often, excess urban warming was small in amount. Even more surprisingly, a significant number of urban trends were cooler relative to their country surroundings. But that's because weather stations are often sited in relatively cool areas within a city, such as parks.
Finally, there have been independent analyses of global temperature datasets that had very similar results to NASA. 'Berkeley Earth Surface Temperatures' study (BEST) is a well-known example and was carried out at the University of California, starting in 2010. The physicist who initiated that study was formerly a climate change skeptic. Not so much now!
Please use this form to provide feedback about this new "At a glance" section, which was updated on May 27, 2023 to improve its readability. Read a more technical version below or dig deeper via the tabs above!
Further details
Temperature data are essential for predicting the weather and recording climate trends. So organisations like the U.S. National Weather Service, and indeed every national weather service around the world, require temperatures to be measured as accurately as possible. To understand climate change we also need to be sure we can trust historical measurements.
Surface temperature measurements are collected from more than 30,000 stations around the world (Rennie et al. 2014). About 7000 of these have long, consistent monthly records. As technology gets better, stations are updated with newer equipment. When equipment is updated or stations are moved, the new data is compared to the old record to be sure measurements are consistent over time.
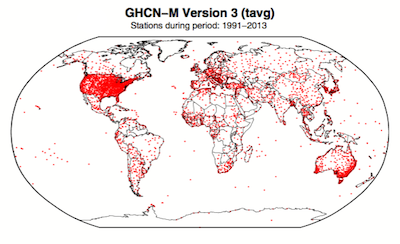
Figure 1. Station locations with at least 1 month of data in the monthly Global Historical Climatology Network (GHCN-M). This set of 7280 stations are used in the global land surface databank. (Rennie et al. 2014)
In 2009 allegations were made in the blogosphere that weather stations placed in what some thought to be 'poor' locations could make the temperature record unreliable (and therefore, in certain minds, global warming would be shown to be a flawed concept). Scientists at the National Climatic Data Center took those allegations very seriously. They undertook a careful study of the possible problem and published the results in 2010. The paper, "On the reliability of the U.S. surface temperature record" (Menne et al. 2010), had an interesting conclusion. The temperatures from stations that the self-appointed critics claimed were "poorly sited" actually showed slightly cooler maximum daily temperatures compared to the average.
Around the same time, a physicist who was originally hostile to the concept of anthropogenic global warming, Dr. Richard Muller, decided to do his own temperature analysis. This proposal was loudly cheered in certain sections of the blogosphere where it was assumed the work would, wait for it, disprove global warming.
To undertake the work, Muller organized a group called Berkeley Earth to do an independent study (Berkeley Earth Surface Temperature study or BEST) of the temperature record. They specifically wanted to answer the question, “is the temperature rise on land improperly affected by the four key biases (station quality, homogenization, urban heat island, and station selection)?" The BEST project had the goal of merging all of the world’s temperature data sets into a common data set. It was a huge challenge.
Their eventual conclusions, after much hard analytical toil, were as follows:
1) The accuracy of the land surface temperature record was confirmed;
2) The BEST study used more data than previous studies but came to essentially the same conclusion;
3) The influence of the urban stations on the global record is very small and, if present at all, is biased on the cool side.
Muller commented: “I was not expecting this, but as a scientist, I feel it is my duty to let the evidence change my mind.” On that, certain parts of the blogosphere went into a state of meltdown. The lesson to be learned from such goings on is, “be careful what you wish for”. Presuming that improving temperature records will remove or significantly lower the global warming signal is not the wisest of things to do.
The BEST conclusions about the urban heat effect were nicely explained by our late colleague, Andy Skuce, in a post here at Skeptical Science in 2011. Figure 2 shows BEST plotted against several other major global temperature datasets. There may be some disagreement between individual datasets, especially towards the start of the record in the 19th Century, but the trends are all unequivocally the same.
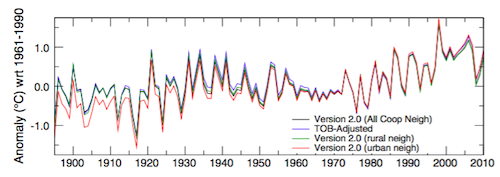
Figure 2. Comparison of spatially gridded minimum temperatures for U.S. Historical Climatology Network (USHCN) data adjusted for time-of-day (TOB) only, and selected for rural or urban neighborhoods after homogenization to remove biases. (Hausfather et al. 2013)
Finally, temperatures measured on land are only one part of understanding the climate. We track many indicators of climate change to get the big picture. All indicators point to the same conclusion: the global temperature is increasing.
See also
Understanding adjustments to temperature data, Zeke Hausfather
Explainer: How data adjustments affect global temperature records, Zeke Hausfather
Time-of-observation Bias, John Hartz
Check original data
All the Berkeley Earth data and analyses are available online at http://berkeleyearth.org/data/.
Plot your own temperature trends with Kevin's calculator.
Or plot the differences with rural, urban, or selected regions with another calculator by Kevin.
NASA GISS Surface Temperature Analysis (GISSTEMP) describes how NASA handles the urban heat effect and links to current data.
NOAA Global Historical Climate Network (GHCN) Daily. GHCN-Daily contains records from over 100,000 stations in 180 countries and territories.
Last updated on 27 May 2023 by John Mason. View Archives


Tom Curtis (#324) writes, 'As Rob P notes, there is no such thing as data that no-one disputes, particularly in an era of pseudo-skepticism. Those, however, are the basic facts the fake skeptics will need to studiously ignore, or distort.'
First of all, I find myself wondering who these dreadful people are who are apparently driven by some kind of nihilistic urge to 'studiously ignore, or distort' basic facts. Do such people even really exist? What on earth is the motivation of these 'fake sceptics'?
Second, when 'there is no such thing as data that no-one disputes,' I find myself wondering how seriously to take a scientific debate that is based on the idea that since you can't convince everyone of your 'facts' you can just insult them for not being convinced.
Third, the expression 'era of pseudo-skepticism' surprises me greatly. We actually live in an era of overwhelming conformity and adherence to doctrines promulgated in schools, universities, the mass media, and government propaganda. Outside that, there are just a few heretics whose only outlet for their opinions seems to be the comments sections of the precious few websites, most of which will probably only end up deleting them.
TYPO in #326 'a precious few' was intended not 'the precious few'
James P @326:
1) I am a veteran of creation/evolution debates, as well as climate science debates. On the way I have also debated a number of other kooks, including a self avowed geocentrist and a person who thinks global warming is caused by radar. I know from long experience that we live in an era of gullibility were any well established science can be questioned by large proportions of the population on grounds that come down to mendacious rhetoric. You want to pretend otherwise? Then the more gullible are you.
2) In my post @ 324 I gave an extensive, informative answer to your question. Your response has been to ignore that response except for a side comment that is off topic on this thread, and not relevant to your initial question. That suggests to me your question was not asked in good faith. That you describe your question as "your point" confirms that, ie, that you were angling for a rhetorical hook, not asking a question out of a genuine interest to learn the relevant facts.
@325:
By conventional wisdom, "absolute certainty" is only to be had in logic and mathematics. Emperical science must restrict itself to limiting uncertainty. I find more interesting, however, the etymology of the term "absolute certainty". Strictly that means "a certainty that has no solvent", ie, a certainty that cannot be dissolved by any fact or evidence. "Absolute certainty" is actually only the realm of the dogmatists. Your demand for "absolute certainty" from science is then a demand that science cease to be science. Rightly, friends of science resist such demand.
James P: "Given the passion generated by the subject of climate change, it is fairly obvious to the non-scientist like myself that the general atmosphere in which the discussion is unfolding is not sufficiently dispassionate to bring us anywhere near the conditions in which peer review could be carried on in an appropriate manner."
You are confused, James. The general atmosphere in which the debate is unfolding is the atmosphere of scientific journals. You're probably transferring the passion seen in the internet debate to the scientific debate (e.g. Judith in publication is not Judith on the internets). This is an error. If you stand back away from the published science and remain there, you will continue to be tempted to make the scientific debate out to be whatever you want it to be. You've just given in to that temptation by ignoring Tom's substantial response.
And James, if you have access to any absolute certainty regarding anything, please share with the world. It's the ethical thing to do. You might even win a Nobel, or several! Keep in mind that an actual absolute certainty would be instantly recognizable by everyone else.
James P wrote: "This conveniently ignores the fact that we need to have absolutely certain climate information and we need to know for what period absolute certainty exists before we can even begin to discuss climate change in a rational manner. I don't see why anyone would bother otherwise."
By this 'logic' the entire history of science and technological progress would be out the window.
Cave man learning to make fire? Why would he bother when he clearly didn't have "absolute certainty" about how fire worked? Wright brothers building an airplane? Why would they bother when they clearly didn't have "absolute certainty" about how fluid dynamics would impact the craft?
In essence you argue that we cannot start until we have finished. If we knew everything about climate science with absolute certainty there wouldn't be any need for further research or debate... we'd be done. We'd know everything. To set that (impossible) end state as a pre-requisite for starting is just ridiculous.
The real question is whether we know enough to make reasonable predictions... but since the answer is "yes", deniers are forced to seek a different, irrational, standard.
Paul Homewood from 'notallpeopleknowthat' successfully? undermines the reliability of Temperature records.
"Massive Tampering with Temperature Records in South America"
LINK
He starts off with GISS Global Temperature Anomaly:
LINK
Then proceeds to show where gaps (grey areas) in the data are totally missing using NOAA /NCDC Map:
(Strangely he doesn't provide a Link to this Map)
So he has shown that the GISS Global Temperature Map is derived from data that simply does not exist.
He then goes on to hammer home his point of temperature data being falsified by highlighting three NOAA weather stations in Paraguay. I will just do the one at Puerto Casado.
Here is GISS graph for Temperatures taken from Puerto Casado:
data.giss.nasa.gov/cgi-bin/gistemp/show_station.cgi?id=308860860000&dt=1&ds=14
All good temperatures seem to be rising as expected in Global warming Earth.
THEN he states he takes the Raw Data and without ANY manipulation of the data produces a graph from that data:
data.giss.nasa.gov/cgi-bin/gistemp/show_station.cgi?id=308860860004&dt=1&ds=1
There you go, without 'adjusting' the data it actually shows COOLING not warming.
He then goes on to present NOAA/NCDC GHCNM modelling for Peurto Casado weather station where the Quality Controlled Unadjusted Data shows COOLING and the Quality Controlled Adjusted Data shows warming.
ftp://ftp.ncdc.noaa.gov/pub/data/ghcn/v3/products/stnplots/3/30886086000.gif
He does the same for two other Paraguayan weather stations, Mariscal and San Juan.
So it is easy for Homewood to make the statement "Scientists just adjust the Temperatures to match their Global Warming agenda" Once again it is all just Scientific rubbish when you look at the 'real' data it clearly shows cooling not warming. Why do they 'adjust' the data? To ensure all the Modelling shows Global Warming not as it really is Global Cooling. For most of their so called 'modelling' they don't even have data!!!! It is just a 'best guess' scenario.
This has gone absolutely 'viral' with all Climate Denialist websites, bloggs and Newspapers quoting Paul Homewoods 'authoritative' study.
Responce from the Scientific community. So far none that I can find.
As a supporter of Global Warming / Climate Change I am hammered mercilessly and shown to be a total fraud.
[Rob P] - Yes, just the latest example of cherry picking and conspiracy ideation from climate science contrarians. SkS will have a response soon enough.
[RH] Shortened links.
MEJ - see the post about this at ATTP and note also the comments there by Victor Venema. This is just echoing junk from Booker in the Telegraph. In short, laughable nonsense from the usual sources. And just as an aside, suppose temperature record really was junk - what then the explanation for the change in the long term integrators of climate change - sealevel and glacial mass?
Hi scaddenp Booker in The Telegraph is simply quoting Homewood's article on his 'notallpeopleknowthat' website as are all the usual suspects. Skeptics don't see it as junk at all. To them Homewood is the actual truth and his graphs demonstrate to them how all the Science is just fabricated rubbish. You can sit back and laugh but the Scientific community will lose the debate. Thanks for that link I just couldn't find ANY redress on the issue. If you Google to try and get a Scientific view the denialists have that absolutely locked up page after page. Science simply doesn't get a look in.
Thanks 'Rob P' I have poured over these graphs to see where he has manipulated the data but with my limited understanding I just need a Scientific person to go through it for me and explain it. A couple of things make me suspicious No link on the NOAA/NCDC Global Map showing 'no data' areas and his raw data graph has a diferent ID code 30886086000(4) and he is showing graphed Temperature rather than Anomaly and comparing the two?
MEJ... I can already pick out a big mistake that Homewood makes in his first two figures. Top figure is relative to 1951-1980. Second one (of his creation through the GISS site) is relative to 1981-2010.
Why would he use different base periods? We have two choices. 1) Stupidity, and 2) Deceipt.
I decided to try to check which.
When you go to the data page at the GISS website where you generate these maps you get a lot of clues. First, the default base period presented in 1951-1980. You have to change it to get a different base period.
When you switch it back to the 1951-1980 base period you get this:
But even when we select his exact parameters, we still don't get the same image he presents. So, I don't know where he's getting that figure.
Oh! I see. He's also comparing a GISS image to a NOAA image.
Talk about apples and oranges all around.
MEJ @332:
1) You cannot have been shown to be a total fraud unless it has been shown that you have knowingly used false information yourself. It may (though very doubtfully) have been shown that you also are decieved, which is an entirely different matter.
2) Paul Homewood is definitely pulling a swifty when he compares with NCDC data. The reason is that the NCDC uses a 5ox5o grid, equivalent to 555 x 555 km at the equator. That is a much lower resolution than NASA GISS's 250 x 250 km grid shown at the same location as the normal 1200 km radius he shows above.
Here is the NASA 250 km grid equivalent to the graph he shows:
And here is the GISS map and NCDC map side by side, for northern South America:
Note that for the GISS 250 km grid, every gridpoint over land has at least one temperature station in its bounds. Yet clearly the GISS 250 km grid covers much more of northern South America than does the equivalent lower resolution, NCDC map. It follows that GISS uses more temperature stations in South America than does the NCDC, and that using the NCDC map entirely misrepresents the basis of the GISS data.
This may be partially just ignorance from Homewood. It is well known that NCDC uses only the GHCN for land only data, while GISS also uses the GHCN. GISS, however, uses additional stations to those found in the GHCN (something not commonly known, but which should be known by anybody commenting on global temperatures). However, given the existence of the GISS 250 km product, it should have been used regardless, if only so that readers knew that this was information GISS presented publicly, on a website, as easily accessible as the 1200 km version. Homewood creates an impression that this is something GISS does not want us to know, whereas it is something they actively publish.
2) The use of the 1200 km version is based on known properties of temperature anomaly change over distance. This information was published in peer reviewed papers, as was the method whereby GISS uses it in constructing their temperature data. If Homewood wanted to make an honest critique, he would have cited those papers and stated his objections to the reasoning therein. That he does not leaves the impression he has not even thought about the topic, let alone considered the relevant empirical data. Indeed, as a mater of scientific reasoning, as he does not discuss, that must be our presumption. So, we have from GISS cogent, evidence based reasons for their methods - and from Homewood, an argument from personal incredulity, and nothing else.
3) The reasons for, and method of adjustment of temperatures are also heavilly discusses in the scientific literature, and based on detailed examination of evidence, including direct comparison between temperature readings for different thermometer types, thermometers at different altitudes etc. Again, in response to that literature, Homewood argues by, first, ignoring it so that he readers do not know that there is an objective basis for the adjustments; and second presenting an argument from personal incredulity and nothing else.
As it happens, I have seen similar arguments presented regarding data from New Zealand and Australian stations. These arguments have been much better presented, actually relying on more than personal incredulity. On examination, however, in every case that I have examined, they have been wrong. In most cases it has been trivial to show that they are wrong.
I do not have the ready access to the relevant data in South America that I have in Australia and New Zealand, so I will not repeat the excercise. I know from that prior experience, however, that Homewood's argument from personal incredulity is almost certainly wrong. I will go one step further than that. The Berkeley Earth project (BEST) uses an even larger data base than GISS, an entirely different method and does not adjust the raw data. Rather, where there is a clear break in the temperature record for a particular station, they treat it as a separate station and let things fall were they will. That method is well justified in that "stations" are often composites of records from differnt instruments, locations and site conditions which vary over time. In one case from NZ, the site moved to several different places in the city, from buildings to garden settings, with changes in altitude in 10s (and in one case I remember which may not be the same city, 100s of meters), and in one mover from an east facing coast (with typically warm offshore waters) to a west facing coast (with typically cool offshore waters). Every such move would have changed the temperatures read, and treating it all as just one continuous record without adjustment would be a farce.
In any event, here is BEST's temperature record for Paraguay:
So, overall Homewood makes his case, for the most part, by simply not addressing the relevant evidence. Indeed, some of the crucial evidence he keeps carefully out of sight. As is standard for "skeptics", he is very careful to make his arguments to the uninformed who will not be able to pick up the flaws in the argument, rather than submitting it to peer review by experts who will be able to pick out those flaws. I think, in so doing, he fairly judges the quality of his argument.
MEJ @332, in addition to my prior comment, ATTP shows the BEST unadjusted record for Puerto Casado, with dubious data noted, and break points shown:
You will note that the break points coincide with known station moves. As they are known station moves, Homewood is arguing without evidence that those station moves had no effect on the temperature, whereas comparing the station temperature record with the regional average clearly shows that there were effects (as we would expect).
We can also see the break point adjusted data:
Steve Mosher, one of the BEST team comments:
Richard Betts also comments:
(As fair notice, I disagree with Betts and Mosher on a number of topics. On the area of temperature records, however, they are undoubted experts and I would not disagree with them on that record unless I was aware of other similar experts with whom I not only agreed, but agreed for the same reasons those experts give for their views. Recognition of their expertise does not, however, mean I agree that they are right, or even sensible in some cases, in other topics outside of that expertise.)
Thanks 'RH' I will shorten the links next time (A noob mistake)
Thanks so much scaddenp, Rob and Tom. Tonnes of info there for me to study up on. You have me going in the right direction now. Like most folk I don't have the depth of knowledge many of you people do so it is pretty easy for a seasoned campainer like Homeswood to 'punk' me.
So glad I have SkS as backup.
MEJ, a new resource on the Paraguay data is now available. It really makes Booker (who it directly addresses), and by extension Homewood, look like fools. The video is by SkS's Kevin Cowtan (another expert on global tempertues, but one I rarely disagree with in other areas).
(H/t to Victor Venema)
Thanks Tom a very informative video from Kevin Cowtan. That software he is using is pretty cool. VERY clever. Good of Kevin to take the time. Could I just mention something. KC makes reference to 1970 & 2005 'temperature drop' doesn't Berkeley Earth flag those two periods as 'station moves'? I noticed that in the ATTP link 'scaddenp' posted #333
The bottom line, trump, checkmate, is Zeke Housefather's plot showing that overall, the raw data has a HIGHER trend than the global adjusted data. That's right, the adjusted data shows LESS warming than the raw data. So much for a conspiracy to make a hoax.
http://variable-variability.blogspot.de/2015/02/homogenization-adjustments-reduce-global-warming.html.
[PS] Fixed link
Zeke's work should be the lead-off for this 'Temperature Records" article.
Since the raw data has been adjusted to show LESS warming than the raw data, the issue is resolved. No need to explain the science of the "adjustments". End of story, no Hoax.
No one doubts that we have been recovering fro the LIA for the last 160 years without the help of CO2 for at least the first 100.
[TD] You are mistaken. Please read the post What Ended the Little Ice Age?--the Basic, then Intermediate, then Advanced tabbed panes. If you have further comments after reading those, comment on that thread, not this one.
An increase in temperature over the last 70 years may be due to urbanizaton around the increasingly urban sites.
[TD] A more appropriate thread for that particular narrow topic is the Urban Heat Island. Note there are both Basic and Intermediate tabbed panes.
[PS] Please take the time to look at the "arguments" button, and then perhaps under taxonomy for such well-worn myths. Repeating such tired slogans without any data or published literature in support of your argument is simply sloganeering and will be summarily deleted.
a[very small]rationofreason's two most recent posts fit exactly to the definition of sloganeering, and so are in direct violation of the comment's policy. I quote:
Not only that, by avoiding the giving of evidence; his or her comments rather contradict his or hers self flattering nom de net. As such, even my ammendation, while reducing the accuracy of the appelation, is still flatering to them, based on observed behaviour.
[PS] Agreed. Further sloganeering will be deleted. However, please also note the comment policy prohibition on inflammatory remarks.
I have rebutted arationofreason's sloganeering on the UHI effect, here.
I have an actual rebutal of the empty slogan @345 here.
Even though temperature measurements may not be considered reliable, we're still experiencing more natural disasters than before.