


 Arguments


Are surface temperature records reliable?
What the science says...
| Select a level... |
 Basic
Basic
|
 Intermediate
|
 Advanced
| ||||
|
The warming trend is the same in rural and urban areas, measured by thermometers and satellites, and by natural thermometers. |
|||||||
Climate Myth...
Temp record is unreliable
"We found [U.S. weather] stations located next to the exhaust fans of air conditioning units, surrounded by asphalt parking lots and roads, on blistering-hot rooftops, and near sidewalks and buildings that absorb and radiate heat. We found 68 stations located at wastewater treatment plants, where the process of waste digestion causes temperatures to be higher than in surrounding areas.
In fact, we found that 89 percent of the stations – nearly 9 of every 10 – fail to meet the National Weather Service’s own siting requirements that stations must be 30 meters (about 100 feet) or more away from an artificial heating or radiating/reflecting heat source." (Watts 2009)
At a glance
It's important to understand one thing above all: the vast majority of climate change denialism does not occur in the world of science, but on the internet. Specifically in the blog-world: anyone can blog or have a social media account and say whatever they want to say. And they do. We all saw plenty of that during the Covid-19 pandemic, seemingly offering an open invitation to step up and proclaim, "I know better than all those scientists!"
A few years ago in the USA, an online project was launched with its participants taking photos of some American weather stations. The idea behind it was to draw attention to stations thought to be badly-sited for the purpose of recording temperature. The logic behind this, they thought, was that if temperature records from a number of U.S. sites could be discredited, then global warming could be declared a hoax. Never mind that the U.S. is a relatively small portion of the Earth;s surface. And what about all the other indicators pointing firmly at warming? Huge reductions in sea ice, poleward migrations of many species, retreating glaciers, rising seas - that sort of thing. None of these things apparently mattered if part of the picture could be shown to be flawed.
But they forgot one thing. Professional climate scientists already knew a great deal about things that can cause outliers in temperature datasets. One example will suffice. When compiling temperature records, NASA's Goddard Institute for Space Studies goes to great pains to remove any possible influence from things like the urban heat island effect. That effect describes the fact that densely built-up parts of cities are likely to be a bit warmer due to all of that human activity.
How they do this is to take the urban temperature trends and compare them to the rural trends of the surrounding countryside. They then adjust the urban trend so it matches the rural trend – thereby removing that urban effect. This is not 'tampering' with data: it's a tried and tested method of removing local outliers from regional trends to get more realistic results.
As this methodology was being developed, some findings were surprising at first glance. Often, excess urban warming was small in amount. Even more surprisingly, a significant number of urban trends were cooler relative to their country surroundings. But that's because weather stations are often sited in relatively cool areas within a city, such as parks.
Finally, there have been independent analyses of global temperature datasets that had very similar results to NASA. 'Berkeley Earth Surface Temperatures' study (BEST) is a well-known example and was carried out at the University of California, starting in 2010. The physicist who initiated that study was formerly a climate change skeptic. Not so much now!
Please use this form to provide feedback about this new "At a glance" section, which was updated on May 27, 2023 to improve its readability. Read a more technical version below or dig deeper via the tabs above!
Further details
Temperature data are essential for predicting the weather and recording climate trends. So organisations like the U.S. National Weather Service, and indeed every national weather service around the world, require temperatures to be measured as accurately as possible. To understand climate change we also need to be sure we can trust historical measurements.
Surface temperature measurements are collected from more than 30,000 stations around the world (Rennie et al. 2014). About 7000 of these have long, consistent monthly records. As technology gets better, stations are updated with newer equipment. When equipment is updated or stations are moved, the new data is compared to the old record to be sure measurements are consistent over time.
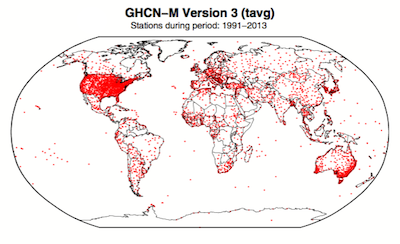
Figure 1. Station locations with at least 1 month of data in the monthly Global Historical Climatology Network (GHCN-M). This set of 7280 stations are used in the global land surface databank. (Rennie et al. 2014)
In 2009 allegations were made in the blogosphere that weather stations placed in what some thought to be 'poor' locations could make the temperature record unreliable (and therefore, in certain minds, global warming would be shown to be a flawed concept). Scientists at the National Climatic Data Center took those allegations very seriously. They undertook a careful study of the possible problem and published the results in 2010. The paper, "On the reliability of the U.S. surface temperature record" (Menne et al. 2010), had an interesting conclusion. The temperatures from stations that the self-appointed critics claimed were "poorly sited" actually showed slightly cooler maximum daily temperatures compared to the average.
Around the same time, a physicist who was originally hostile to the concept of anthropogenic global warming, Dr. Richard Muller, decided to do his own temperature analysis. This proposal was loudly cheered in certain sections of the blogosphere where it was assumed the work would, wait for it, disprove global warming.
To undertake the work, Muller organized a group called Berkeley Earth to do an independent study (Berkeley Earth Surface Temperature study or BEST) of the temperature record. They specifically wanted to answer the question, “is the temperature rise on land improperly affected by the four key biases (station quality, homogenization, urban heat island, and station selection)?" The BEST project had the goal of merging all of the world’s temperature data sets into a common data set. It was a huge challenge.
Their eventual conclusions, after much hard analytical toil, were as follows:
1) The accuracy of the land surface temperature record was confirmed;
2) The BEST study used more data than previous studies but came to essentially the same conclusion;
3) The influence of the urban stations on the global record is very small and, if present at all, is biased on the cool side.
Muller commented: “I was not expecting this, but as a scientist, I feel it is my duty to let the evidence change my mind.” On that, certain parts of the blogosphere went into a state of meltdown. The lesson to be learned from such goings on is, “be careful what you wish for”. Presuming that improving temperature records will remove or significantly lower the global warming signal is not the wisest of things to do.
The BEST conclusions about the urban heat effect were nicely explained by our late colleague, Andy Skuce, in a post here at Skeptical Science in 2011. Figure 2 shows BEST plotted against several other major global temperature datasets. There may be some disagreement between individual datasets, especially towards the start of the record in the 19th Century, but the trends are all unequivocally the same.
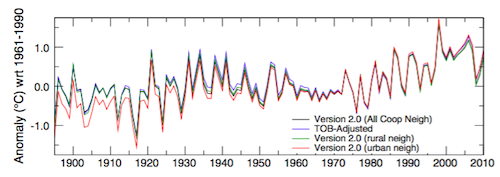
Figure 2. Comparison of spatially gridded minimum temperatures for U.S. Historical Climatology Network (USHCN) data adjusted for time-of-day (TOB) only, and selected for rural or urban neighborhoods after homogenization to remove biases. (Hausfather et al. 2013)
Finally, temperatures measured on land are only one part of understanding the climate. We track many indicators of climate change to get the big picture. All indicators point to the same conclusion: the global temperature is increasing.
See also
Understanding adjustments to temperature data, Zeke Hausfather
Explainer: How data adjustments affect global temperature records, Zeke Hausfather
Time-of-observation Bias, John Hartz
Check original data
All the Berkeley Earth data and analyses are available online at http://berkeleyearth.org/data/.
Plot your own temperature trends with Kevin's calculator.
Or plot the differences with rural, urban, or selected regions with another calculator by Kevin.
NASA GISS Surface Temperature Analysis (GISSTEMP) describes how NASA handles the urban heat effect and links to current data.
NOAA Global Historical Climate Network (GHCN) Daily. GHCN-Daily contains records from over 100,000 stations in 180 countries and territories.
Last updated on 27 May 2023 by John Mason. View Archives


IanC, thankyou for your detailed analysis. I note that your plotted difference is a close match to that provided by Kevin, but what a difference in perspective does the inclusion of the original data make. In this case it is worth noting that the GISStemp trend is 0.64 C per century. The overall change in trend is, therefore, less than 10% of the total.
Tom Curtis,
I think you'll find that a lot of "skepticism" can be boiled down to failing to put things into perspective. :-)
So, my point is discounted because the changes are only 10%, yet, I am proven false because of one adjustment that is less than 3% of the overall adjustments? That doesn't seem right.
My overall point though, and the thread topic, is the reliability of the data. I'd say a 10% adjustment is rather large, considerring everyone "thought" the data was correct before the adjustment.
I don't have enough info regarding the algorithm to say anything more about it, except the general observation, again, that the chances of all the adjustments being on "the correct side of the belief paradine" can't be 100% (sorry - 99%).
Kevin, if everybody thought the data were right before the adjustment they would have stopped working on it and the adjustment would not have been made. The adjustment was made precisely because of the research of climatologists who work to understand the limitations of the data.
Your argument is a straw man, the climatologists know that the data were collected for purposes other than climatology (i.e. weather forecasting, which has differing requirements), and research on dealing with these issues is ongoing (perform a google scholar search on "homogenisation" of station data.).
Now just because the data are not perfect, that does not imply that they are unreliable, as the uncertainties are quantifiable, even if they are not displayed in every graph you see.
Kevin:
IMO your point is discounted because you have presented no evidence to support it. Only suspicions based on your perception of the adjustments and a graph from Climate4You.
There is no a priori reason to expect that adjustments to NASA GISS historical temperature data must be "fair and balanced". Only that they (a) address identifiable problems with the data and (b) are methodologically sound.
If you have evidence that one or both of (a) or (b) is not the case, or can link to someone else who does, then by all means bring it to the attention of the pros here (and even better, bring it to NASA's attention).
But you are going to need more than your personal suspicions as expressed in:
or
(By the way, can you please provide some kind of substantiation that "everyone thought" the historical data was correct before the adjustment? There's a rather large difference between thinking that data is 100% correct, and thinking it is correct enough.
Kevin - Regarding your complaints on adjustments, I'll just restate something I posted on one of the "skeptic" blogs on those very adjustments:
It could be argued that it’s better to look at raw temperature data than data with these various adjustments for known biases. It could also be argued that it’s worth not cleaning the dust and oil off the lenses of your telescope when looking at the stars. I consider these statements roughly equivalent, and (IMO) would have to disagree.
If you don't agree with adjustments for various biases, you're going to have to address them directly - regarding the particular adjustment, with support for your opinion - before such criticism can be taken seriously.
Otherwise, such complaints are just arm-waving.
Kevin: "considerring everyone "thought" the data was correct before the adjustment."
"Correct" is not a binary choice (yes, no) in science. No data are perfect. They don't have to be perfect in order to be useful. Even when they are already good enough to be useful, it is possible to get greater utility by improving the analysis.
You seem to be falling into the "if we don't know everything, we know nothing" mindset where certain individuals in the fake skeptic camp play the uncertainty monster. If you waited until your knoweldge was perfect before doing anything, you wouldn't even be able to get out of bed in the morning.
These adjustments were made in 2008. This thread was started in 2007. Therefore there was confidence that these were accurate before they were. That is my point.
You are correct. I do not have a priori reason to expect that, just logic, common sense, and probability.
A new algorithm is used that can find abnormalities better. It stands to reason, that the probability of finding data that "needs corrective action" only on "one side of the argument" would be rather small.
It is just a thought provoking exercise. Do you really believe that all those adjustments were needed, but that there was only the one adjustment the other way? I just read a piece by Dr. Sanford (Union Concerned Scientists) the other week where he was arguing that due to the fact that since there were MORE high temp records than low temp records lately, that this proved AGW theory. That level was something like 75-25, not 99-1.
This is the nature of the thread here. How reliable is the data. I am not naive to believe it can ever be 100% accurate, nor does it have to be. Again, this thread started in 2007, saying how reliable that data was, then there is a correction that adjusts the data in such a way as to increase the warming trend by 10% in 2008, so how reliable was it in 2007?
That's all I'm asking.
Kevin wrote "These adjustments were made in 2008. This thread was started in 2007. Therefore there was confidence that these were accurate before they were. That is my point."
If that is your point, you are labouring under a misaprehension. Most SkS regulars are well aware of the fact that there are homogenisation issues with the data, and that there will continue to be adjustments as the science improves. That is the nature of science. However that does not mean that the data are unreliable, even with the adjustments, the uncertainties are small enough to be confident of the conclusions being drawn on the basis of those data.
Kevin wrote "Again, this thread started in 2007, saying how reliable that data was, then there is a correction that adjusts the data in such a way as to increase the warming trend by 10% in 2008, so how reliable was it in 2007?
That's all I'm asking."
However, Kevin earlier wrote "If the data is/was so accurate, why does Hansen keep changing it? And why are ALL changes in the direction that support his belief? You would think that at least some "mistakes" were made in the other direction, no? How much cooler are the 30's going to get?"
It seems to me that your purpose has changed somewhat!
If you want to ask scientific questions, then ask them, rather than imply scientists have been disingenuous. All that achieves is to create a combative atmosphere that rarely helps much.
Kevin - If you disagree with any of the corrections to the data, positive or negative in how they affect trends, you are going to have to state why that correction might be invalid!
You have not done so.
All you have done is express multiple fallacies: Argumented ad Consequentiam fallacy, an appeal to consequences, without addressing the truth or falsity of the corrections themselves (a correction was upward, therefore it must be wrong), the Common Sense fallacy, and an Argument from Personal Astonishment. I'm afraid none of those hold up against actual data.
As to pre-2007, our estimations improve all the time as new data comes in, as new relationships are identified. By your logic we should still be using Ptolemaic spheres...
Kevin:
Unfortunately, your point appears to rest on a false dichotomy: that data are either accurate or they are not. As Bob Loblaw noted, data are actually on a continuum of more or less accurate and there is almost always room for improvement. If the accuracy of GISTemp improved due to the 2008 adjustments, it does not follow, of necessity, that it was not accurate before, only that it was less accurate.
This is an argument from personal incredulity, not an appeal to "logic", "common sense", or "probability". In addition, with regards to treating the data there are no "sides of the argument". There are only identifiable, quantifiable uncertainties & biases (of the methodological/numerical kind, not the political kind) in the data and adjustments to correct them.
Are those Dr Sanford's exact words? Is there a link? Based on what you have written it appears Dr Sanford noted that high temperature records exceeded low temperature records in the given timeframe by a ratio of 3:1. How is this pertinent? Insofar as you are tying this back to a ratio of adjustments performed on NASA GISS, this appears to be a non sequitur.
The false dichotomy identified at the start remains in play here. Just because the data was made more accurate/more reliable in 2008 does not mean it wasn't accurate or reliable at all in 2007. It just means it was not as accurate. If you suspect otherwise, can you provide some sort of calculation or other analysis to support your suspicion (or a link to someone else doing so)?
Composer99 - Excellent catch on the False Dichotomy.
Kevin - You have (incorrectly) posed the question of accuracy as binary; that if current data is accurate then previous data cannot be accurate, cannot be trusted, and you then attempted to use that as a Reductio ad Absurdum argument against corrections.
That is simply wrong.
The real state of affairs is a continuum:
Again, if you disagree with any particular correction(s), you are going to have to present data demonstrating an issue with that. Not logical fallacies and arm-waving, which is all you have presented to date.
Kevin @253 claims:
In fact, if you look at the SkS trend Calculator you will see that the trend for Gistemp is 0.064 C per decade +/- 0.007 C per decade (11%). So his point is that the temperture record is not as accurate as advertized because a change smaller than the advertized accuracy has been made.
Even more bizzare is claim that:
It has been already established that the change in gistemp is primarilly because of changes in the Global Historical Climate Network, whose algorithim Kevin claims ignorance of. Here are the actual adjustments from raw data made by that algorithm:
(Note: Darwin is highlighted because it comes from a discussion of a frequent denier cherry pick used to suggest the GHCN adjustments are wrong.)
The key point for this discussion is that the adjustments are not 99% in one direction. They are very close to being 50/50. In another discussion of adjustment bias, it was found that the mean adjustment of 0.017 degrees C/decade. This data is for the GHCNv2 rather than v3, but no doubt the statistics of the later will be similar.
I think the expectation that adjustments should be even is also misplaced. If you want to compare temperature measurements mad today with measurement taken in the morning, against same station but temperature done in afternoon, then you have to move past temperature down. Its a change of practise. Likewise, comparing modern screened electronic thermometer against past unscreened and glass thermometer also require past to be adjusted down.
I would certainly not expect any of the temperature records to be beyond improvement. Its a case of methodology advancement and available funding. What is also clear though is that you cant blame GW on adjustments.
scaddenp is correct. Most of the historical changes that have introduced inhomogeneities into the temperature record have tended to cause recorded temperatures to suddenly go down. Station moves from built-up locations to more rural locations (e.g. Darwin, Port Hedland); switching to Stephenson screens; changing Time of Observation; changing the method sea surface temperatures were recorded after WWII; heck, in the very earliest part of the Central England Temperature record, the temperatures are not comparable because the thermometers were placed inside to avoid having to go out in the cold to read them!
So we should expect corrections to often be increasing recent temperatures or decreasing older temperatues as we become more able to isolate and correct for various effects.
However, suppose that in spite of the facts:
In spite of all those facts, you just don't trust any form of correction? Not because you can actually identify anything wrong in all that publicly-available information, but just because your gut tells you it must be so?
Well, in that case you can completely avoid all corrections by simply detecting when a discontinuity in a temperature station's record occurs, and then simply break the record in two at that point. Pretend it's actually two completely different records, and make no effort to quantify the effect of the discontinuity so that you can correct for it.
What do you get then? Why, BEST of course!
And guess which land-only temperature series has the highest trend?
The algorithm was put in to pick up disparaties, not a change in when temp was measured. So this argument does not apply.
That is not what I was saying. For the century, there was a 10% increase in the rate of temp increase, solely due to these adjustments.
Tom Curtis,
I didn't state that all the temp adjustments were positive, I stated that all of them made the temp increase rate change in a positive fashion. Lower the early temps, increase the latter temps. When you look at the chart I gave, that is exactly what happened.
Kevin:
Really? I'd say there'd be a disparity, almost by definition, between temperature readings a weather station makes at one time of day and those it makes at another.
With regards to the remainder of your comment #266, the bottom line is that you have articulated suspicions (yours and others') that something is wrong with GISTemp following adjustments made in 2008.
However, and this is the critical part, you have not provided, either directly in the comments or by link to another site, any actual criticism of the adjustments. What you have instead provided is an extended argument from personal incredulity and allegations of bias.
If you can furnish any sort of methodological critique of GISTemp's processes, I am sure that the knowledgeable commenters here would be quite happy to discuss them. Until then, however, it seems to me that you are wasting your time - I rather doubt you will convince those skeptical of your claims as long as you limit your arguments to the above.
Kevin, I am giving you reasons why a disparity would suddenly appear. A change in TOBS, move from city to airport, change of thermometer, and change of screen will all create a discontinuity in the record that the algorithm will pick up, and they will all result in temperatures taken after the change being lower than the ones before, so adjustments will increase trend.
Kevin @266, first, the chart I showed @263 is not of adjustment of individual temperature datums, but of adjustment to station trends. That is not a matter of adjustments down early and up late, but of differing adjustment for each station that just happen to have a mean value slightly above zero, even though nearly half make negative adjustments to the trend.
Second, it is not a 10% adjustment, but an 8.9% adjsutment in a record with an 11% error margin. Further, it was not an adjustment in the temperature at all, but an adjustment in an index of temperature which you have done nothing to show makes that index less accurate. For all you know, and most probably, it has made it more accurate.
I have 3 questions (1) Since oceans store same heat per ~20' depth as all air & all land that's relevant (to ~20' depth) why is avg global temp being used rather than ocean heat energy in the graphs publicly discussed ? (2) Is avg global temp a simple avg of all readings, or weighted ? (3) Can I find a proxy historical global temp set (600Ka ? 600Ma ?) to fine time resolution - a millenium ? a century ?). Anybody ?
grindupBaker,
1. Public interface. The thermal capacity of the oceans is difficult to explain to the general public, and surface temp is "in your face."
2. Hansen 2010; HadCRU; BEST
3. I'll defer to others.
Further to DSL
2- no it is absolutely not a simple average. First "global average temperature" is tough to define (and measure) so what is usually calculated is global average anomaly. Second, all the temperature records use area weighting. However, there is a lot of differences in the detail (and a lot of detail). The advanced section of this article gives you good pointers for more information.
3- Any proxy of use has to have two attributes - a way to tell the time accurately and a way to tell the temperature. The best long term proxy is ice core bubbles. The "lock in" time for a bubble is short and where you have annual snow layers, you have very good clock. Thermometry is also very good compared to most other proxies. Resolution degrades as you go back in time for all proxies. Ice core gets you 600Ka but only for very selected places on earth (greenland and Antarctica). Spelothems are prob next best as far as I know but more problematic for absolute dating and thermometry but wider global coverage. Going back beyond these you lose time resolution badly as you become dependent on radiometric dating resolution. Resolution will depend on the particular technique. In something like benthic forams from marine cores you can good relative time but not absolute time (and a lot of fun interpreting the thermometry).
In short all proxies have issues of one sort or another and paleoclimate studies are best within integrating multiple lines of evidence.
Go to http://www.ncdc.noaa.gov/paleo/recons.html for data but read metadata about limitations before leaping to any wild conclusions.
..and furthermore...
Air temperature measurements were not started with the monitoring of climate in mind. The concept of "climate" probably didn't even exist in those terms until after people started accumulating data. As experience accumulated, methods of measuring temperature improved (and changes need to be accounted for in looking at long-term trends).
Even though historical air temperature records are an incomplete view of historical global conditions, they are useful. Extensive land surface air temperature records go back much further than ocean temperature records. We understand many of the linkages between ocean and land temperatures, and we can account for much of the differences in patterns. AIr temperatures are but one part of the jigsaw puzzle, but they do help.
I'm doing another AGW debate and was wondering if someone can give me a quick response to the following claim, or refer me to where I can read up on it myself:
"To start with the "global warming" claim. It is based on a graph showing that "mean annual global temperature" has been increasing.
This claim fails from two fundamental facts
1. No average temperature of any part of the earth's surface, over any period, has ever been made. How can you derive a "global average" when you do not even have a single "local" average?
What they actually use is the procedure used from 1850, which is to make one measurement a day at the weather station from a maximum/minimum thermometer. The mean of these two is taken to be the average. No statistician could agree that a plausible average can be obtained this way. The potential bias is more than the claimed "global warming.
2. The sample is grossly unrepresentative of the earth's surface, mostly near to towns. No statistician could accept an "average" based on such a poor sample.
It cannot possibly be "corrected" It is of interest that frantic efforts to "correct" for these uncorrectable errors have produced mean temperature records for the USA and China which show no overall "warming" at all. If they were able to "correct" the rest, the same result is likely."
dvaytw, I suggest you ask the person how s/he would, ideally, determine whether or not global energy storage was increasing via the enhanced greenhouse effect. That will either push the person toward an evasive rejection of the greenhouse effect (which you can counter with directly measured surface data that confirm model expectations) or push the person into giving you their answer to the question. If you get that answer, then you can compare it with what scientists are actually doing.
It's an odd complaint anyway, since satellite data--even the raw data--confirm the surface station trend, and stratospheric cooling can only be partially attributed to other causes. Then there's ocean heat content data (an invitation to weasel via Pielke and Tisdale, though), global ice mass loss data (harder to deal with, but the move will probably be "it's happened before."), changes in biosphere, thermosteric sea level rise, and the host of other fingerprints.