


 Arguments


Are surface temperature records reliable?
What the science says...
| Select a level... |
 Basic
Basic
|
 Intermediate
|
 Advanced
| ||||
|
The warming trend is the same in rural and urban areas, measured by thermometers and satellites, and by natural thermometers. |
|||||||
Climate Myth...
Temp record is unreliable
"We found [U.S. weather] stations located next to the exhaust fans of air conditioning units, surrounded by asphalt parking lots and roads, on blistering-hot rooftops, and near sidewalks and buildings that absorb and radiate heat. We found 68 stations located at wastewater treatment plants, where the process of waste digestion causes temperatures to be higher than in surrounding areas.
In fact, we found that 89 percent of the stations – nearly 9 of every 10 – fail to meet the National Weather Service’s own siting requirements that stations must be 30 meters (about 100 feet) or more away from an artificial heating or radiating/reflecting heat source." (Watts 2009)
At a glance
It's important to understand one thing above all: the vast majority of climate change denialism does not occur in the world of science, but on the internet. Specifically in the blog-world: anyone can blog or have a social media account and say whatever they want to say. And they do. We all saw plenty of that during the Covid-19 pandemic, seemingly offering an open invitation to step up and proclaim, "I know better than all those scientists!"
A few years ago in the USA, an online project was launched with its participants taking photos of some American weather stations. The idea behind it was to draw attention to stations thought to be badly-sited for the purpose of recording temperature. The logic behind this, they thought, was that if temperature records from a number of U.S. sites could be discredited, then global warming could be declared a hoax. Never mind that the U.S. is a relatively small portion of the Earth;s surface. And what about all the other indicators pointing firmly at warming? Huge reductions in sea ice, poleward migrations of many species, retreating glaciers, rising seas - that sort of thing. None of these things apparently mattered if part of the picture could be shown to be flawed.
But they forgot one thing. Professional climate scientists already knew a great deal about things that can cause outliers in temperature datasets. One example will suffice. When compiling temperature records, NASA's Goddard Institute for Space Studies goes to great pains to remove any possible influence from things like the urban heat island effect. That effect describes the fact that densely built-up parts of cities are likely to be a bit warmer due to all of that human activity.
How they do this is to take the urban temperature trends and compare them to the rural trends of the surrounding countryside. They then adjust the urban trend so it matches the rural trend – thereby removing that urban effect. This is not 'tampering' with data: it's a tried and tested method of removing local outliers from regional trends to get more realistic results.
As this methodology was being developed, some findings were surprising at first glance. Often, excess urban warming was small in amount. Even more surprisingly, a significant number of urban trends were cooler relative to their country surroundings. But that's because weather stations are often sited in relatively cool areas within a city, such as parks.
Finally, there have been independent analyses of global temperature datasets that had very similar results to NASA. 'Berkeley Earth Surface Temperatures' study (BEST) is a well-known example and was carried out at the University of California, starting in 2010. The physicist who initiated that study was formerly a climate change skeptic. Not so much now!
Please use this form to provide feedback about this new "At a glance" section, which was updated on May 27, 2023 to improve its readability. Read a more technical version below or dig deeper via the tabs above!
Further details
Temperature data are essential for predicting the weather and recording climate trends. So organisations like the U.S. National Weather Service, and indeed every national weather service around the world, require temperatures to be measured as accurately as possible. To understand climate change we also need to be sure we can trust historical measurements.
Surface temperature measurements are collected from more than 30,000 stations around the world (Rennie et al. 2014). About 7000 of these have long, consistent monthly records. As technology gets better, stations are updated with newer equipment. When equipment is updated or stations are moved, the new data is compared to the old record to be sure measurements are consistent over time.
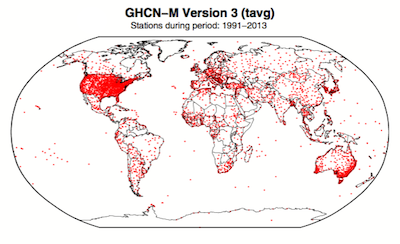
Figure 1. Station locations with at least 1 month of data in the monthly Global Historical Climatology Network (GHCN-M). This set of 7280 stations are used in the global land surface databank. (Rennie et al. 2014)
In 2009 allegations were made in the blogosphere that weather stations placed in what some thought to be 'poor' locations could make the temperature record unreliable (and therefore, in certain minds, global warming would be shown to be a flawed concept). Scientists at the National Climatic Data Center took those allegations very seriously. They undertook a careful study of the possible problem and published the results in 2010. The paper, "On the reliability of the U.S. surface temperature record" (Menne et al. 2010), had an interesting conclusion. The temperatures from stations that the self-appointed critics claimed were "poorly sited" actually showed slightly cooler maximum daily temperatures compared to the average.
Around the same time, a physicist who was originally hostile to the concept of anthropogenic global warming, Dr. Richard Muller, decided to do his own temperature analysis. This proposal was loudly cheered in certain sections of the blogosphere where it was assumed the work would, wait for it, disprove global warming.
To undertake the work, Muller organized a group called Berkeley Earth to do an independent study (Berkeley Earth Surface Temperature study or BEST) of the temperature record. They specifically wanted to answer the question, “is the temperature rise on land improperly affected by the four key biases (station quality, homogenization, urban heat island, and station selection)?" The BEST project had the goal of merging all of the world’s temperature data sets into a common data set. It was a huge challenge.
Their eventual conclusions, after much hard analytical toil, were as follows:
1) The accuracy of the land surface temperature record was confirmed;
2) The BEST study used more data than previous studies but came to essentially the same conclusion;
3) The influence of the urban stations on the global record is very small and, if present at all, is biased on the cool side.
Muller commented: “I was not expecting this, but as a scientist, I feel it is my duty to let the evidence change my mind.” On that, certain parts of the blogosphere went into a state of meltdown. The lesson to be learned from such goings on is, “be careful what you wish for”. Presuming that improving temperature records will remove or significantly lower the global warming signal is not the wisest of things to do.
The BEST conclusions about the urban heat effect were nicely explained by our late colleague, Andy Skuce, in a post here at Skeptical Science in 2011. Figure 2 shows BEST plotted against several other major global temperature datasets. There may be some disagreement between individual datasets, especially towards the start of the record in the 19th Century, but the trends are all unequivocally the same.
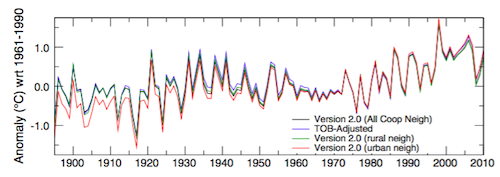
Figure 2. Comparison of spatially gridded minimum temperatures for U.S. Historical Climatology Network (USHCN) data adjusted for time-of-day (TOB) only, and selected for rural or urban neighborhoods after homogenization to remove biases. (Hausfather et al. 2013)
Finally, temperatures measured on land are only one part of understanding the climate. We track many indicators of climate change to get the big picture. All indicators point to the same conclusion: the global temperature is increasing.
See also
Understanding adjustments to temperature data, Zeke Hausfather
Explainer: How data adjustments affect global temperature records, Zeke Hausfather
Time-of-observation Bias, John Hartz
Check original data
All the Berkeley Earth data and analyses are available online at http://berkeleyearth.org/data/.
Plot your own temperature trends with Kevin's calculator.
Or plot the differences with rural, urban, or selected regions with another calculator by Kevin.
NASA GISS Surface Temperature Analysis (GISSTEMP) describes how NASA handles the urban heat effect and links to current data.
NOAA Global Historical Climate Network (GHCN) Daily. GHCN-Daily contains records from over 100,000 stations in 180 countries and territories.
Last updated on 27 May 2023 by John Mason. View Archives


Eclectic @400, the change in radiation due to changes in the Earth's orbit (Milankovitch cycles) has mostly a regional effect, with almost no net effect on globally averaged radiative forcing. The regional effect, however, can be quite large, and is sufficient to cause feedbacks which in turn are responsible for nearly 100% of the change in the energy balance between glacial and interglacial. Those feedbacks can be changes in albedo (ice sheet, sea ice, and snow extent, along with changes to vegetation) and changes in greenhouse gas concentration (mostly CO2 and CH4). According to a well known figure from Hansen, the greenhouse gases represent about 46% of the total effect, with the rest being from changes in albedo:
(Source)
Bulthompsn @399, I am not aware of anybody here "blowing off" human error when discussing Global Mean Surface Temperature (GMST). Certainly the scientists who analyze it do not. Indeed, the take great care to analyze potential sources of error, and to quantify the resulting uncertainty in their estimate of GMST, as shown in this graph from the Berkely Earth Surfact Temperature project (BEST):
Note, that the grey shaded zone (the 95% confidence interval of the annual GMST estimate) shrinks rapidly from 1850 to 1880, and that post 1950 is very small relative to the decadal change in GMST. Other teams do not typically show uncertainty on the graphs, but do publish the uncertainty with the data and in scientific papers discussing methodology.
Nor are the satellite records more accurate than the surface records. That is not just my opinion, but that of Carl Meares, head of the team that produces the RSS satellite temperature records, who said:
(My emphasis, source)
This can be seen by comparing the size of the error in the trend estimate for RSS TLT vs HadCRUT4 for the period 1979-2012:
Indeed, the satellite record requires more adjustments from a more disparate original data set than is required for the surface record. This is something people pushing the accuracy of the satellite record never see fit to mention, but that it is the case is obvious when you have a look at (already partially adjusted) satellite data (top panel):
For further information see here, here, here, and here (the start of a four part series).
Finally, IMO, anybody who subscribes to a conspiracy theory of science ("This presumes that these current results are not being doctored") has thereby invalidated any claim they may have made to be informed, or rational on the topic.
Tom Curtis @401
Thank you for the correction on CO2/albedo contributions to the episodic cooling process producing a (modern) glacial age. The diagram you supplied indicates a (roughly) one-third contribution coming from CO2 changes alone, for the cooling phase.
May I ask you whether the warming-phase figures are similar — or whether the CO2/albedo relationship is asymmetric regarding the actual causation of progressive warming as the planet exits a glacial age (i.e. whether CO2 plays a larger role in the ultimate root cause of the rapid 3-degree warming which terminates the typical glacial age) ?
My error in #400, came from mis-remembering your recent statement [which I have checked as being: 11 January 2017, Comment #513, in "CO2 Lags Temperature"] that "90% of the temperature increase lags the CO2 increase". Which (on reflection!!) certainly is not equivalent to saying that only 10% of glacial-to-interglacial warming is caused by the (Milankovitch) orbital variation and its arctic albedo effects .... with the rest being a direct consequence of CO2 and other GHG's. !
I had concentrated more on the final question from Bulthompsn @399, where he had made an irritable (off-topic) question, which would have been better made separately on the "CO2 Lags Temperature" thread. But since his @399 comments had a tone/manner suspiciously suggestive of a "drive-by" venting, I thought it pardonable to answer him entirely in this thread.
If you can spare the time, Tom, please reply on the "CO2 Lags Temperature" thread. I consider the "90%" figure a very useful one, in countering the frequent denier meme that the "lag" must mean that CO2 is a trivially unimportant tail of the climate dog.
Eclectic @403, I have responded here.
[PS] Thanks for your consideration in keeping conversation ontopic. Most appreciated.
How can it be said that the temperature record is reliable when in June 2015, NOAA published a paper describing certain adjustments they had made to "improve" the data, and in so doing, they eliminated the 17 year warming hiatus that was troubling many climate scientists. Not only that, but the temperature history during the last two decades of the 20th century was rewritten to double the rate of temperature increase. Assuming those adjustments were necessary to correct data errors, it opens questions as to the competency of the individuals involved in the data handling. Evidently, there were serious problems in the data gathering and processing that went on for 20-30 years, and it took an apparent slowdown in the warming to bring it to anyone's attention. Allegedly, the problem is "fixed" now, but with the lack of competency that plagued the data handling process, how do we know the fix is any better than the original?
[JH] Argumentative/perjorative statement snipped. Please read the SkS Comments Policy and adhere to it.
cosmoswarrior @405:
here are the differences between raw and asjusted GHCNv3 data, as calculated by Victor Venema:
The GHCN data was until recently the entire basis of the NOAA land only surface temperature data, and almost the entire basis of the GISS meteorological stations only temperature data. The comparison applies for those sources also. As can easilly be seen, there is almost no difference between the raw and adjusted data from 1980 forward. Your claim that "the temperature history during the last two decades of the 20th century was rewritten to double the rate of temperature increase" is simply false.
NOAAs conclusions about the non-existing "hiatus" have been confirmed by other studies using independent data. Zeke Hausfather from Berkeley Earth explains how they did it here and here.
BTW, the Berkeley Earth surface temperature project was founded by physicist and former climate skeptic Richard Muller to address the most important objections the deniers had to the "official" temperature records. They constructed their own temperature record, which turned out to be very similar to the ones from NOAA, NASA and the British HadCRUT4.
So where is all of this temperature data that shows the "hiatus" isn't real? It's obviously not the GHCN data shown in Comment 406. As Tom Curtis himself points out "there is almost no difference between the raw and adjusted data from 1980 forward". So where is this data with a big enough difference between the raw and adjusted values such that the raw data shows a warming hiatus but the adjusted values do not?
Now, before you delete this question/comment and disable my login, I believe I am asking a simple, straight-forward question that should be easily answerable if in fact the adjusted data is what the elimination of the warming hiatus is based upon. Therefore, if this comment is simply deleted before I receive a satisfactory answer to my question, I will proceed on the basis that no such data exists, and that eliminating the hiatus was based on politics and not science.
[JH] Please spare us the polemics.
[TD] I can't make sense of your question. Your first sentence would match the rest of your first paragraph if your first sentence instead was "...that shows the 'hiatus' is real?" Tom Curtis showed you data (and you can download it yourself instead of taking Tom's word for it) revealing no such difference. The "hiatus" does not and never has existed.
[DB] This user is just another sock puppet of serial spammer cosmoswarrior/coolearth; accordingly, their posting rights have been rescinded. As will future iterations of this serial spammer.
cosmoswarrior/coolearth/diehard appears to not like my pointing out @406 the gross error in his claim that "...the temperature history during the last two decades of the 20th century was rewritten to double the rate of temperature increase". Rather than admit that gross error, he quibbles about the data source, and about the change in the NOAA temperature data set detailed in Karl et al (2015). To deal with his quibbles, here is a comparison of raw and adjusted data in the new data set in figure 2 of Rove et al (2015):
The top panel shows the difference between prior adjusted data set, and the new adjusted data set. It is very clear that use of the new data sets make almost no difference to the trend. In the bottom panel is a comparison of the new adjusted data set to the raw data set. Post 1945 there is almost no difference, and in particular it is clear that claims that "...the temperature history during the last two decades of the 20th century was rewritten to double the rate of temperature increase" are at best massively misinformed, and at its source, a lie.
With regard to the disappearing of the "hiatus", that comes about in Karl et al (2015) not because they use a new method of adjustments, but because they use two new data sets. Specifically, they switch from ERSSTv3 to ERSSTv4 for marine temperatures, and from GHCNv3 to the ISTI database for land temperatures. The later represents a switch to a larger database with a more extensive coverage. It represents more data. The change in ERSST versions involves, "...updated and substantially more complete input data from the International Comprehensive Ocean–Atmosphere Data Set (ICOADS) release 2.5; revised empirical orthogonal teleconnections (EOTs) and EOT acceptance criterion; updated sea surface temperature (SST) quality control procedures; revised SST anomaly (SSTA) evaluation methods;
updated bias adjustments of ship SSTs using the Hadley Centre Nighttime Marine Air Temperature dataset version 2 (HadNMAT2); and buoy SST bias adjustment not previously made in v3b." It's effect on the NOAA temperature record is discussed in detail by Kevin Cowtan here. It has also been discussed by Zeke Hausfather as part of a more comprehensive discussion of the NOAA updates.
Finally, the "hiatus" is not defined as a period of zero or negative trend in Global Means Surface Temperature (GMST). Rather, it is defined as a period in which the zero trend is within the error margin of the observed trend. As it happens, the long term trend has been within the error margin of the observed trend through out all periods considered to be part of the hiatus. That means, logically, there is no more reason to consider the trend to be zero than there is to consider it to have continued unabated. Indeed, given that all purported periods of the "hiatus" are parts of periods in which there is a statistically significant positive trend, there is more reason in those periods to consider them to be periods or warming rather than stasis. In short, the "hiatus" was at best only a statistical artifact such that a small change in the observed trend (approximately one standard error) over the period of the "hiatus" makes it transparently an artifact. That so small a change can make it "disappear" shows it to have been, at best, an artifact all along.
[PS] I think this serial spammer is data-resistant but thanks for clarifying the matter for the benefit of other readers.
No, Tom Curtis. Your graphs do not satisfy my "quibbles" — not in the slightest. What I am looking for are the "corrections" that were applied to the original data (which clearly showed a warming hiatus) in order to eliminate the warming hiatus. These data adjustments, as I stated in a previous posting, totally eliminated the warming pause and about doubled the warming rate. Now, before negating me again on this claim and being too quick to delete this posting, be advised that this was part of the introductory statement made by Zeke Hausfather on the video Recent Ocean Warming has been Underestimated. In his words, "... they increased the amounts of warming that we have experienced pretty significantly. They roughly doubled the temperature trend since 1998 compared to the old versions of the datasets." So who am I supposed to believe, you or him!?
Now from the email newsletters I get from the "denier" community along with a few online news articles about whistleblowers and NASA and NOAA fighting the Congressional investigation, I believe I have some insight as to why you can't come up with the dataset showing the adjustments that did away with the warming hiatus. NOAA simply refused to cooperate with the investigation and witheld the subpeonad email communications and scientific data. Since this was still during the Obama administration, the Whitehouse would not enforce their compliance. Therefore, the world may never know just what killed the hiatus at NOAA, and I'm supposed to accept their "data" as "overwhelming evidence with 97% consensus". — Give me a break! If this is your version of science, you can keep it!
Finally, I would like an apology from you for your statement "Rather than admit that gross error, he quibbles about the data source, and about the change in the NOAA temperature data set detailed in Karl et al (2015)." We know now that my claim was not erroneous at all. Either that or Zeke Hausfather made the same "gross error". Also, I resent your use of the term "quibbles" as it gives readers the impression that my concerns are over trivia as opposed to the primary issue of assessing the amount of global warming we are experiencing.
[PS] More gross violations of policy from already banned user. No responses please.
Update - this latest incarnation now removed. Why someone who has no intention of abiding by comments policy post here is mystery.
I would like to comment on your responses to cosmoswarrior and diehard in their postings about the reliability of NOAA temperature data. First, in the response Tom Curtis gave to cosmoswarrior in @406, he showed the GHCNv3 data before and after the corrections, and pointed out that there was "almost no difference between the raw and adjusted data from 1980 forward". Tom Curtis then used this fact to argue that cosmoswarrior was incorrect in his/her statement about the data adjustments made in 2015 (which eliminated the "warming hiatus") also rewrote the temperature data for the last two decades of the 20th century. This is not an equitable comparison, however, since GHCNv3 was a land-based dataset only and the major changes had to do with the sea-surface measurements. Therefore, we cannot use this fact to argue that the statement by cosmoswarrior about "pause-buster" data corrections is "simply false" or that he/she is in "gross error".
At this point, I don't believe the fact can be disputed that NOAA made major changes in temperature data in June 2015 which in fact eliminated the appearance of a warming slowdown after 1998. The writings and videos by Kevin Cowtan and Zeke Hausfather that you in fact post and reference discuss the affects of these "adjustments" on the temperature trends. Additionally, news of these sweeping changes, including rewriting of data (which at least most of us have never seen before in any scientific effort), caused a huge controversy in the entire climate science field and eventually prompted a Congressional investigation. Therefore, if cosmoswarrior and diehard are mistaken in their statements, they are far from being the only ones.
[PS] Try again - after you have read the comments policy. Note, no sloganeering, no accusations of fraud. Check for accuracy of your premises (what you read on some denier site is likely wrong) and logic. Unless you think a telescope works best without wiping the dust off, you need provide evidence that adjustments to temperature record are scientifically invalid, not that you dont like the results.
[DB] This sock puppet of serial spammer cosmoswarrior will not be rejoining this conversation.
While strongly suspecting that moonrabbit @411 is yet another sock puppet, I will point out that my post at @406 exclusively criticizes cosmoswarrior/diehard/dieharder's claim @405 that:
As can be easilly seen from the graph @406, and the equivalent graph from Karl et al shown at @409 (panel b), the trend in the last two decades of the twentieth century, ie, from 1980 onwards, was not doubled when comparing adjusted to raw data. cosmoswarrior/diehard/dieharder's claim to the contrary is indeed a gross error. Somebody who cannot acknowledge even that, and who continuously misrepresents the argument made against his claim to avoid doing so in not amenable to reason.
If they (and moonrabbit, on the assumption that is not just another sock puppet) cannot acknowledge even that gross error, or even correctly represent the argument against it, how on earth can they be expected to discuss reseanably the more subtle issues relating to the 1998-2012 trend (ie, the so called "hiatus").
[DB] Yes, this was just yet another tired, tepid sock puppet iteration of serial spammer cosmoswarrior.
landdownunder @413:
1) Tony Heller (aka Steven Goddard), producer of the www.realclimatescience.com website is not a climate scientist, former or otherwise. His qualifications are a Bachelors degree in Geology, and a Masters in Electrical Engineering. So far as I can determine, he has never published a peer reviewed paper of any description. He is well known as a serial misreprenter of data, a prime example of which is the gif which he produced, and you show.
2) Heller's giff does not demonstrate any significant change in values. Rather, it exhibits a change in the range of the y-axis from -0.6 to 0.8 for "NASA 2001" to approximately -0.85 to 1 for "NASA 2015". That represents a 32% increase and accounts for nearly all of the apparent change in trend - particlularly post 1980. An honest presentation of the data would have plotted both on the same axis, and ideally on one graph to allow direct comparison, like this:
(Source)
As can easily be seen, the temperature trend between 1980 and 2000 is nearly the same in all versions, and has certainly not doubled. In fact, the GIFF is doubling misleading. The 1998, 2000, 2012 and 2016 versions of the NASA GISS Meteorological Stations only temperature index are downloadable here (as also for the Land Ocean Temperature Index). the 1979-1998 trends are, respectively 0.184, 0.134, 0.169 and 0.177 oC/decade. You will notice that largest change is the 27.2% reduction in the trend from the 1998 to the 2000 version, followed by the 26.1% increase from 2000 to 2012.
Clearly the history of changes is not one sided, indicating the scientists concerned are following the data. Equally obvious is that Tony Heller has cherry picked an interval to show a rise in trend, even though the available history of adjustments results in a net reduction in the trend of the last two decades of the 20th century, not an increase.
Returning to cosmoswarrior's specific claim, a 32.1% increase in the trend (2000-2016) is not a doubling of the trend. Not even close, so even on your generous interpretation, that remains a gross error.
3) Unlike the AGW "skeptics", who focus on the facts of the changes without regard to the reasons, actual climate scientists focus on the reasons, which they detail in peer reviewed publications, and in the case of GISS, on site as well (see prior link). One main contributor to the change in trend from for the meteorological stations index has been the increase in the number of stations. The first version of GISS (1981) relied on just 1000 stations. That increased to 2200 in 1987, and to 7200 in 1999 (between the 1998 and 2000 versions). In 2005, a small number of stations in Antarctica were introduced, which was not a major increase in number, but very significant in improved coverage. Finally, in 2016 the number of stations jumped to 26000.
There have also been significant improvements in techniques, as detailed by GISS:
The merits of these changes in method can be argued, although they all seem like eminently reasonable improvements to me. But if you object to them, you have to make that argument. You cannot simply say that you do not like the result and therefore the methods are wrong - still less that they are fraudulent. The later, however, is the method employed charlatans like Tony Heller.
4) The involvement of politicians in challenging the adjustments is in no way evidence of the scientific invalidity or otherwise of the adjustments. It is evidence of where politicians think they can get political milage, either with there base or with their donors. Curiously, the second largest category of donors of Lamar Smith, who led the congressional inquisition on Karl et al, was from the Oil and Gas industry. Lamar Smith is not alone. In 2016, the Oil and Gas industry made political donations to the tune of $103 million dollars, 88% of which went to Republicans.
5) Finally, you quote Zeke Hausfather as saying:
and go on to suggest, "...is also consistent with cosmoswarrior's statement". However, cosmoswarrior's statement was explicitly about the last two decades of the 20th century (1981-2000), not the interval from 1998-2012 that Zeke Hausfather was talking about. His comment was, therefore, entirely irrelevant to cosmoswarrior's eggregiously false claim. More importantly, the 1998-2012 trend "roughly doubled" not because there was a large increase in the trend, but because the trend was low. The change in trend over that period was from 0.039 C per decade to 0.86 C/decade, a change of approximately half (63.5%) of one standard deviation of the error of the new trend as determined on the SKS trend calculator.
Following the logic of the advocates of the existence of a "hiatus", that is no change at all.
[PS] This excellent rebuttal of Goddard's nonsense stands. However, for those confused by its context, it was a response to yet another sockpuppet of comicwarrior et al which has been deleted. This denier's comprehension skills dont extend a comments policy let alone serious science so unfortunately I think Tom's points will have been lost on him/her completely. Other visitors might find this response useful however.
Tom:
It’s also worth noting that the land only temperature record from Berkeley Earth shows slightly more overall warming than NASA!
Data sources here and here.
I reviewed with interest the comments made to cosmoswarrior et. al. in comments 405-414. Tom Curtis points out in comment 406 that there is almost no difference between the raw and adjusted data from 1980-present for GNCNv3 data. Examining your plot, I would have to say I fully agree. Similarly, you showed plots of the new corrections, old corrections, and uncorrected NOAA temperature dataset in the figures in comment 409. Again, I would have to agree there is not much difference between three from about 1940 forward.
There is one statement you made, however, that needs correction. This is in comment 413(2) where you state:
Heller's giff does not demonstrate any significant change in values. Rather, it exhibits a change in the range of the y-axis from -0.6 to 0.8 for "NASA 2001" to approximately -0.85 to 1 for "NASA 2015". That represents a 32% increase and accounts for nearly all of the apparent change in trend - particlularly post 1980.
I downloaded this animated .gif file myself and extracted the individual images for 2001 and 2015. I then compared scales by copying and pasting the two axises from the 2015 image onto the 2001 image, and then sliding each axis from the 2015 image next to the corresponding axis of the 2001 image. It turned out that the horizontal axises of the two images were identical and the scale of the vertical 2015 image was slightly smaller than that of the 2001 image. Therefore, the actual slopes of the data plot for 2015 are slightly higher than what they appear in the plot image. I would have shown this image, but I am not sure how to do it just yet. While this data is not important for the points I want to make and carries no credibility with you, I thought I should point out the error since the topic came up recently.
From what you have pointed out in your most recent comments, it seems that you have debunked the myth about NOAA eliminating the "warming hiatus" in its paper of 2015. What happened was that we had a warming trend from about 1980 until 1998 when the warming rates were greatly reduced. We then continued on that level trend until 2015 when NOAA announced that they had shown with their "corrected" data that the warming hiatus never existed. Contrary to NOAA's claims, however, you pointed out that the corrected and uncorrected data are very nearly identical and therefore could not have eliminated the hiatus. This means, of course, that the hiatus not only existed back in 1998 but continues to this day.
So thanks for your inputs, Tom Curtis. You have been most helpful to us "climate contrarians" in making our case.
[DB] Pathological liar and sock puppet of serial spammer cosmoswarrior has recused himself from further participation here in this iteration.
[PS] Also someone that seems absolutely determined that deniers have no concept of logic, critical thought or comprehension when it comes to trying to defend a preconceived position.
(-snip-)
[DB] Serial sock puppet of serial spammer cosmoswarrior snipped. Please ignore this user.
RobJones @416, if you are going to accuse me of lying, it behoves you to use my actual words. I did not talk about a change in scale, but a change in the range of the y-axis. Specifically, I said:
Nearly all of the apparent change in trend post 1980 is a result of the warming trend continuing for another 14 years, a fact obscured by Heller's method of presentation. This is evident when you simply overlay the data as in the graph I showed. By changing the range of the y-axis between graphs, Heller creates an optical illusion, without which his case falls to pieces.
As it happens, Heller's scales are also not identical, as is shown by your graph, and as I have independently confirmed. This can be seen by noting that the decimal points of the two graphs are aligned at 0.2 on the y-axis, but not aligned at 0.8. Thus, you have conveniently demonstrated that Heller also changed the scale. The effect, however, is minor and works against his preferred indoctrination, and so can be ignored.
Continuing on, you write:
First, thank you for confirming that your current account is a sock puppet by referring to your prior talk about doubling. I note that you talked about a doubling of the trend in the last decades of the 20th century, and clearly there is no doubling of between the lowest and the highest trends among different GISS versions as shown in the graph I show.
Second, the specific changes in methodology detailed @413 are applied across the entire century. More importantly, when additional stations are added, they can have data across any period of the record. Consequently, on both accounts we would expect revisions going as far back as 1880. Once again, if you have a problem with the methods, criticize them.
Finally, I note your hypocrissy in being shocked that I should accuse Heller of lying (even though I didn't); while hapilly defending Heller whose whole career in climate science has been based on claims that climate scientists are lying; a claim you appear to make in your following post ("field of study isn't already riddled with corruption").
Serial Sockpuppet (of #416) seems to take very personally the criticism of Mr Heller.
The graphs he alludes to, both demonstrate a skyrocketing of global temperature during the past 2 decades.
— So what on Earth is the point he is trying to make, other than a pointless persistent peevishness?
The world is heating up rapidly: regardless of deniers.
(Moderator, please abridge or delete my post, at need.)
Tom Curtis — Your ineptness with these graphs never ceases to amaze me. Take another look at the figure below before you delete it again.
Notice that the tick marks of the two horizontal axises align perfectly with each other as I showed with the short green lines connecting them. Similarly, the tick marks of the pair of vertical axises also align perfectly. Therefore, the scaling of both the horizontal and vertical dimensions of the two plots are identical. The reason the decimal points may not align as well has to do with the different font sizes of the plot labels, and NOT the data or scaling. Therefore, Tony Heller's plots and animated .gif file still stand as a fair presentation of how the 2015 "corrections" rewrote temperature data since 1880.
What happened in the case of this figure is a prime example of your long history of deleting my comments, giving your faulty understanding of what I said, and then trying to discredit me on the basis of your spin on the story instead of what I actually said. Can we say "strawman tactics"?
At this point, it is quite clear to me that you are either totally incompetent or intentionally deceptive in your position, and in either case, for me to have any sort of intelligent discussion with you is simply not possible.
BTW, I saved screen snapshots of my postings before you and any "moderators" had a chance to remove them. Therefore, if "push comes to shove", it won't be just your word against mine as to what was said.
[PS] TC is not a moderator. Posts removed because sockpuppet of someone who cannot comprehend comment policy and let alone the science.
If you wanted to discuss science (which you are apparently incapable) then you needed have heeded the comments policy. No exceptions and no further chances.
[DB] Posting rights rescinded due to boringly iterative sock puppetry.
The hangup that SkepticalScience.com has in regard to temperature data is that you are exclusively using datasets at least as current as 2015, all of which are tainted by the 2015 adjustments. No wonder you make statements such as
"It is very clear that use of the new data sets make almost no difference to the trend."
If you want to do a fair assessment of the impact that the 2015 corrections had on the historical temperature data, you must dig up those archived datasets recorded before 2015. Otherwise, you just go around in circles claiming that the warming hiatus is over or never was while the corrections "make almost no difference to the trend". Well, if the corrections make no significant difference in the trend, and the current trend is hiatus, then wouldn't we still be in hiatus?
[PS] Removed pending moderation investigation.
[DB] Posting rights rescinded due to flagrant sock puppetry.
Eclectic — As I explained in a previous post, which SkepticalScience took down, I checked on Heller's sources and scaling of his graphs, and it turns out that his presentations stand up to scrutiny whereas the those from SkepticalScience don't even make sense. That's why I have defended Heller in his work. There is nothing personal about it.
[PS] Removed while account investigated.
[DB] Iterative sock puppet (number 11) of serial spammer cosmoswarrior has been removed from further participation in this venue. As will all of your future such. It might profit you better to seek a more amenable village to infest.
Moving on to a more sensible discussion. Surely the instability in the reconstructed temperature record is a legitimate cause for concern? Ole Homlums has published a lot of data on the adjustments and seems to come to the reasonable conclusion that:
"Based on the above [detailed charts of changes over time ] it is not possible to conclude which of the above five databases represents the best estimate on global temperature variations. The answer to this question remains elusive. All five databases are the result of much painstaking work, and they all represent admirable attempts towards establishing an estimate of recent global temperature changes. At the same time it should however be noted, that a temperature record which keeps on changing the past hardly can qualify as being correct. With this in mind, it is interesting that none of the global temperature records shown above are characterised by high temporal stability. Presumably this illustrates how difficult it is to calculate a meaningful global average temperature. A re-read of Essex et al. 2006 might be worthwhile. In addition to this, surface air temperature remains a poor indicator of global climate heat changes, as air has relatively little mass associated with it. Ocean heat changes are the dominant factor for global heat changes."
Source (http://www.climate4you.com)
[DB] "Surely the instability in the reconstructed temperature record is a legitimate cause for concern"
You document no instability, so you posit a strawman. Further, Humlum's nonsense has been debunked in this venue before (here and here, notably), so if you wish to address anything from him, take it to one of those threads. Not here. Further, no matter where you place comments at Skeptical Science, the Burden of Proof is on you to bring credible evidence to support your claims.
Further, your supposed quote is actually from here.
Hi DB: I apologise for not adding the final extension to the link. However now you have added the correct link, other users can see Humlums extensive analysis of administrative changes in all the major data series. This hardly constitutes a straw man. And how does making a generic attack on "Humlum's nonsense" contribute to this debate? I have cited his extensive charts on instability in the reconstructed temperature data and you respond with two completely unrelated points made on other data presented by humlum. Do your sites standards on "ad-hominem" and provision of proof apply to moderators? If not I'm probably wasting my time.
[TD] Tom Curtis's comment is educational. Also Zeke's post.
[JH] Moderation complaint snipped.
Mark:
The point is that Humlum has no credibility as a witness.
Er, MIke, not Mark. Sorry.