


 Arguments


Are surface temperature records reliable?
What the science says...
| Select a level... |
 Basic
Basic
|
 Intermediate
|
 Advanced
| ||||
|
The warming trend is the same in rural and urban areas, measured by thermometers and satellites, and by natural thermometers. |
|||||||
Climate Myth...
Temp record is unreliable
"We found [U.S. weather] stations located next to the exhaust fans of air conditioning units, surrounded by asphalt parking lots and roads, on blistering-hot rooftops, and near sidewalks and buildings that absorb and radiate heat. We found 68 stations located at wastewater treatment plants, where the process of waste digestion causes temperatures to be higher than in surrounding areas.
In fact, we found that 89 percent of the stations – nearly 9 of every 10 – fail to meet the National Weather Service’s own siting requirements that stations must be 30 meters (about 100 feet) or more away from an artificial heating or radiating/reflecting heat source." (Watts 2009)
At a glance
It's important to understand one thing above all: the vast majority of climate change denialism does not occur in the world of science, but on the internet. Specifically in the blog-world: anyone can blog or have a social media account and say whatever they want to say. And they do. We all saw plenty of that during the Covid-19 pandemic, seemingly offering an open invitation to step up and proclaim, "I know better than all those scientists!"
A few years ago in the USA, an online project was launched with its participants taking photos of some American weather stations. The idea behind it was to draw attention to stations thought to be badly-sited for the purpose of recording temperature. The logic behind this, they thought, was that if temperature records from a number of U.S. sites could be discredited, then global warming could be declared a hoax. Never mind that the U.S. is a relatively small portion of the Earth;s surface. And what about all the other indicators pointing firmly at warming? Huge reductions in sea ice, poleward migrations of many species, retreating glaciers, rising seas - that sort of thing. None of these things apparently mattered if part of the picture could be shown to be flawed.
But they forgot one thing. Professional climate scientists already knew a great deal about things that can cause outliers in temperature datasets. One example will suffice. When compiling temperature records, NASA's Goddard Institute for Space Studies goes to great pains to remove any possible influence from things like the urban heat island effect. That effect describes the fact that densely built-up parts of cities are likely to be a bit warmer due to all of that human activity.
How they do this is to take the urban temperature trends and compare them to the rural trends of the surrounding countryside. They then adjust the urban trend so it matches the rural trend – thereby removing that urban effect. This is not 'tampering' with data: it's a tried and tested method of removing local outliers from regional trends to get more realistic results.
As this methodology was being developed, some findings were surprising at first glance. Often, excess urban warming was small in amount. Even more surprisingly, a significant number of urban trends were cooler relative to their country surroundings. But that's because weather stations are often sited in relatively cool areas within a city, such as parks.
Finally, there have been independent analyses of global temperature datasets that had very similar results to NASA. 'Berkeley Earth Surface Temperatures' study (BEST) is a well-known example and was carried out at the University of California, starting in 2010. The physicist who initiated that study was formerly a climate change skeptic. Not so much now!
Please use this form to provide feedback about this new "At a glance" section, which was updated on May 27, 2023 to improve its readability. Read a more technical version below or dig deeper via the tabs above!
Further details
Temperature data are essential for predicting the weather and recording climate trends. So organisations like the U.S. National Weather Service, and indeed every national weather service around the world, require temperatures to be measured as accurately as possible. To understand climate change we also need to be sure we can trust historical measurements.
Surface temperature measurements are collected from more than 30,000 stations around the world (Rennie et al. 2014). About 7000 of these have long, consistent monthly records. As technology gets better, stations are updated with newer equipment. When equipment is updated or stations are moved, the new data is compared to the old record to be sure measurements are consistent over time.
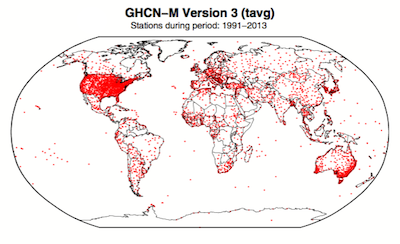
Figure 1. Station locations with at least 1 month of data in the monthly Global Historical Climatology Network (GHCN-M). This set of 7280 stations are used in the global land surface databank. (Rennie et al. 2014)
In 2009 allegations were made in the blogosphere that weather stations placed in what some thought to be 'poor' locations could make the temperature record unreliable (and therefore, in certain minds, global warming would be shown to be a flawed concept). Scientists at the National Climatic Data Center took those allegations very seriously. They undertook a careful study of the possible problem and published the results in 2010. The paper, "On the reliability of the U.S. surface temperature record" (Menne et al. 2010), had an interesting conclusion. The temperatures from stations that the self-appointed critics claimed were "poorly sited" actually showed slightly cooler maximum daily temperatures compared to the average.
Around the same time, a physicist who was originally hostile to the concept of anthropogenic global warming, Dr. Richard Muller, decided to do his own temperature analysis. This proposal was loudly cheered in certain sections of the blogosphere where it was assumed the work would, wait for it, disprove global warming.
To undertake the work, Muller organized a group called Berkeley Earth to do an independent study (Berkeley Earth Surface Temperature study or BEST) of the temperature record. They specifically wanted to answer the question, “is the temperature rise on land improperly affected by the four key biases (station quality, homogenization, urban heat island, and station selection)?" The BEST project had the goal of merging all of the world’s temperature data sets into a common data set. It was a huge challenge.
Their eventual conclusions, after much hard analytical toil, were as follows:
1) The accuracy of the land surface temperature record was confirmed;
2) The BEST study used more data than previous studies but came to essentially the same conclusion;
3) The influence of the urban stations on the global record is very small and, if present at all, is biased on the cool side.
Muller commented: “I was not expecting this, but as a scientist, I feel it is my duty to let the evidence change my mind.” On that, certain parts of the blogosphere went into a state of meltdown. The lesson to be learned from such goings on is, “be careful what you wish for”. Presuming that improving temperature records will remove or significantly lower the global warming signal is not the wisest of things to do.
The BEST conclusions about the urban heat effect were nicely explained by our late colleague, Andy Skuce, in a post here at Skeptical Science in 2011. Figure 2 shows BEST plotted against several other major global temperature datasets. There may be some disagreement between individual datasets, especially towards the start of the record in the 19th Century, but the trends are all unequivocally the same.
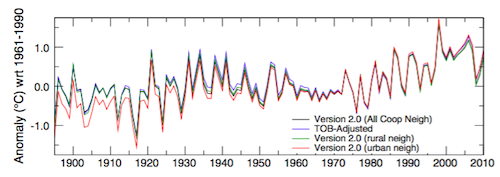
Figure 2. Comparison of spatially gridded minimum temperatures for U.S. Historical Climatology Network (USHCN) data adjusted for time-of-day (TOB) only, and selected for rural or urban neighborhoods after homogenization to remove biases. (Hausfather et al. 2013)
Finally, temperatures measured on land are only one part of understanding the climate. We track many indicators of climate change to get the big picture. All indicators point to the same conclusion: the global temperature is increasing.
See also
Understanding adjustments to temperature data, Zeke Hausfather
Explainer: How data adjustments affect global temperature records, Zeke Hausfather
Time-of-observation Bias, John Hartz
Check original data
All the Berkeley Earth data and analyses are available online at http://berkeleyearth.org/data/.
Plot your own temperature trends with Kevin's calculator.
Or plot the differences with rural, urban, or selected regions with another calculator by Kevin.
NASA GISS Surface Temperature Analysis (GISSTEMP) describes how NASA handles the urban heat effect and links to current data.
NOAA Global Historical Climate Network (GHCN) Daily. GHCN-Daily contains records from over 100,000 stations in 180 countries and territories.
Last updated on 27 May 2023 by John Mason. View Archives


Mike... It should be noted that most of the regulars here are very familiar with Humlum's work. He really isn't credible. On this topic in particular he's presenting a rather absurd notion. Yes, all the various data sets show different figures, but they only vary in a minimal way, and the differences between them certainly don't invalidate them in any way.
To the question, "Is global mean temperature rising?" there can be no doubt. All the data sets say yes. We get that from all the surface station data and from all the satellite data. The variances between them are merely a function of how each group processes their data.
It's interesting that Humlum states that ocean data is the better indicator, and he's right. And when you look at ocean heat content you get the exact same answer. The climate system is accumulating heat.
Thanks for the measured response Rob. My question was a serious one - my reading of Humlums data on this narrow point is not that there is any doubt about the fact of warming, but the data revisions - especially those before the satellite record - would seem to create some uncertainty around the long term rate of the warming.
Mike Evershed @427.
For anyone who takes the time to examine Humlum's work, it is evident the man is a prolific source of nonsense and that he does not take any rebuttal seriously because he doesn't care. Note his Figure 3 on the web-page providing your primary quote - it is addressed in this SkS rebuttal here but in response Figure 3 has not been properly corrected by Humlum. Rather, now we find his Figure 3 is simply "not showing the post Little Ice Age temperature increase."
The logic of the Humlum quote you present @422 is making three assertions. Firstly that it is difficult to create "a meaningful global average temperature" and while the word "meaningful" is a bit odd, it is correct to say that it is not a trivial task to create a global surface temperature record. But, as shown in the links @423Response, this work has been done.
Secondly, Humlum references Essex et al (2006). Yet Humlum does not set out in any way what it is in this paper he is referring to. He says it is "an interesting discussion of the whole concept of calculating an average global temperature" and that "a re-read of Essex et al. 2006 might be worthwhile." The reference by Humlum is thus nonsense.
Thirdly, Humlum argues that OHC is a better measure of global temperature which all would agree is true.
So, stripped of its nonsense, Humlum's quote is not supporting your suggestion that there is "some uncertainty around the long term rate of the warming," that is uncertainty beyond that declared within the work that created them.
"but the data revisions - especially those before the satellite record - would seem to create some uncertainty around the long term rate of the warming."
I dont get the logic here. Does cleaning the lenses on your camera increase the noise in the image? The "revisions" are results of in depth, peer reviewed methodologies to put station records onto a common basis which reduces the uncertainty, not increases it.
I find your faith in the satellite data unwarrented too. See this myth for which has the greater uncertainty. Let me ask this, how much of Humlum stuff do we need to debunk for you before you write it off as misleading (to be polite)? 10, 20? or will you keep looking through that and other pseudo-skeptic sources in hope of finding better news?
"Thirdly, Humlum argues that OHC is a better measure of global temperature which all would agree is true"
I am guessing Humlum support for OHC was at same time as Peikle was pumping it, believing it would show less warming. Wonder if he still as enthusiastic? Peikle went very quiet about it. OHC is a good measure of energy imbalance - and the data set is considerably less noisy than surface temperature. However, the surface temperature for all of its noise and measuring issues is about where we actually live.
Hi Scaddenp (re post 429) sorry for the delay (unfortunately I'm still working). The uncertainty arises from the issue whether the adjusted baseline temmperature data for (say) 100 years ago is reliable. With modern data we have a much better chance of making resaonable adjustments (we've still got the equipment, we can be more certain of field conditions etc). But adjustments to very old data by their nature must be more uncertain. And the correct analogy is not "cleaning the lenses on your camera" but "touching up your picture to show what you believe it would have shown had the camera lens not been dirty". That is a much more uncertain business.
[TD] In addition to the two links I gave you earlier, see the post by Scott Johnson. And a post by Dana. Tom Curtis informed you that many of the "adjustments" are not to individual records, but to the indices by adding vastly more stations. That type of adjustment does not rely on any of the factors you now are complaining about. As Scaddenp requested, be specific in your questions and objections, responding specifically to the info people are providing you with. They are responding specifically to your specific claims, and you must return the favor. Else you are merely sloganeering, which is not welcome on this site.
Okay, noone is doubting that error bars on temperatures increase the further back you go - I hope you have seen the intermediate and advanced tab - but that does not really give you much uncertainty in the warming trend. Furthermore, cleaning reduces the errors. And frankly, it is cleaning the lens. There is no pre-conceived believe in the what unadjusted temperature should look like. The methodologies for sharpening the record are very well documented. Which corrections or methodology do you believe would bias the corrections one way or other, and why? No hand-wavy answers please.
Let me be a little more specific. If, over time, a station changes the Time of Day for reading, this produces a well documented change to the temperature average. Given that there is a well researched methodology for correcting a temperature measured with one ToD to another basis, which is going to be the more reliable dataset - the uncorrected station record with different countries using different practises in different periods? Or the one with every station corrected to the same basis? Likewise, some stations become surrounded by urban areas with again, a well-documented increase in temperature from the urban effect not a climatological one. Is the record with an uncorrected mix of rural and urban stations, a more certain estimate of climate than one in which the urban effect has been removed by cross-pairing with rural stations?
Mie Evershod,
Are you aware that the adustments of the old records have resulted in a substantial lowering of the amount of warming measured? Any uncertaity introduced by the adustments have to be in the direction of increased warming, not decreased warming. That means the problem would be greater than determined using the adjusted data. Humlum and others claim that they do not trust the adjustments but then refuse to use the unadjusted data for analysis because it shows a greater problem. That is contradictory and hypocritical.
The unadjusted data are still available for use by anyone who wants to use bad data. (link to Guardian article comparing adjusted and unadjusted data). If you do not trust the adjustments go for it with the old data.
Thanks to moderator TD, Scaddenp, and Michael Sweet for replies. I have looked up moderator TD's references. But the problem I have is not whether individual adjustments, or homogenisation techniques are reasonable. Nor do I worry that there has been fraud on the part of climate scientists (though I suppose that is possible - scientists being human). Nor do i think that reverting to raw data would be better. My point as someone who is scientifically trained is that the more adjustments we make and the more data transformations we perform the greater the risk we run of making errors. Also, and more seriously, the more choices we make about which adjustments to apply, and how to apply them, we increase the risk of something called "confirmation bias". (The basic idea of confirmation bias is well known and adequately described in wikipedia - so I hope I may be excused providing a reference). So for me the most important point made in the replies is Michael Sweet's: i.e. that the adjustments of the old records have resulted in "a substantial lowering of the amount of warming." Does anyone reading this know where I can find the published scientific data on this - particularly in the surface air temperature? I have seen claims made both ways: leaving Humlim aside I have also seen this: https://wattsupwiththat.com/2016/04/24/updated-do-the-adjustments-to-land-surface-temperature-data-increase-the-reported-global-warming-rate/
[TD] You have been pointed to graphs of raw versus adjusted temperatures multiple times and claim to have read them, yet now ask for a pointer to that information.
Mike Evershed @435, your comment exhibits a gross misunderstanding. The various versions of GISTEMP LOTI (for example) do not apply additional adjustments on to already adjusted data. Rather, they apply refined versions of existing adjustments to the raw data. A classic example of this is the switch from switch to using night light data to determine urban areas inorder to apply the Urban Heat Island (UHI) adjustment.
If you adjust for the UHI using one method, and then start adjusting it by another method, there is no a priori reason to think that the second method will be worse than the former method. Indeed, given that the second method is based on improved statistical analyses of the effect, or improved subsidiary data (eg, night lights), it is likely that the second method will improve on the first.
Your further assumption that any adjustment will probably be worse than data known to be contaminated by extraneous effects (time of observation, station moves, etc) is also (to put it very kindly) dubious.
Finally, I am interested in your opinion of orbital decay adjustments to satellite temperature data. Is it your opinion that satellite temperature products should just show the unadjusted data as per the top panel of the following graph?

And if not, how are we to believe you objections to adjustments to the surface temperature data are principled rather than opportunistic?
Mike @435... I'd suggest taking everything at WUWT with a large dose of salt. Anthony's only litmus test for posting articles on his site is whether he thinks it casts doubt on climate science, without any for validation or review of the materials. You really have to dig in to anything you read on that site. (And that's not to say you shouldn't dig in to materials posted here, but SkS takes on more of a review process behind the scenes for the articles posted here.)
And, relative to the Bob Tisdale article you referenced...
1) I congradulate you if you can actually get through reading an entire Tisdale article. He's a borish and convoluted writer, at best. Great reading if your purpose is putting yourself to sleep.
2) Most of the charts he's presenting actually support the fact that, for the modern era (post-1960), adjustments do not have a substantive effect on the conclusions of the land data.
3) The bigger challenges are with older sea surface data where methods of collecting the data changed over time. Those adjustments have resulted in lowering the long term temperature trend relative to raw data.
4) I definitely do not understand your rationale on confirmation bias. There are multiple groups processing the data and they're, essentially, ending with results that are in agreement. If there were a significant bias being introduced you'd expect that to be evident across multiple groups. The idea that all the groups could have the same bias, even though they're using different methods, seems extremely unlikely.
Rob Honeycutt @438,
Additional to your points gleened from "borish Bob Tisdale," it should be mentioned that the adjusted global land surface air temperature anomalies over their full record do result in increased linear trends relative to their 'raw data' trends but only when calculated over the full record (Bob's figure 1) and importantly all these adjustments that are global in land coverage (note CRUTem4 is a long way from global in land coverage and Bob Tisdale likely misrepresents the raw data it uses); these global land records provide adjusted results that are consistent. Given the adjustment methods are so different, that they give consistent result suggests Mike Evershod's specific worry about errors ("the more adjustments we make and the more data transformations we perform the greater the risk we run of making errors") is unfounded.
Zeke Hausfather, one of the scientists on the Berkely Earth Surface Temperature (funded by the Koch brothers) wrote a detailed discussion of corrections on Carbon Brief. I like his writings since he is obviously very familiar with the data since he publishes on it, he works for skeptics so it is difficult to see him as part of a conspiracy on AGW and his articles are easy to read. You can Google his publications to get peer reviewed discussions of corrections.
Others will give you better references than me so I will probably not post again. Read less "skeptical" material if you want to be informed, WUWT is especially bad.
MIke Evershed @ 435: "My point as someone who is scientifically trained is that the more adjustments we make and the more data transformations we perform the greater the risk we run of making errors."
Well, the way to deal with that scientifically is to read the papers that describe the adjustments and transformations, and why they were done the way that they were, and what evidence was presented to support their use.
If you discover a questionable adjustment, and can demonstrate that a different - and equally reasonable - alternate approach provides a significantly different output that affects the conclusions, then point it out. If all you have is "there might be an error, but I don't know where", then all you have is an argument from incredulity. A "greater risk" of making an error does not meant that there is one. (Note: "making an error" is not the same thing as "not everything is known". Knowledge is always incomplete.)
...and anything I've seen presented at WUWT or similar "skeptic" blogs fails the "and equally reasonable" test, because they invariably involve explanations that require overthrowing major fundamentals of physics, cherry-picked data, improper statistical analysis, flawed logic, etc. There is your source of errors.
Mike, call me completely unconvinced. We use a number of very complex instruments. Over the years, both accuracy and precision have improved even though the fundimental measurement has not. This is due to ever increasing complexity of processing and correction between raw detection and reported result.
Modern seismic processing has also become increasingly complex. Talk about torturing the data. Dont tell an oil explorer that the uncertainty in the depth to a reflector has increased because all that fancy processing makes errors more likely. Funnily enough scientists actually test this stuff and publish the methodology for everyone to examine.
On the other side, faced with an unappealing set of data, instead of finding fault with the methodology and publishing alternatives, all we find is dark mutterings about scientists motives and accusation of manipulating the data, which shows a laughable ignorance about science, scientists and science funding. Since UHI and SST adjustment corrections (the biggest adjustment to the global surface temperature recored) reduce the warming trend, if scientists are trying to defraud the public, they are making a rotten job of it.
The graphs on the advanced tab also show that adjustments are tiny compared to trend. Are you actually seriously suggesting there is a chance that surface temperatures are not actually warming? Ice melt and sea level rise are also somehow an artifact?
I am grateful for the thoughtful responses of site participants (posts 436 to 442). Michael Sweets reference to Zeke Hausfather's article was particularly helpful and I'm beginning to see some light at the end of the tunnel. It looks as though the "denialist" sites are mostly referencing either the land surface air temperature data where revisions to older data do increase the warming trend (but only moderately so) or the modern period adjustments where again they increase the trend (but only slightly so), while sites supporting the consensus focus on the either the sea surface record or the overall record including sea surface temperatures where the adjustments reduce the long term warming trend (and significantly so). As to the questions I have been asked - I don't dispute the climate is warming and I don't think the data adjustments represent fraud - but I am trying to get a handle on how reliable the consensus view is, and on this thread how reliable the warming data is. As to my concern about confirmation bias, I agree that the existence of different groups working on the data problems reduces the risk, however as all of them subscribe to the consensus view, and defend the anthropogenic warming hypothesis the risk of confirmation bias cannot be totally discounted.
To quote an expert in the field: "A great deal of empirical evidence supports the idea that the confirmation bias is extensive and strong and that it appears in many guises. The evidence also supports the view that onceone has taken a position on an issue, one's primary purpose becomes that of defending or justifying that position. This is to say that regardless of whether one's treatment of evidence was evenhanded before the stand was taken, it can become highly biased afterward." http://psy2.ucsd.edu/~mckenzie/nickersonConfirmationBias.pdf. Nickersons discussion of confirmation bias in science at the end is particularly interesting - including the observation that the strength of science lies in vigorous challenge to hypotheses.
[TD] People who are interested in global temperature look at the temperature of the globe. The whole globe. Land and water. Because that is the definition of "global."
"however as all of them subscribe to the consensus view"
Um, this isnt politics. You arrive at a consensus you dont start with one. Also BEST was started by Muller as was skeptical of the record with Koch funding. Anthony Watts said “prepared to accept whatever result they produce, even if it proves my premise wrong.” That was until it confirmed the existing temperature records. So definitely not "all of them".
It is also extremely hard to understand quite point you are trying to make. It feels like a fairly desparate attempt to find a reason to be doubtful of the temperature record with no actual basis at all. Do you comment on JPL sites about the dark side of the consensus on gravity might result in satellites off course? Or complain that maybe it is okay to build houses on faultlines because after all the geological consensus on earthquakes might be subject to confirmation bias?
Mike Evershed @443.
Your quote concerns confirmation bias generally and is not specific to the scientific process. Nickerson (1998) 'Confirmation Bias: A Ubiquitous Phenomenon in Many Guises' does address things scientific (no mention of climatology) and a little more fully than he does witch-hunting. As I see this as off-topic, I will be brief.
The accounts given of Conservatism among scientists, Theory persistence, Overconfidence and Unity in science I would suggest apply to the AGW denialists rather than the AGW proponents. Science works hard to root out Confirmation Bias. I see no difficulty in taking on board an aberrant theory that would disprove AGW, but only if it has merit. AGW denialists cannot say the same for the science they attempt to overturn, science that does have merit. Yet they do have a role in science (but not in public), using their denialist viewpoint to rattle the cage, but in doing this they have failed to produce any aberrant theories that have any merit, so far.
Note that the examples given by Nickerson are about big issues that make-or break theories. (I should say here that I am not entirely happy with some of his accounts.) As the adjustments to global temperature series we discuss here do not lead to any make-or-break situations, I don't see there is a situation where confirmation bias would begin to operate. But looking from a denialist viewpoint, chipping away at the temperature record does assist the anti-AGW arguments, not least by spreading doubt over the entirety of all temperature records.
And further to my earlier comment, there is plenty of people out there with hostile views and, for fossil fuel companies where proposed climate action is a threat to shareholder value, the funds and scientific muscle to create their own homogenized temperature series. They could also challenge the papers that details the homogenization methods if they could find errors. The lack of any such papers would suggest that noone has found a real problem. I cant imagine Exxonmobile pushing a paper "the scientists were right" if they did such a study (and we know their scientists have looked). All we get is innuendo which sits fine for an audience with their own ideological biases seem to have shut down their critical faculties if they ever had them.
Confirmation bias. Of course there is always some risk of this, and its normal to look for evidence that supports an idea, but this doesn't dominate things. People are aware of the risk of confirmation bias, and contrary evidence will be thrust on people by other scientists wanting attention. Science has a habit of bringing all the evidence out in the open.
The point is the global land ocean temperature trend over the last 100 years has been adjusted down, and for sound reasons. This is strong evidence that confirmation bias has not corrupted the temperature data. I would suggest conclusive evidence for all practical purposes.
You would think this simple thing would end the debate on the issue, but no the denialists will rant on about it for decades and decades.
Thanks Guys. In view of the discussion above, I would agree that the global temperature record (sea and land) is the better measure, and because adjustments to the sea surface data rduce the long term growth trend and there are several groups working on the problem of past reconstruction, the risk of confirmation bias causing significant problems is small. That leaves the issue of "is the warming anthropogenic" (but that is for another thread and another time). Thanks especially for the courteous replies to what has been an attempt to genuinely explore the issue.
Sorry - should have added that I found the points about Berkley Earth starting from a sceptical position and the lower risk of confirmation bias around adjustments which are not theory breaking to be good ones.