


 Arguments


Are surface temperature records reliable?
What the science says...
| Select a level... |
 Basic
Basic
|
 Intermediate
|
 Advanced
| ||||
|
The warming trend is the same in rural and urban areas, measured by thermometers and satellites, and by natural thermometers. |
|||||||
Climate Myth...
Temp record is unreliable
"We found [U.S. weather] stations located next to the exhaust fans of air conditioning units, surrounded by asphalt parking lots and roads, on blistering-hot rooftops, and near sidewalks and buildings that absorb and radiate heat. We found 68 stations located at wastewater treatment plants, where the process of waste digestion causes temperatures to be higher than in surrounding areas.
In fact, we found that 89 percent of the stations – nearly 9 of every 10 – fail to meet the National Weather Service’s own siting requirements that stations must be 30 meters (about 100 feet) or more away from an artificial heating or radiating/reflecting heat source." (Watts 2009)
At a glance
It's important to understand one thing above all: the vast majority of climate change denialism does not occur in the world of science, but on the internet. Specifically in the blog-world: anyone can blog or have a social media account and say whatever they want to say. And they do. We all saw plenty of that during the Covid-19 pandemic, seemingly offering an open invitation to step up and proclaim, "I know better than all those scientists!"
A few years ago in the USA, an online project was launched with its participants taking photos of some American weather stations. The idea behind it was to draw attention to stations thought to be badly-sited for the purpose of recording temperature. The logic behind this, they thought, was that if temperature records from a number of U.S. sites could be discredited, then global warming could be declared a hoax. Never mind that the U.S. is a relatively small portion of the Earth;s surface. And what about all the other indicators pointing firmly at warming? Huge reductions in sea ice, poleward migrations of many species, retreating glaciers, rising seas - that sort of thing. None of these things apparently mattered if part of the picture could be shown to be flawed.
But they forgot one thing. Professional climate scientists already knew a great deal about things that can cause outliers in temperature datasets. One example will suffice. When compiling temperature records, NASA's Goddard Institute for Space Studies goes to great pains to remove any possible influence from things like the urban heat island effect. That effect describes the fact that densely built-up parts of cities are likely to be a bit warmer due to all of that human activity.
How they do this is to take the urban temperature trends and compare them to the rural trends of the surrounding countryside. They then adjust the urban trend so it matches the rural trend – thereby removing that urban effect. This is not 'tampering' with data: it's a tried and tested method of removing local outliers from regional trends to get more realistic results.
As this methodology was being developed, some findings were surprising at first glance. Often, excess urban warming was small in amount. Even more surprisingly, a significant number of urban trends were cooler relative to their country surroundings. But that's because weather stations are often sited in relatively cool areas within a city, such as parks.
Finally, there have been independent analyses of global temperature datasets that had very similar results to NASA. 'Berkeley Earth Surface Temperatures' study (BEST) is a well-known example and was carried out at the University of California, starting in 2010. The physicist who initiated that study was formerly a climate change skeptic. Not so much now!
Please use this form to provide feedback about this new "At a glance" section, which was updated on May 27, 2023 to improve its readability. Read a more technical version below or dig deeper via the tabs above!
Further details
Temperature data are essential for predicting the weather and recording climate trends. So organisations like the U.S. National Weather Service, and indeed every national weather service around the world, require temperatures to be measured as accurately as possible. To understand climate change we also need to be sure we can trust historical measurements.
Surface temperature measurements are collected from more than 30,000 stations around the world (Rennie et al. 2014). About 7000 of these have long, consistent monthly records. As technology gets better, stations are updated with newer equipment. When equipment is updated or stations are moved, the new data is compared to the old record to be sure measurements are consistent over time.
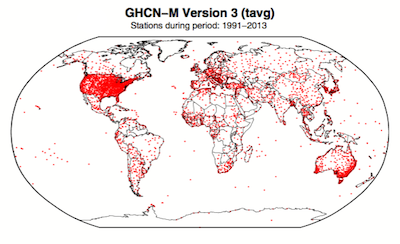
Figure 1. Station locations with at least 1 month of data in the monthly Global Historical Climatology Network (GHCN-M). This set of 7280 stations are used in the global land surface databank. (Rennie et al. 2014)
In 2009 allegations were made in the blogosphere that weather stations placed in what some thought to be 'poor' locations could make the temperature record unreliable (and therefore, in certain minds, global warming would be shown to be a flawed concept). Scientists at the National Climatic Data Center took those allegations very seriously. They undertook a careful study of the possible problem and published the results in 2010. The paper, "On the reliability of the U.S. surface temperature record" (Menne et al. 2010), had an interesting conclusion. The temperatures from stations that the self-appointed critics claimed were "poorly sited" actually showed slightly cooler maximum daily temperatures compared to the average.
Around the same time, a physicist who was originally hostile to the concept of anthropogenic global warming, Dr. Richard Muller, decided to do his own temperature analysis. This proposal was loudly cheered in certain sections of the blogosphere where it was assumed the work would, wait for it, disprove global warming.
To undertake the work, Muller organized a group called Berkeley Earth to do an independent study (Berkeley Earth Surface Temperature study or BEST) of the temperature record. They specifically wanted to answer the question, “is the temperature rise on land improperly affected by the four key biases (station quality, homogenization, urban heat island, and station selection)?" The BEST project had the goal of merging all of the world’s temperature data sets into a common data set. It was a huge challenge.
Their eventual conclusions, after much hard analytical toil, were as follows:
1) The accuracy of the land surface temperature record was confirmed;
2) The BEST study used more data than previous studies but came to essentially the same conclusion;
3) The influence of the urban stations on the global record is very small and, if present at all, is biased on the cool side.
Muller commented: “I was not expecting this, but as a scientist, I feel it is my duty to let the evidence change my mind.” On that, certain parts of the blogosphere went into a state of meltdown. The lesson to be learned from such goings on is, “be careful what you wish for”. Presuming that improving temperature records will remove or significantly lower the global warming signal is not the wisest of things to do.
The BEST conclusions about the urban heat effect were nicely explained by our late colleague, Andy Skuce, in a post here at Skeptical Science in 2011. Figure 2 shows BEST plotted against several other major global temperature datasets. There may be some disagreement between individual datasets, especially towards the start of the record in the 19th Century, but the trends are all unequivocally the same.
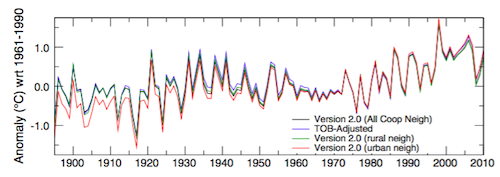
Figure 2. Comparison of spatially gridded minimum temperatures for U.S. Historical Climatology Network (USHCN) data adjusted for time-of-day (TOB) only, and selected for rural or urban neighborhoods after homogenization to remove biases. (Hausfather et al. 2013)
Finally, temperatures measured on land are only one part of understanding the climate. We track many indicators of climate change to get the big picture. All indicators point to the same conclusion: the global temperature is increasing.
See also
Understanding adjustments to temperature data, Zeke Hausfather
Explainer: How data adjustments affect global temperature records, Zeke Hausfather
Time-of-observation Bias, John Hartz
Check original data
All the Berkeley Earth data and analyses are available online at http://berkeleyearth.org/data/.
Plot your own temperature trends with Kevin's calculator.
Or plot the differences with rural, urban, or selected regions with another calculator by Kevin.
NASA GISS Surface Temperature Analysis (GISSTEMP) describes how NASA handles the urban heat effect and links to current data.
NOAA Global Historical Climate Network (GHCN) Daily. GHCN-Daily contains records from over 100,000 stations in 180 countries and territories.
Last updated on 27 May 2023 by John Mason. View Archives


Have a question. In 1981, Hansen published a paper which includes a mean average, the baseline global surface temp, of 288 Kelvin (14.85 degrees celsius or roughly 59 degrees Farenheit) for the years 1950-1980. He testified before Congress that 3 of the hottest years were in the 80s and also stated 59 degrees was the average from 1950-1980.
Jones stated 6 of the hottest years up that point were in the 80s and listed them in 1988 and also stated that the average from 1950-1980 was "roughly 59 degrees." Of course, in the 90s, same message of more hottest years and same with the 2000s.
However, we have not seen one single year since those comments and warnings were made where the average global surface temperature exceeded 59 degrees. Just hasn't happened.
So what's up with that?
[PS] Potentially response to this topic.
Randman @451, I have replied to you on this thread, because your concern seems to be more with the reliability/accuracy of surface temperature records, rather than with the ancient "predictions" made by Hansen last century.
And probably best if you stick with "standard degrees" instead of "Fahrenheit degrees" (Fahrenheit being rather 18th Century!) .
World temperature has risen approx 1.0 degrees since the pre-industrial age [the time of Fahrenheit himself!!!] . This rise is the average of local regional rises worldwide (this being far more useful and precise way of looking at the facts, rather than the vague/diffuse and somewhat unhelpful "world's average temperature").
Yes, the Arctic rise [i.e. local anomaly rise] is much higher than the "averaged" anomaly rise of 1.0 degrees — but it does not contribute much to the total anomaly, because the Arctic area is only a small fraction of total global surface area. Nevertheless, the Arctic rise is disproportionately highly important, because of its effect on ice-melting / ocean currents / Northern Hemisphere weather events / and feedback on global warming.
Randman, you will notice that the different organizations (such as NASA, and NOAA, and the Japanese Meteorological Organisation, etc) have a preference for comparing the very latest temperatures against a variety of baselines e.g. 1950-1980 or 1970-2000 or the full 20th Century etcetera. And this makes life unnecessarily complex for non-specialists [i.e. you and me].
But I am sure you appreciate, Randman, that whatever the baselines of of reference, the world is getting much warmer and doing it very quickly (whether things are expressed in degrees Celsius / Fahrenheit / Reaumur / or whatever). Whichever labels are used and whatever human yakking goes on . . . yet the real physical world shows strong evidence of rapid warming — wherever you look! Vasts amounts of polar ice are melting; sea levels are rising ever faster; glaciers are disappearing; and plants & animals are changing their activities accordingly.
To that extent, Hansen's various projections [scenarios] of future temperature are little more than of interest to historians. Yes, they're broadly far more accurate than those of science-deniers such as Lindzen . . . but nowadays we've had nearly 30 more years of experience in seeing the reality of the "Hockey Stick" rise in global temperatures. By whichever 30 / 50 / 100 year baseline you use, the recent years of 2014 / 2015 / 2016 / and so far in 2017, have been the hottest on record i.e since around 1880 (or by proxy measurement, the hottest in the past 2000+ years).
So, global warming is pressing ahead at high speed (in geological terms). And no sign of slowing down anytime in our near future.
btw, Randman, in your post you mentioned Hansen (who is famous enough in scientific circles to be referred to as just a single name — rather like Cher and Beyonce in pop music circles!). But who is the "Jones" you mention? Presumably not the Tom Jones of yesteryear!!
Eclectic @452,
Indeed, the missing Randman reference @451 would not be Tom but Phil Jones (no relation) who's phone interview became part of a 1989 NYT article titled "Global Warmth In '88 Is Found To Set a Record".
Eclectic, still learning to use this forum. Phil Jones (English pioneer of some note for global warming scenarious, etc,...) is the Jones I referred to, as someone else stated.
In an effort to simplify, will repeat myself a little. The consensus was that the mean from 1950-1980 was 15 degrees celsius. The prediction and warning had to do with rapid increases ABOVE 15 degrees celsius. That never happened and so no, I can't agree the planet has warmed.
No matter how many graphs, claims, adjustments, etc,.....that purport to show increases in mean global temps, unless there is a good, peer-reviewed series of papars, or at least published and discussed widely with skeptics not shouted down, it's unreasonable to accept as necessarily valid claims of warming.
Where's the beef here? I am open to why the mean from 1950-1980 was lowered retroactively from 15 degrees celsius to 14 degrees celsius but hope you can understand my skepticism. You have a group who forcefully argues a near doomsday scenario requiring massive global regulatory changes with very specific and bold predictions, and they don't happen. No years above the mean, and then the mean is lowered?
What is the basis for lowering the mean? The science behind it? Are there published papers dealing with that? Were skeptics allowed to offer pubished rebuttals? Or is this more a matter of faith?
Eclectic, concerning some other comments on evidence: take, for example, the claims of sea level rise. Frequently, sea levels rising in a location due to the land subsiding are credited to climate change such as the case of south Florida. But the truth is they are pumping the aquifier, have dammed up and filled in wetlands and so it's clear the sea has risen rather than the land subsiding, and yet flooding is credited to climate change.
On the other hand and this is anecdotal, there is a town built in the 1500s by the Portugese where the sea walls were precisely designed to flood once per month with the highest tide. There appears to be no rise or change in sea level there in several hundreds years. I know it's anecdotal but still. We have a hard physical record of no change.
In Florida, when I was a boy you could grow orange groves in north Florida. There is a town called Orange Park, in fact. In colonial times, you could grow oranges in South Carolina: hence a town called Orangeburg. Over the few hundred years, beginning long before industrialization, the freeze line has crept further south such that now orange groves freeze at those latitudes.
So yes, that is climate change but it's not evidnece of global warming (got colder, not warme). Nor is it evidence of industrialization and production of CO2 causing this.
During the MWP and Little Ice Age, we saw much more rapid climate change prior to industrialization. Jones finally admitted that the MWP could have been global. The proponents of AGW had handwaived the MWP away insisting it was just confined to the northern hemisphere.
Some of the glaciers that melted and presumably back to prior to man's settlements, actually showed settlements underneath. The truth is none of these things are unprecedented. Back in the 30s, there were numerous published reports of the arctic melting and warnings of sea level rise but it didn't happen. There were just some very warm years around that time.
So this claim of high speed climate change is simply incorrect. We've seen much higher change in human history already.
[JH] If your false statement about about Orangeburg, SC is indicative, your entire post may be nothing more than a fabrication.
From Wikepedia...
Meant to write, it's clear the sea is "not" rising. Don't see an edit button. Apologize for that.
Randman, I have to wonder what you use for sources. So far, the worst freezing impact event I have found for Florida citrus growers was the great freeze of 1894-95. There has not been an impact freeze event since 1989. The northern and central portion of the state saw some snow back in 2010. Snow is reported as far back as records exist, 1774. I'm quite skeptical of your Florida claims.
Philippe, not sure what you asking here. My comments are based on observation. It's a fact that you can't really grow oranges in the Jacksonville, FL are anymore, at least not commercially. I base that on having lived there, had an orange tree in the yard, noted how oranges don't grow or turn sour if grafted, and on the fact when I was a yojng boy travelling to Florida, there were tons of orange groves in areas that can't grow there now.
If you want, look up the zones for growing things, and you can see this for yourself. Orange groves had to move south. This shouldn't be a controversial comment as it's demonstrably true.
In colonial times, you could grow oranges in South Carolinal which is why a town was named Orangeburg.
If you want sources, google the towns of Orangeburg and Orange Park, and you can verify they do exist. You can also look up the times when orange groves would grow there if you'd like.
Here's a timeline of significant freezes.
"The *impact freeze that occurred on February 2-9 brought the lowest temperatures that had ever been recorded in north and central Florida. This freeze is considered an *impact freeze because it ended attempts to commercially grow citrus in South Georgia, southeast South Carolina and in the northern part of Florida."
http://flcitrusmutual.com/render.aspx?p=/industry-issues/weather/freeze_timeline.aspx
Note this comment elsewhere as well:
"he century preceding the damaging freeze of 1835 was relatively warm as evidenced by the fact that unprotected orange trees were grown and reached full size in South Carolina and Georgia (Attaway, 1997). Freezes that caused injury to citrus as far south as central and southern Florida occurred in 1835, 1857, 1894, 1895, 1962, 1981, 1982, 1983, 1985, and 1989. In Alabama during the first half of the 1900s (1900 to 1948), severe freezes that injured satsumas occurred in 1924, 1928, 1930, 1933, and 1940 (Winberg, 1948b)."
http://hortsci.ashspublications.org/content/43/2/287.full
This region grew colder, not warmer. Also note, there are different kinds of citrus. Satsuma, which the paper discusses, can withstand colder temps from what I understand.
randman @454.
You state "The consensus was that the mean from 1950-1980 was 15 degrees celsius." Where do you get this from?
All I see is a newspaper article from early 1989 (see link @452) that quotes PD Jones saying:-
While 59ºF = 15ºC, I don't see this statement in a newspaper article about a 1950-79 anomaly-base obtained as part of a telephone interview as constituting any sort of past "consensus."
If you calculate the average anomaly from today's HadCRUT4 for this period 1950-79, it comes out to -0.065ºC. And just to join all the dots up, the HadCRUT4 anomaly for 1988 is +0.199ºC, yielding a 1950-79-based 1988 anomaly of +0.264ºC. While this is significantly lower than the "0.612 degrees Fahrenheit" quoted in the article (= +0.34ºC), it must be born in mind that the coverage of global temperature data was still being developed back in the late 1980s as Jones (1988) rather well ilustrates.
MA Rodger, look it up if you don't believe me. Hansen's 1981 paper has the mean from 1950-1980 at 288 LINK
In 1988, he testified it was 59 degrees F. Same thing basically.
LINK
Jones also said it was 59 degrees which is the same as 15 degrees celsius.
Where are the papers to justify revising it MUCH LOWER to 14 degrees? Just looks very arbitrary to me and after the predictions of higher annual means over 15 degrees failed to materialize.
If you disagree, show me something from 1988 or earlier, meaning that was written and published then.
[RH] Shortened links.
[JH] The use of all caps constitutes shouting and is prohibited by the SkS Comments Policy. Please read this policy and adhere to it.
Randman, you have an interesting way of thinking.
On the basis of (A) one alleged sea wall in Portugal, and (B) whether oranges can be grown in northern Florida versus southern Florida . . . you entirely dismiss a century's accumulated evidence of substantial rapid global warming. (Including your handwaving away of the latest 4 decades of satellite evidence of ongoing accelerating sea level rise / spectacular attrition of glaciers / and the melting of thousands of cubic miles of ice.)
Quite marvellously amusing, Randman. Clearly you possess a peculiar & intense sense of humor.
Though in view of the seriousness of the global situation, your humor counts as black humor. Or is orange the new black?
Eclectic, can you just stick to the facts? You say there is all this evidence. I have been looking at the presentations of that "evidence" for 30 years and frankly, doesn't appear to be any evidence at all to speak of.
That's why I asked about the mean of 59 degrees, 15 degrees celsius. I was hoping someone here on a site dedicated, it appears, to discounting skeptic arguments of AGW, would be able to offer their explanation of why the mean was retroactively changed. Just read a few peer-review papers from the 80s which boldly talk of deviations from the mean in great detail. But noticeably absent is a discussion of the actual base-line. Seems like you have to search high and low for that.
Hansen's 1981 paper does include his baseline as well as various comments from he and Jones to the press and testimony before Congress.
But at some point, 15 became 14, and I can't find a single scientific paper explaining why that was. Now maybe you don't see the significance of that? But if the mean from 1950-1980 was 15 degrees celsius, we have seen no warming whatsoever in 30 years, and whatever else has happened could not have been caused by warming because it didn't happen.
So I ask again. What was the justification or reason for lowering the baseline from 15 degrees celsius to 14 degrees celsius. If you don't know, that's fine, but don't act like it's some kidn of crazy question.
Eclectic also, perhaps the point on oranges went over your head? We're talking around several hundred years of significant climate change for the Carolinas, Georgia and Florida where the region became colder, not warmer. This began long before industrialization and is a pretty significant climate change then that cannot be blamed on man causing it.
Particularly after the freeze of 1835, we saw a steady change pushing back commercial orange groves further and further south due to the region becoming colder, not warmer. That has yet to change, in fact.
Why is that if we are experiencing such unprecendented warming? What caused the climate change beginning in 1835 or actually earlier?
Randman: climatologists use anomalies instead of absolute temperatures, because the former can be estimated much more precisely. See the recent RealClimate post about that.
I am a little concerned about rebutting you on sea levels as not sure it's OK here to do that or not. But be that as it may, consider the following:
"The numbers didn’t add up. Even as Earth grew warmer and glaciers and ice sheets thawed, decades of satellite data seemed to show that the rate of sea-level rise was holding steady — or even declining.
Now, after puzzling over this discrepancy for years, scientists have identified its source: a problem with the calibration of a sensor on the first of several satellites launched to measure the height of the sea surface using radar. Adjusting the data to remove that error suggests that sea levels are indeed rising at faster rates each year."
http://www.nature.com/news/satellite-snafu-masked-true-sea-level-rise-for-decades-1.22312
1. The July 2017 report says the satellite data did not show sea level rise. My question to you is did you know that or were you led to believe prior to July that the satellite data showed sea levels rising? Be honest and ask yourself how that happened if "scientists" actually knew the data said something else.
2. Note the solution of adjusting the data. (Note to mods: this is why I think responding on this is appropriate on this thread because we are discussing the trustworthiness and reliability of data.)
If "adjusting the data" were just a one-off thing, this would appear unobjectionable perhaps. Would have to look at the technicals on the sensor stuff, but this seems like part of a pattern. Baseline in the 80s was 15 degrees celsius and then that's "adjusted" to 14 degrees which just happens then to show warming.
You don't find that suspicious, especially in light of the recent paper questioning such "adjustments" along with many scientists also questioning the adjustments with some of them having been much more pro-AGW.
I think there is an issue here and should be looked into. Are we merely being sold a story based on adjusting data to fit a narrative?
Tom, I understand that but anomalies are based on differences from a baseline. So the mean is critical to whether warming or cooling or nothing much has occured. If you just change the prior baseline one whole degree celsius from 15 to 14, the picture of recent anomalies greatly changes, right? But unless that change is accurate, that picture of anomalies means very little in terms of reality.
No, randman. You are confusing terms and concepts. "Baseline" used for computing an anomaly for one particular temperature station is the average temperature across the baseline period as measured at just that one particular station. The same is done for each of the other stations. The anomaly in each geographic grid cell is the average of those anomalies. The global anomaly is the average of those grid anomalies. Never in that process is the global absolute temperature computed. I was confused by your use of the term "baseline" To mean global absolute temperature.
Ok, let's use the term "mean" as Hansen does here when he says the mean surface termperature is 288k.
LINK
How is it in the 80s, the consensus, it appears, is the mean from 1950-1980 was roughly 15 degrees celsius, and then later that was changed to 14 degrees celsius? What the mean "for one particular station" isn't what we're discussing but changing the mean from a 30 year period from 15 to 14, which of course shows a very different picture in terms of anamolies, right?
When you read these papers with graphs showing such and such anomaly, they are discussing more than one weather station with a baseline which is 0. That's why I used the term, baseline.
[RH] Shortened link.
Tom reading your comment again and more closely, the thought comes to mind then that the only way to lower the global mean is to say the temperature readings in the past which previously said such and such, were changed, right?
Otherwise, there'd be no revision lower from 15 to 14. If the 15 degrees was based on an average of temp readings, and of course looking at the different regional placement of such weather stations and distances, well if you assume they used decent basic analysis in the 80s for the data, how in the world did the data change?
Randman @466 , your referenced Nature news article (itself citing Dieng, Cazenave, Meyssignac & Ablain 2017, in Geophysical Research Letters) confirms an accelerated rising sea level globally. The satellite data is also in accord with the longstanding worldwide tidal gauge data.
And yet you come out with your complete fantasy that the observed long-term sea level rise worldwide has halted or even reversed [which would require 100's of cubic miles of "re-freezing" to occur in quick order — and something of which there is zero evidence . . . except perhaps in Secret Government Mega-Freezers buried under the Florida swamps & guarded by gators].
Do you not understand that the world's ice is melting because conditions are getting warmer? And that the melting is happening — regardless of the presence of any calibrated thermometer within a 10,000 mile radius.
In effect, Randman, you are stating that all the well-correlated data globally has been manipulated in a century of Giant Worldwide Conspiracy. More black humor from you, Randman?
Eclectic, why don't you discuss the questions and facts I posed to you? I think they are very clear. The paper states the satellite data did not show sea level rise, right? That just this July they found a "solution" that would show it by adjusting the data.
Now, how long have you believed the satellite data showed sea level rise? Since late July or earlier? Please answer the question.
Randman, your answer is in the RealClimate post I linked for you. Actually read it this time, please.
Tom, come on. Let's talk honestly. Of course I get the concept of looking at the changes rather than absolute data (although the absolute data should be shown, imho).
The issue is they were doing that when they said the data showed 15 degrees was the mean over the time period from 1950-1980.
Do you get that?
Why was the mean subsequently adjusted to 14 degrees celsius? If you look at the data based on the prior mean, aggregated I assume from many data points, then we have had no warming. It's pretty simple. There's no way looking at the changes can make 14 degrees equal 15 degrees, right?
There wasn't new data for "reanlysis" as far as I can tell that applied to the period prior to 1979. What you have are assumptions or hopes or professional stances linked to one's career that call for reinterpreting very basic data. The readings people took did not change.
Randman, you are missing the part of that post that answers your question. It explains and demonstrates the large variability in estimates of absolute temperature. Whichever estimate of absolute temperature from the 1980s that you are fixated on was not the only estimate then and certainly is not the only estimate now. Stop typing long enough to really read that article.